
Nearly half of all Americans with health insurance receive coverage through their employer. When the COVID-19 pandemic hit, however, millions of Americans lost their jobs, and nearly 30% of U.S. residents lost their health insurance coverage. While many have returned to employment, health insurance coverage levels are likely still far from the pre-pandemic normal.
It remains to be seen how much of an impact the pandemic has truly had on health coverage in the United States, but there are a number of American counties where even a substantial loss of insurance coverage would not have driven coverage levels below the national figure.
According to the five-year ending in 2019, the most recent year for which data is available through the U.S. Census, on average, as many as 10.3% of Americans under 65 did not have health insurance coverage. In a number of American counties, the uninsured rate was far below this, in many cases less than 5%.
To determine the counties with the best health insurance coverage in every state, 24/7 Wall St. reviewed five-year estimates of the percentage of the noninstitutionalized civilian population under 65 without health insurance from the U.S. Census Bureau’s 2019 American Community Survey. We looked at the population under 65 because Americans 65 and older are automatically entitled to Medicare benefits.
In all states but two, the county with the best health insurance coverage in each state has a lower share of uninsured residents than the national 10.3% share. Fairbanks county, Alaska, and Cleveland County, Oklahoma have the lowest uninsured rate among their state’s qualifying counties, both at 10.8%.
Among the other counties to make this list, generally it is the case that in states with higher insurance coverage of the under 65 population, there is at least one county where less than 5% of the under 65 population lack health insurance. Massachusetts has the lowest uninsured rate in the country, at just 3.2% of the population under 65. Norfolk County, Massachusetts, has the lowest uninsured rate of any county to qualify for this ranking, at 2.1%.
Click here to see the county with the best health insurance coverage in every state.
Click here to see our detailed methodology.

Alabama: Shelby County
> Residents under 65, no health insurance: 7.2% (Alabama: 11.3%)
> Residents under 65, Medicare coverage (or multiple types): 2.7% (Alabama: 4.9%)
> Residents under 65, Medicaid coverage (or multiple types): 9.5% (Alabama: 20.9%)
> Residents under 65, VA coverage (or multiple types): 1.1% (Alabama: 1.7%)
> Residents under 65, employer-based insurance (or multiple types): 72.5% (Alabama: 57.8%)
> Residents under 65, direct-purchase insurance (or multiple types): 11.7% (Alabama: 10.5%)
> Residents under 65, Tricare/military insurance (or many types): 2.1% (Alabama: 3.3%)
[in-text-ad]

Alaska: Fairbanks North Star Borough
> Residents under 65, no health insurance: 10.9% (Alaska: 15.3%)
> Residents under 65, Medicare coverage (or multiple types): 1.4% (Alaska: 1.9%)
> Residents under 65, Medicaid coverage (or multiple types): 14.4% (Alaska: 21.1%)
> Residents under 65, VA coverage (or multiple types): 3.7% (Alaska: 3.0%)
> Residents under 65, employer-based insurance (or multiple types): 56.5% (Alaska: 54.4%)
> Residents under 65, direct-purchase insurance (or multiple types): 7.5% (Alaska: 6.9%)
> Residents under 65, Tricare/military insurance (or many types): 22.0% (Alaska: 9.6%)
[recirclink id=934195]

Arizona: Greenlee County
> Residents under 65, no health insurance: 5.3% (Arizona: 12.4%)
> Residents under 65, Medicare coverage (or multiple types): 2.0% (Arizona: 2.6%)
> Residents under 65, Medicaid coverage (or multiple types): 21.7% (Arizona: 24.1%)
> Residents under 65, VA coverage (or multiple types): 1.6% (Arizona: 1.5%)
> Residents under 65, employer-based insurance (or multiple types): 71.6% (Arizona: 55.1%)
> Residents under 65, direct-purchase insurance (or multiple types): 4.6% (Arizona: 9.7%)
> Residents under 65, Tricare/military insurance (or many types): 0.8% (Arizona: 2.4%)

Arkansas: Grant County
> Residents under 65, no health insurance: 5.8% (Arkansas: 10.1%)
> Residents under 65, Medicare coverage (or multiple types): 4.7% (Arkansas: 5.1%)
> Residents under 65, Medicaid coverage (or multiple types): 28.9% (Arkansas: 28.6%)
> Residents under 65, VA coverage (or multiple types): 2.7% (Arkansas: 1.8%)
> Residents under 65, employer-based insurance (or multiple types): 56.7% (Arkansas: 51.8%)
> Residents under 65, direct-purchase insurance (or multiple types): 11.5% (Arkansas: 10.2%)
> Residents under 65, Tricare/military insurance (or many types): 4.2% (Arkansas: 2.3%)
[in-text-ad-2]

California: San Francisco County
> Residents under 65, no health insurance: 4.2% (California: 8.6%)
> Residents under 65, Medicare coverage (or multiple types): 1.9% (California: 2.2%)
> Residents under 65, Medicaid coverage (or multiple types): 16.6% (California: 27.1%)
> Residents under 65, VA coverage (or multiple types): 0.6% (California: 0.9%)
> Residents under 65, employer-based insurance (or multiple types): 69.3% (California: 55.7%)
> Residents under 65, direct-purchase insurance (or multiple types): 12.8% (California: 10.9%)
> Residents under 65, Tricare/military insurance (or many types): 0.3% (California: 1.4%)
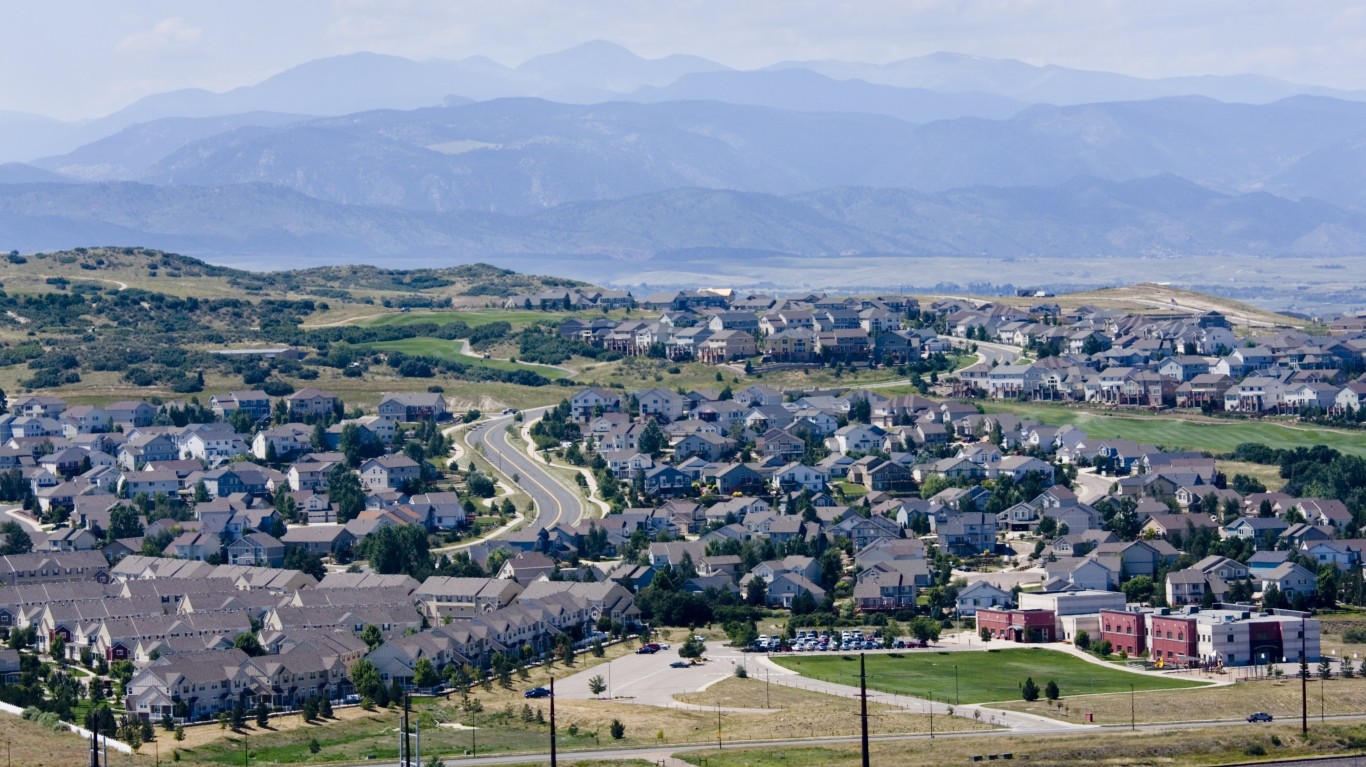
Colorado: Douglas County
> Residents under 65, no health insurance: 3.1% (Colorado: 8.7%)
> Residents under 65, Medicare coverage (or multiple types): 0.9% (Colorado: 2.1%)
> Residents under 65, Medicaid coverage (or multiple types): 6.9% (Colorado: 19.8%)
> Residents under 65, VA coverage (or multiple types): 1.0% (Colorado: 1.5%)
> Residents under 65, employer-based insurance (or multiple types): 80.6% (Colorado: 60.5%)
> Residents under 65, direct-purchase insurance (or multiple types): 11.5% (Colorado: 11.4%)
> Residents under 65, Tricare/military insurance (or many types): 2.1% (Colorado: 3.5%)
[in-text-ad]

Connecticut: Tolland County
> Residents under 65, no health insurance: 3.0% (Connecticut: 6.3%)
> Residents under 65, Medicare coverage (or multiple types): 2.3% (Connecticut: 2.4%)
> Residents under 65, Medicaid coverage (or multiple types): 13.0% (Connecticut: 21.6%)
> Residents under 65, VA coverage (or multiple types): 0.7% (Connecticut: 0.7%)
> Residents under 65, employer-based insurance (or multiple types): 77.3% (Connecticut: 65.1%)
> Residents under 65, direct-purchase insurance (or multiple types): 9.3% (Connecticut: 9.4%)
> Residents under 65, Tricare/military insurance (or many types): 1.2% (Connecticut: 1.0%)
[recirclink id=933306]

Delaware: New Castle County
> Residents under 65, no health insurance: 5.6% (Delaware: 6.8%)
> Residents under 65, Medicare coverage (or multiple types): 2.8% (Delaware: 3.3%)
> Residents under 65, Medicaid coverage (or multiple types): 19.7% (Delaware: 22.5%)
> Residents under 65, VA coverage (or multiple types): 0.8% (Delaware: 1.0%)
> Residents under 65, employer-based insurance (or multiple types): 69.7% (Delaware: 64.4%)
> Residents under 65, direct-purchase insurance (or multiple types): 8.5% (Delaware: 8.6%)
> Residents under 65, Tricare/military insurance (or many types): 1.3% (Delaware: 2.6%)

Florida: Leon County
> Residents under 65, no health insurance: 9.2% (Florida: 15.7%)
> Residents under 65, Medicare coverage (or multiple types): 2.3% (Florida: 3.1%)
> Residents under 65, Medicaid coverage (or multiple types): 14.2% (Florida: 19.2%)
> Residents under 65, VA coverage (or multiple types): 1.4% (Florida: 1.6%)
> Residents under 65, employer-based insurance (or multiple types): 64.3% (Florida: 50.6%)
> Residents under 65, direct-purchase insurance (or multiple types): 14.7% (Florida: 14.5%)
> Residents under 65, Tricare/military insurance (or many types): 2.4% (Florida: 2.7%)
[in-text-ad-2]

Georgia: Chattahoochee County
> Residents under 65, no health insurance: 6.6% (Georgia: 15.2%)
> Residents under 65, Medicare coverage (or multiple types): 5.1% (Georgia: 3.0%)
> Residents under 65, Medicaid coverage (or multiple types): 17.7% (Georgia: 17.9%)
> Residents under 65, VA coverage (or multiple types): 3.5% (Georgia: 1.5%)
> Residents under 65, employer-based insurance (or multiple types): 22.7% (Georgia: 56.9%)
> Residents under 65, direct-purchase insurance (or multiple types): 4.5% (Georgia: 10.2%)
> Residents under 65, Tricare/military insurance (or many types): 56.6% (Georgia: 3.4%)

Hawaii: Honolulu County
> Residents under 65, no health insurance: 4.0% (Hawaii: 4.6%)
> Residents under 65, Medicare coverage (or multiple types): 1.6% (Hawaii: 1.8%)
> Residents under 65, Medicaid coverage (or multiple types): 16.2% (Hawaii: 19.0%)
> Residents under 65, VA coverage (or multiple types): 1.7% (Hawaii: 1.5%)
> Residents under 65, employer-based insurance (or multiple types): 68.1% (Hawaii: 66.3%)
> Residents under 65, direct-purchase insurance (or multiple types): 9.3% (Hawaii: 9.5%)
> Residents under 65, Tricare/military insurance (or many types): 12.1% (Hawaii: 8.8%)
[in-text-ad]

Idaho: Madison County
> Residents under 65, no health insurance: 6.3% (Idaho: 12.4%)
> Residents under 65, Medicare coverage (or multiple types): 1.1% (Idaho: 2.8%)
> Residents under 65, Medicaid coverage (or multiple types): 19.6% (Idaho: 18.2%)
> Residents under 65, VA coverage (or multiple types): 0.1% (Idaho: 1.6%)
> Residents under 65, employer-based insurance (or multiple types): 57.0% (Idaho: 57.4%)
> Residents under 65, direct-purchase insurance (or multiple types): 22.6% (Idaho: 13.8%)
> Residents under 65, Tricare/military insurance (or many types): 1.2% (Idaho: 2.5%)
[recirclink id=924829]

Illinois: Monroe County
> Residents under 65, no health insurance: 3.1% (Illinois: 7.9%)
> Residents under 65, Medicare coverage (or multiple types): 2.3% (Illinois: 2.4%)
> Residents under 65, Medicaid coverage (or multiple types): 8.1% (Illinois: 21.0%)
> Residents under 65, VA coverage (or multiple types): 0.9% (Illinois: 0.8%)
> Residents under 65, employer-based insurance (or multiple types): 82.0% (Illinois: 63.6%)
> Residents under 65, direct-purchase insurance (or multiple types): 8.6% (Illinois: 9.5%)
> Residents under 65, Tricare/military insurance (or many types): 1.0% (Illinois: 0.9%)

Indiana: Clay County
> Residents under 65, no health insurance: 4.9% (Indiana: 9.8%)
> Residents under 65, Medicare coverage (or multiple types): 3.8% (Indiana: 3.2%)
> Residents under 65, Medicaid coverage (or multiple types): 20.0% (Indiana: 19.1%)
> Residents under 65, VA coverage (or multiple types): 0.9% (Indiana: 1.2%)
> Residents under 65, employer-based insurance (or multiple types): 69.0% (Indiana: 64.2%)
> Residents under 65, direct-purchase insurance (or multiple types): 7.9% (Indiana: 8.8%)
> Residents under 65, Tricare/military insurance (or many types): 1.2% (Indiana: 1.2%)
[in-text-ad-2]
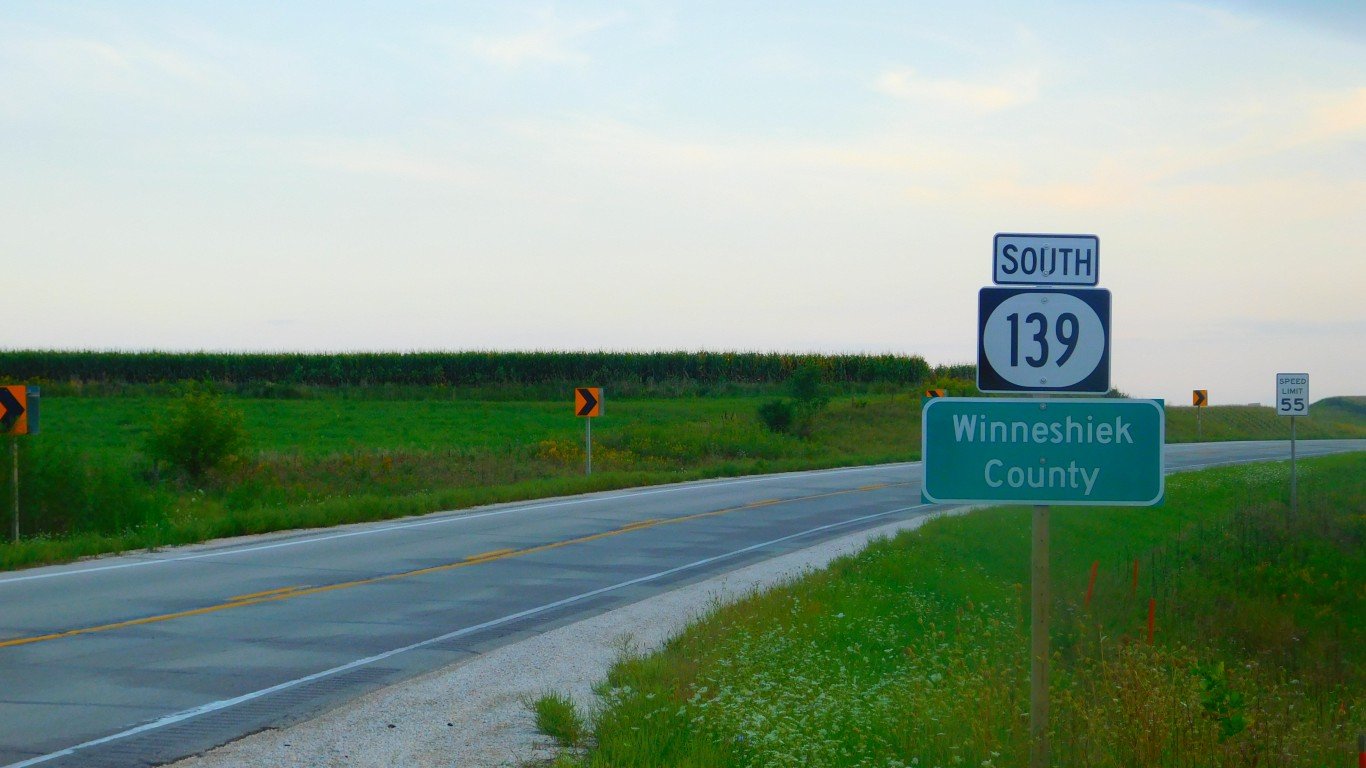
Iowa: Winneshiek County
> Residents under 65, no health insurance: 2.4% (Iowa: 5.5%)
> Residents under 65, Medicare coverage (or multiple types): 2.1% (Iowa: 2.5%)
> Residents under 65, Medicaid coverage (or multiple types): 12.4% (Iowa: 20.4%)
> Residents under 65, VA coverage (or multiple types): 0.8% (Iowa: 1.1%)
> Residents under 65, employer-based insurance (or multiple types): 72.2% (Iowa: 67.4%)
> Residents under 65, direct-purchase insurance (or multiple types): 16.3% (Iowa: 10.6%)
> Residents under 65, Tricare/military insurance (or many types): 0.6% (Iowa: 1.3%)

Kansas: Leavenworth County
> Residents under 65, no health insurance: 5.6% (Kansas: 10.3%)
> Residents under 65, Medicare coverage (or multiple types): 2.8% (Kansas: 2.7%)
> Residents under 65, Medicaid coverage (or multiple types): 12.9% (Kansas: 14.5%)
> Residents under 65, VA coverage (or multiple types): 4.5% (Kansas: 1.4%)
> Residents under 65, employer-based insurance (or multiple types): 63.6% (Kansas: 65.2%)
> Residents under 65, direct-purchase insurance (or multiple types): 9.5% (Kansas: 11.4%)
> Residents under 65, Tricare/military insurance (or many types): 19.9% (Kansas: 3.4%)
[in-text-ad]

Kentucky: Pendleton County
> Residents under 65, no health insurance: 2.9% (Kentucky: 6.7%)
> Residents under 65, Medicare coverage (or multiple types): 9.3% (Kentucky: 5.0%)
> Residents under 65, Medicaid coverage (or multiple types): 28.8% (Kentucky: 28.5%)
> Residents under 65, VA coverage (or multiple types): 0.5% (Kentucky: 1.5%)
> Residents under 65, employer-based insurance (or multiple types): 58.8% (Kentucky: 57.3%)
> Residents under 65, direct-purchase insurance (or multiple types): 7.9% (Kentucky: 8.2%)
> Residents under 65, Tricare/military insurance (or many types): 1.0% (Kentucky: 2.3%)
[recirclink id=937164]

Louisiana: Plaquemines Parish
> Residents under 65, no health insurance: 7.4% (Louisiana: 11.0%)
> Residents under 65, Medicare coverage (or multiple types): 2.4% (Louisiana: 4.0%)
> Residents under 65, Medicaid coverage (or multiple types): 24.7% (Louisiana: 28.4%)
> Residents under 65, VA coverage (or multiple types): 0.9% (Louisiana: 1.3%)
> Residents under 65, employer-based insurance (or multiple types): 51.8% (Louisiana: 52.3%)
> Residents under 65, direct-purchase insurance (or multiple types): 8.9% (Louisiana: 9.6%)
> Residents under 65, Tricare/military insurance (or many types): 15.7% (Louisiana: 2.2%)

Maine: Cumberland County
> Residents under 65, no health insurance: 7.0% (Maine: 9.8%)
> Residents under 65, Medicare coverage (or multiple types): 2.8% (Maine: 4.5%)
> Residents under 65, Medicaid coverage (or multiple types): 12.5% (Maine: 19.3%)
> Residents under 65, VA coverage (or multiple types): 1.1% (Maine: 1.8%)
> Residents under 65, employer-based insurance (or multiple types): 71.3% (Maine: 61.5%)
> Residents under 65, direct-purchase insurance (or multiple types): 11.5% (Maine: 11.0%)
> Residents under 65, Tricare/military insurance (or many types): 1.5% (Maine: 2.3%)
[in-text-ad-2]

Maryland: Carroll County
> Residents under 65, no health insurance: 3.4% (Maryland: 6.9%)
> Residents under 65, Medicare coverage (or multiple types): 2.2% (Maryland: 2.6%)
> Residents under 65, Medicaid coverage (or multiple types): 12.5% (Maryland: 19.1%)
> Residents under 65, VA coverage (or multiple types): 0.9% (Maryland: 1.2%)
> Residents under 65, employer-based insurance (or multiple types): 76.3% (Maryland: 65.7%)
> Residents under 65, direct-purchase insurance (or multiple types): 9.7% (Maryland: 9.6%)
> Residents under 65, Tricare/military insurance (or many types): 2.3% (Maryland: 3.1%)

Massachusetts: Norfolk County
> Residents under 65, no health insurance: 2.1% (Massachusetts: 3.2%)
> Residents under 65, Medicare coverage (or multiple types): 1.8% (Massachusetts: 2.5%)
> Residents under 65, Medicaid coverage (or multiple types): 14.6% (Massachusetts: 24.0%)
> Residents under 65, VA coverage (or multiple types): 0.5% (Massachusetts: 0.6%)
> Residents under 65, employer-based insurance (or multiple types): 77.5% (Massachusetts: 67.5%)
> Residents under 65, direct-purchase insurance (or multiple types): 10.6% (Massachusetts: 9.9%)
> Residents under 65, Tricare/military insurance (or many types): 0.6% (Massachusetts: 0.8%)
[in-text-ad]
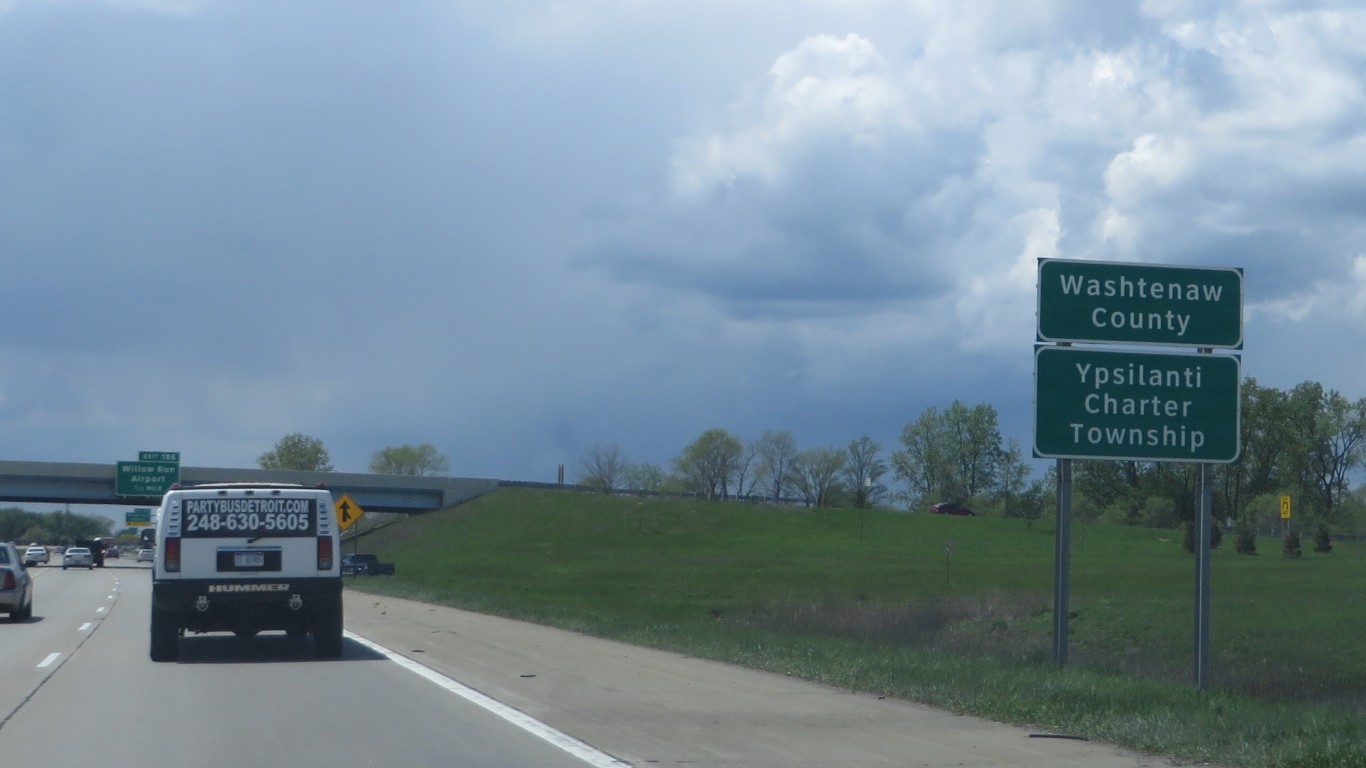
Michigan: Washtenaw County
> Residents under 65, no health insurance: 4.0% (Michigan: 6.5%)
> Residents under 65, Medicare coverage (or multiple types): 2.4% (Michigan: 3.7%)
> Residents under 65, Medicaid coverage (or multiple types): 13.4% (Michigan: 24.2%)
> Residents under 65, VA coverage (or multiple types): 0.9% (Michigan: 1.0%)
> Residents under 65, employer-based insurance (or multiple types): 73.4% (Michigan: 63.3%)
> Residents under 65, direct-purchase insurance (or multiple types): 12.2% (Michigan: 9.1%)
> Residents under 65, Tricare/military insurance (or many types): 0.9% (Michigan: 0.9%)
[recirclink id=934195]

Minnesota: Stevens County
> Residents under 65, no health insurance: 2.6% (Minnesota: 5.2%)
> Residents under 65, Medicare coverage (or multiple types): 2.0% (Minnesota: 2.1%)
> Residents under 65, Medicaid coverage (or multiple types): 15.0% (Minnesota: 19.4%)
> Residents under 65, VA coverage (or multiple types): 0.7% (Minnesota: 1.0%)
> Residents under 65, employer-based insurance (or multiple types): 71.4% (Minnesota: 68.6%)
> Residents under 65, direct-purchase insurance (or multiple types): 14.2% (Minnesota: 9.9%)
> Residents under 65, Tricare/military insurance (or many types): 1.0% (Minnesota: 1.0%)

Mississippi: Madison County
> Residents under 65, no health insurance: 7.8% (Mississippi: 14.5%)
> Residents under 65, Medicare coverage (or multiple types): 2.3% (Mississippi: 4.7%)
> Residents under 65, Medicaid coverage (or multiple types): 13.6% (Mississippi: 25.1%)
> Residents under 65, VA coverage (or multiple types): 1.1% (Mississippi: 1.4%)
> Residents under 65, employer-based insurance (or multiple types): 67.2% (Mississippi: 51.2%)
> Residents under 65, direct-purchase insurance (or multiple types): 14.6% (Mississippi: 9.5%)
> Residents under 65, Tricare/military insurance (or many types): 1.5% (Mississippi: 3.0%)
[in-text-ad-2]

Missouri: St. Charles County
> Residents under 65, no health insurance: 5.2% (Missouri: 11.1%)
> Residents under 65, Medicare coverage (or multiple types): 2.2% (Missouri: 3.8%)
> Residents under 65, Medicaid coverage (or multiple types): 6.0% (Missouri: 15.8%)
> Residents under 65, VA coverage (or multiple types): 0.9% (Missouri: 1.4%)
> Residents under 65, employer-based insurance (or multiple types): 81.2% (Missouri: 62.9%)
> Residents under 65, direct-purchase insurance (or multiple types): 9.0% (Missouri: 10.5%)
> Residents under 65, Tricare/military insurance (or many types): 1.4% (Missouri: 2.0%)

Montana: Dawson County
> Residents under 65, no health insurance: 4.9% (Montana: 10.9%)
> Residents under 65, Medicare coverage (or multiple types): 2.7% (Montana: 3.0%)
> Residents under 65, Medicaid coverage (or multiple types): 18.0% (Montana: 21.4%)
> Residents under 65, VA coverage (or multiple types): 2.0% (Montana: 2.1%)
> Residents under 65, employer-based insurance (or multiple types): 68.2% (Montana: 54.9%)
> Residents under 65, direct-purchase insurance (or multiple types): 16.1% (Montana: 13.9%)
> Residents under 65, Tricare/military insurance (or many types): 0.6% (Montana: 3.0%)
[in-text-ad]

Nebraska: Wayne County
> Residents under 65, no health insurance: 4.3% (Nebraska: 9.5%)
> Residents under 65, Medicare coverage (or multiple types): 1.5% (Nebraska: 2.2%)
> Residents under 65, Medicaid coverage (or multiple types): 6.3% (Nebraska: 13.4%)
> Residents under 65, VA coverage (or multiple types): 0.9% (Nebraska: 1.4%)
> Residents under 65, employer-based insurance (or multiple types): 78.4% (Nebraska: 66.1%)
> Residents under 65, direct-purchase insurance (or multiple types): 16.3% (Nebraska: 12.9%)
> Residents under 65, Tricare/military insurance (or many types): 1.2% (Nebraska: 2.7%)
[recirclink id=933306]

Nevada: White Pine County
> Residents under 65, no health insurance: 9.5% (Nevada: 12.9%)
> Residents under 65, Medicare coverage (or multiple types): 2.3% (Nevada: 2.5%)
> Residents under 65, Medicaid coverage (or multiple types): 20.8% (Nevada: 20.0%)
> Residents under 65, VA coverage (or multiple types): 1.2% (Nevada: 1.7%)
> Residents under 65, employer-based insurance (or multiple types): 63.9% (Nevada: 58.7%)
> Residents under 65, direct-purchase insurance (or multiple types): 7.6% (Nevada: 9.1%)
> Residents under 65, Tricare/military insurance (or many types): 1.9% (Nevada: 2.7%)

New Hampshire: Rockingham County
> Residents under 65, no health insurance: 5.3% (New Hampshire: 7.1%)
> Residents under 65, Medicare coverage (or multiple types): 2.3% (New Hampshire: 3.2%)
> Residents under 65, Medicaid coverage (or multiple types): 9.6% (New Hampshire: 14.6%)
> Residents under 65, VA coverage (or multiple types): 1.0% (New Hampshire: 1.3%)
> Residents under 65, employer-based insurance (or multiple types): 76.5% (New Hampshire: 69.8%)
> Residents under 65, direct-purchase insurance (or multiple types): 9.9% (New Hampshire: 9.3%)
> Residents under 65, Tricare/military insurance (or many types): 1.5% (New Hampshire: 1.5%)
[in-text-ad-2]

New Jersey: Hunterdon County
> Residents under 65, no health insurance: 3.2% (New Jersey: 9.0%)
> Residents under 65, Medicare coverage (or multiple types): 1.4% (New Jersey: 2.4%)
> Residents under 65, Medicaid coverage (or multiple types): 8.0% (New Jersey: 17.7%)
> Residents under 65, VA coverage (or multiple types): 0.5% (New Jersey: 0.4%)
> Residents under 65, employer-based insurance (or multiple types): 82.0% (New Jersey: 66.5%)
> Residents under 65, direct-purchase insurance (or multiple types): 9.1% (New Jersey: 8.9%)
> Residents under 65, Tricare/military insurance (or many types): 0.4% (New Jersey: 0.7%)

New Mexico: Los Alamos County
> Residents under 65, no health insurance: 3.7% (New Mexico: 11.4%)
> Residents under 65, Medicare coverage (or multiple types): 0.5% (New Mexico: 3.6%)
> Residents under 65, Medicaid coverage (or multiple types): 5.0% (New Mexico: 35.6%)
> Residents under 65, VA coverage (or multiple types): 0.7% (New Mexico: 1.7%)
> Residents under 65, employer-based insurance (or multiple types): 87.8% (New Mexico: 46.4%)
> Residents under 65, direct-purchase insurance (or multiple types): 5.9% (New Mexico: 8.0%)
> Residents under 65, Tricare/military insurance (or many types): 2.0% (New Mexico: 3.3%)
[in-text-ad]

New York: Cortland County
> Residents under 65, no health insurance: 3.7% (New York: 6.7%)
> Residents under 65, Medicare coverage (or multiple types): 3.1% (New York: 2.8%)
> Residents under 65, Medicaid coverage (or multiple types): 21.6% (New York: 26.9%)
> Residents under 65, VA coverage (or multiple types): 1.1% (New York: 0.6%)
> Residents under 65, employer-based insurance (or multiple types): 69.6% (New York: 59.7%)
> Residents under 65, direct-purchase insurance (or multiple types): 8.8% (New York: 10.8%)
> Residents under 65, Tricare/military insurance (or many types): 0.7% (New York: 0.7%)
[recirclink id=924829]

North Carolina: Orange County
> Residents under 65, no health insurance: 8.0% (North Carolina: 12.6%)
> Residents under 65, Medicare coverage (or multiple types): 1.6% (North Carolina: 3.5%)
> Residents under 65, Medicaid coverage (or multiple types): 10.0% (North Carolina: 19.4%)
> Residents under 65, VA coverage (or multiple types): 0.7% (North Carolina: 1.7%)
> Residents under 65, employer-based insurance (or multiple types): 68.4% (North Carolina: 55.9%)
> Residents under 65, direct-purchase insurance (or multiple types): 15.3% (North Carolina: 11.7%)
> Residents under 65, Tricare/military insurance (or many types): 1.4% (North Carolina: 3.8%)

North Dakota: Richland County
> Residents under 65, no health insurance: 4.1% (North Dakota: 8.5%)
> Residents under 65, Medicare coverage (or multiple types): 2.0% (North Dakota: 2.1%)
> Residents under 65, Medicaid coverage (or multiple types): 13.6% (North Dakota: 11.4%)
> Residents under 65, VA coverage (or multiple types): 0.8% (North Dakota: 1.4%)
> Residents under 65, employer-based insurance (or multiple types): 69.8% (North Dakota: 67.6%)
> Residents under 65, direct-purchase insurance (or multiple types): 16.9% (North Dakota: 14.3%)
> Residents under 65, Tricare/military insurance (or many types): 2.3% (North Dakota: 3.4%)
[in-text-ad-2]

Ohio: Putnam County
> Residents under 65, no health insurance: 3.5% (Ohio: 7.2%)
> Residents under 65, Medicare coverage (or multiple types): 1.9% (Ohio: 3.3%)
> Residents under 65, Medicaid coverage (or multiple types): 11.1% (Ohio: 22.8%)
> Residents under 65, VA coverage (or multiple types): 0.5% (Ohio: 1.2%)
> Residents under 65, employer-based insurance (or multiple types): 80.4% (Ohio: 64.0%)
> Residents under 65, direct-purchase insurance (or multiple types): 8.6% (Ohio: 7.8%)
> Residents under 65, Tricare/military insurance (or many types): 0.5% (Ohio: 1.2%)
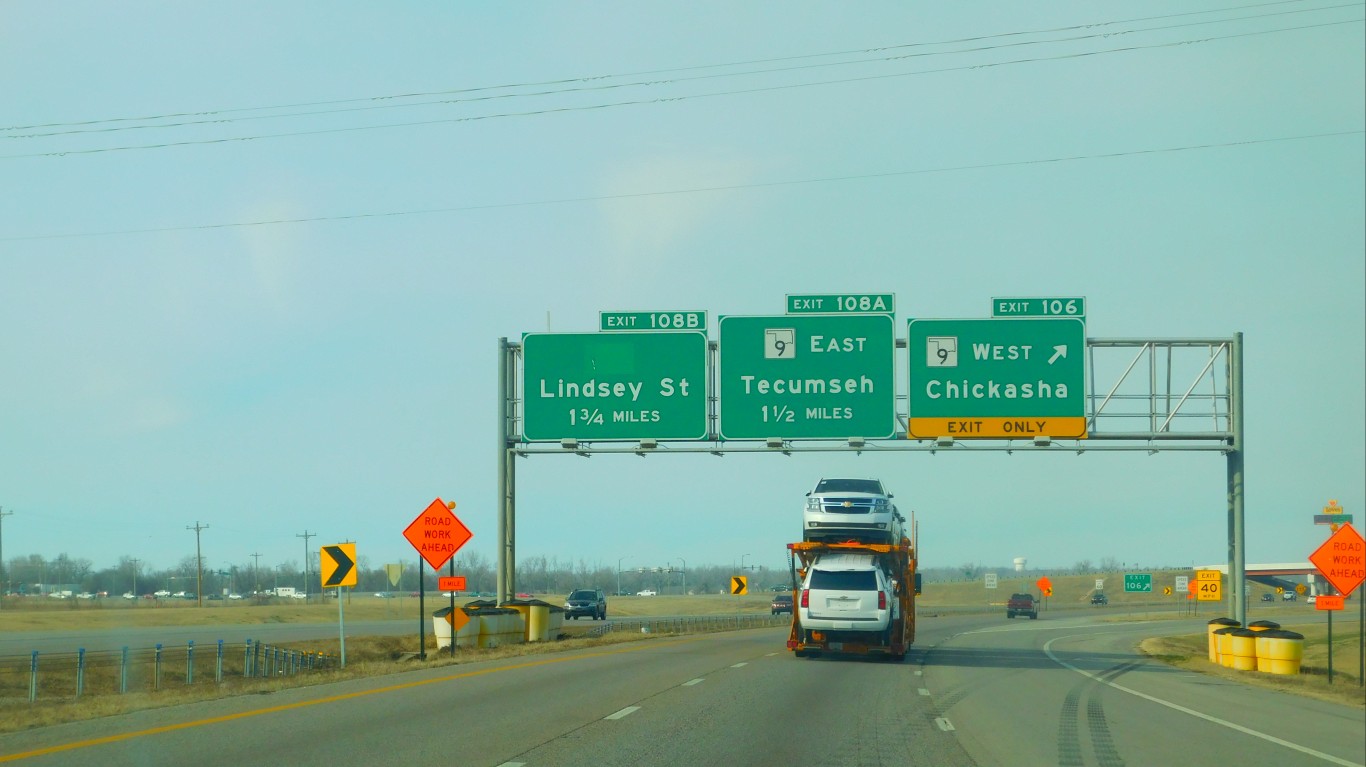
Oklahoma: Cleveland County
> Residents under 65, no health insurance: 10.8% (Oklahoma: 16.5%)
> Residents under 65, Medicare coverage (or multiple types): 3.0% (Oklahoma: 3.9%)
> Residents under 65, Medicaid coverage (or multiple types): 11.7% (Oklahoma: 18.8%)
> Residents under 65, VA coverage (or multiple types): 1.9% (Oklahoma: 1.8%)
> Residents under 65, employer-based insurance (or multiple types): 66.1% (Oklahoma: 54.4%)
> Residents under 65, direct-purchase insurance (or multiple types): 11.3% (Oklahoma: 9.9%)
> Residents under 65, Tricare/military insurance (or many types): 4.5% (Oklahoma: 3.1%)
[in-text-ad]

Oregon: Benton County
> Residents under 65, no health insurance: 6.0% (Oregon: 8.0%)
> Residents under 65, Medicare coverage (or multiple types): 2.1% (Oregon: 2.8%)
> Residents under 65, Medicaid coverage (or multiple types): 17.4% (Oregon: 24.7%)
> Residents under 65, VA coverage (or multiple types): 1.3% (Oregon: 1.6%)
> Residents under 65, employer-based insurance (or multiple types): 66.0% (Oregon: 59.2%)
> Residents under 65, direct-purchase insurance (or multiple types): 14.0% (Oregon: 11.0%)
> Residents under 65, Tricare/military insurance (or many types): 1.9% (Oregon: 1.4%)
[recirclink id=937164]

Pennsylvania: Elk County
> Residents under 65, no health insurance: 3.6% (Pennsylvania: 6.8%)
> Residents under 65, Medicare coverage (or multiple types): 4.5% (Pennsylvania: 3.2%)
> Residents under 65, Medicaid coverage (or multiple types): 21.8% (Pennsylvania: 21.1%)
> Residents under 65, VA coverage (or multiple types): 1.4% (Pennsylvania: 1.0%)
> Residents under 65, employer-based insurance (or multiple types): 71.7% (Pennsylvania: 65.2%)
> Residents under 65, direct-purchase insurance (or multiple types): 10.5% (Pennsylvania: 10.2%)
> Residents under 65, Tricare/military insurance (or many types): 0.6% (Pennsylvania: 1.0%)

Rhode Island: Bristol County
> Residents under 65, no health insurance: 2.7% (Rhode Island: 5.3%)
> Residents under 65, Medicare coverage (or multiple types): 2.1% (Rhode Island: 3.4%)
> Residents under 65, Medicaid coverage (or multiple types): 15.2% (Rhode Island: 23.2%)
> Residents under 65, VA coverage (or multiple types): 0.8% (Rhode Island: 1.0%)
> Residents under 65, employer-based insurance (or multiple types): 71.6% (Rhode Island: 64.1%)
> Residents under 65, direct-purchase insurance (or multiple types): 15.2% (Rhode Island: 10.8%)
> Residents under 65, Tricare/military insurance (or many types): 0.9% (Rhode Island: 1.4%)
[in-text-ad-2]

South Carolina: York County
> Residents under 65, no health insurance: 9.3% (South Carolina: 12.6%)
> Residents under 65, Medicare coverage (or multiple types): 2.4% (South Carolina: 3.8%)
> Residents under 65, Medicaid coverage (or multiple types): 14.5% (South Carolina: 20.7%)
> Residents under 65, VA coverage (or multiple types): 1.2% (South Carolina: 1.8%)
> Residents under 65, employer-based insurance (or multiple types): 67.5% (South Carolina: 56.5%)
> Residents under 65, direct-purchase insurance (or multiple types): 9.9% (South Carolina: 10.4%)
> Residents under 65, Tricare/military insurance (or many types): 2.1% (South Carolina: 3.7%)

South Dakota: Lincoln County
> Residents under 65, no health insurance: 5.3% (South Dakota: 11.2%)
> Residents under 65, Medicare coverage (or multiple types): 2.0% (South Dakota: 2.7%)
> Residents under 65, Medicaid coverage (or multiple types): 8.2% (South Dakota: 15.3%)
> Residents under 65, VA coverage (or multiple types): 1.3% (South Dakota: 1.9%)
> Residents under 65, employer-based insurance (or multiple types): 77.0% (South Dakota: 61.1%)
> Residents under 65, direct-purchase insurance (or multiple types): 11.1% (South Dakota: 13.7%)
> Residents under 65, Tricare/military insurance (or many types): 3.5% (South Dakota: 3.4%)
[in-text-ad]

Tennessee: Williamson County
> Residents under 65, no health insurance: 5.2% (Tennessee: 11.4%)
> Residents under 65, Medicare coverage (or multiple types): 1.1% (Tennessee: 3.8%)
> Residents under 65, Medicaid coverage (or multiple types): 6.0% (Tennessee: 21.6%)
> Residents under 65, VA coverage (or multiple types): 0.5% (Tennessee: 1.6%)
> Residents under 65, employer-based insurance (or multiple types): 75.8% (Tennessee: 57.8%)
> Residents under 65, direct-purchase insurance (or multiple types): 15.8% (Tennessee: 10.1%)
> Residents under 65, Tricare/military insurance (or many types): 1.6% (Tennessee: 2.7%)
[recirclink id=934195]

Texas: Armstrong County
> Residents under 65, no health insurance: 9.2% (Texas: 19.4%)
> Residents under 65, Medicare coverage (or multiple types): 3.3% (Texas: 2.2%)
> Residents under 65, Medicaid coverage (or multiple types): 9.5% (Texas: 17.2%)
> Residents under 65, VA coverage (or multiple types): 3.0% (Texas: 1.3%)
> Residents under 65, employer-based insurance (or multiple types): 71.0% (Texas: 54.5%)
> Residents under 65, direct-purchase insurance (or multiple types): 10.5% (Texas: 9.4%)
> Residents under 65, Tricare/military insurance (or many types): 2.6% (Texas: 2.3%)

Utah: Morgan County
> Residents under 65, no health insurance: 6.7% (Utah: 10.4%)
> Residents under 65, Medicare coverage (or multiple types): 1.0% (Utah: 1.5%)
> Residents under 65, Medicaid coverage (or multiple types): 7.5% (Utah: 10.7%)
> Residents under 65, VA coverage (or multiple types): 0.5% (Utah: 0.8%)
> Residents under 65, employer-based insurance (or multiple types): 73.1% (Utah: 68.4%)
> Residents under 65, direct-purchase insurance (or multiple types): 13.1% (Utah: 12.5%)
> Residents under 65, Tricare/military insurance (or many types): 1.1% (Utah: 1.8%)
[in-text-ad-2]

Vermont: Chittenden County
> Residents under 65, no health insurance: 3.5% (Vermont: 4.8%)
> Residents under 65, Medicare coverage (or multiple types): 2.5% (Vermont: 3.8%)
> Residents under 65, Medicaid coverage (or multiple types): 18.3% (Vermont: 27.1%)
> Residents under 65, VA coverage (or multiple types): 0.8% (Vermont: 1.2%)
> Residents under 65, employer-based insurance (or multiple types): 70.2% (Vermont: 60.5%)
> Residents under 65, direct-purchase insurance (or multiple types): 10.4% (Vermont: 10.1%)
> Residents under 65, Tricare/military insurance (or many types): 1.7% (Vermont: 1.6%)

Virginia: York County
> Residents under 65, no health insurance: 4.7% (Virginia: 10.0%)
> Residents under 65, Medicare coverage (or multiple types): 1.1% (Virginia: 2.7%)
> Residents under 65, Medicaid coverage (or multiple types): 6.3% (Virginia: 12.6%)
> Residents under 65, VA coverage (or multiple types): 3.0% (Virginia: 2.1%)
> Residents under 65, employer-based insurance (or multiple types): 60.6% (Virginia: 63.9%)
> Residents under 65, direct-purchase insurance (or multiple types): 9.0% (Virginia: 11.0%)
> Residents under 65, Tricare/military insurance (or many types): 28.9% (Virginia: 7.1%)
[in-text-ad]

Washington: Whitman County
> Residents under 65, no health insurance: 4.4% (Washington: 7.3%)
> Residents under 65, Medicare coverage (or multiple types): 2.0% (Washington: 2.5%)
> Residents under 65, Medicaid coverage (or multiple types): 16.1% (Washington: 22.0%)
> Residents under 65, VA coverage (or multiple types): 1.3% (Washington: 1.6%)
> Residents under 65, employer-based insurance (or multiple types): 68.1% (Washington: 62.3%)
> Residents under 65, direct-purchase insurance (or multiple types): 16.3% (Washington: 9.7%)
> Residents under 65, Tricare/military insurance (or many types): 2.5% (Washington: 3.6%)
[recirclink id=933306]

West Virginia: Monongalia County
> Residents under 65, no health insurance: 5.3% (West Virginia: 7.4%)
> Residents under 65, Medicare coverage (or multiple types): 2.6% (West Virginia: 5.4%)
> Residents under 65, Medicaid coverage (or multiple types): 17.1% (West Virginia: 30.3%)
> Residents under 65, VA coverage (or multiple types): 1.2% (West Virginia: 1.8%)
> Residents under 65, employer-based insurance (or multiple types): 69.8% (West Virginia: 57.1%)
> Residents under 65, direct-purchase insurance (or multiple types): 10.5% (West Virginia: 6.4%)
> Residents under 65, Tricare/military insurance (or many types): 1.6% (West Virginia: 1.6%)

Wisconsin: Waukesha County
> Residents under 65, no health insurance: 3.3% (Wisconsin: 6.4%)
> Residents under 65, Medicare coverage (or multiple types): 1.8% (Wisconsin: 2.7%)
> Residents under 65, Medicaid coverage (or multiple types): 8.7% (Wisconsin: 18.0%)
> Residents under 65, VA coverage (or multiple types): 0.8% (Wisconsin: 1.1%)
> Residents under 65, employer-based insurance (or multiple types): 81.4% (Wisconsin: 69.1%)
> Residents under 65, direct-purchase insurance (or multiple types): 9.3% (Wisconsin: 9.4%)
> Residents under 65, Tricare/military insurance (or many types): 0.8% (Wisconsin: 1.0%)
[in-text-ad-2]

Wyoming: Albany County
> Residents under 65, no health insurance: 9.1% (Wyoming: 13.5%)
> Residents under 65, Medicare coverage (or multiple types): 1.3% (Wyoming: 2.3%)
> Residents under 65, Medicaid coverage (or multiple types): 8.4% (Wyoming: 12.1%)
> Residents under 65, VA coverage (or multiple types): 2.0% (Wyoming: 1.8%)
> Residents under 65, employer-based insurance (or multiple types): 68.5% (Wyoming: 64.1%)
> Residents under 65, direct-purchase insurance (or multiple types): 15.5% (Wyoming: 11.4%)
> Residents under 65, Tricare/military insurance (or many types): 3.3% (Wyoming: 3.0%)
Methodology:
To determine the county with the best health insurance coverage in every state, 24/7 Wall St. reviewed five-year estimates of the percentage of the noninstitutionalized civilian population under 65 without health insurance from the U.S. Census Bureau’s 2019 American Community Survey.
Of the 3,220 counties or county equivalents, 3,141 had boundaries that fell within one of the 50 states, while the rest were in the District of Columbia or Puerto Rico.
Counties were excluded if the noninstitutionalized civilian population under 65 was less than 1,000, or if the sampling error associated with a county’s data was deemed too high.
The sampling error was defined as too high if the coefficient of variation — a statistical assessment of how reliable an estimate is — for a county’s under 65 uninsured rate was above 15% and greater than two standard deviations above the mean CV for all counties’ under 65 uninsured rates. We similarly excluded counties that had a sampling error too high for their under 65 noninstitutionalized civilian population, using the same definition.
We selected the under 65 age group because Americans become eligible for Medicare at age 65, and the uninsured rate for the population above this age is less than 1% nationwide. However, because the census does not publish insurance coverage estimates specifically for the under 65 age group, we aggregated the data from more granular age breakdowns.
To ensure each aggregate estimate’s sampling error could be assessed using the definition above, we derived a margin of error for each aggregate estimate using the successive differences replication variance estimation methodology recommended and used by the U.S. Census Bureau.
The remaining 2,945 places were ranked within their state based on their under 65 uninsured rates. To break ties, we used the number of insured people in the same population group.
The share of the population covered by each type of insurance — Medicare, Medicaid, VA, employer, direct-purchase, and Tricare/military — are for the same cohort and are also aggregated from five-year ACS estimates. The estimates reflect people who are covered by that type of insurance alone or in combination with other types on the list. So, when a person is covered by more than one type of insurance, they are included in each group.