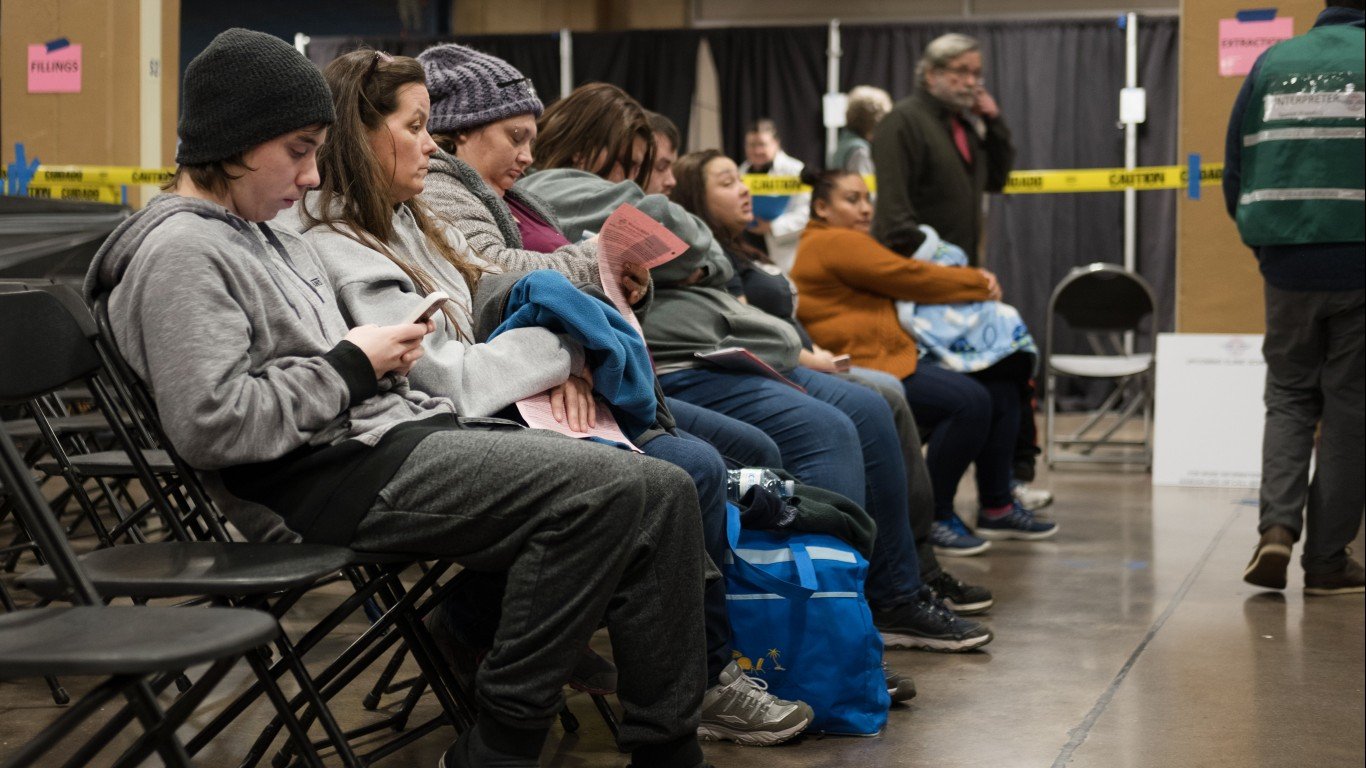
The nation’s poverty rose from 2019 to 2020, according to the U.S. Census Bureau’s “Income, Poverty and Health Insurance Coverage in the United States: 2020.” It was the first increase in five years, with the poverty rate rising from 10.5% to 11.4%. The report also indicates that 37.2 million people were living in poverty in 2020, nearly 3.3 million more than in 2019.
It surprised some that the poverty rate did not rise higher last year. But government programs to combat the economic effects of the COVID-19 pandemic helped. According to The New York Times, “The fact that poverty did not rise more during an enormous economic disruption reflects the equally enormous government response.”
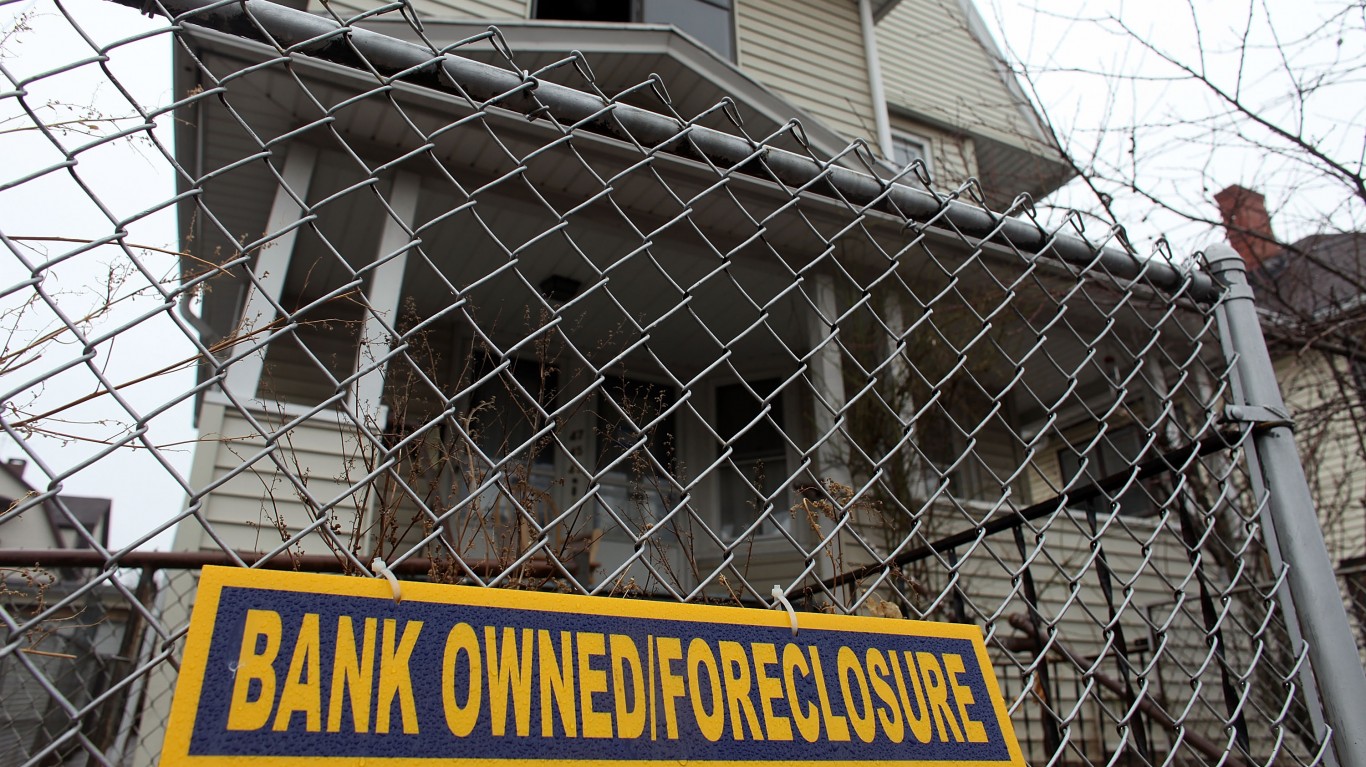
The poverty rate has been below 13% most years since 1997. The exception is the period of The Great Recession. The figure moved to 15.1% in 2010, and then 15.1% in 2011 and 2012. Looking further back, poverty was even higher than that in the early 1960s, at around 20%. Looking at the more current situation nationwide, here is the metro with the highest poverty rate in every state.
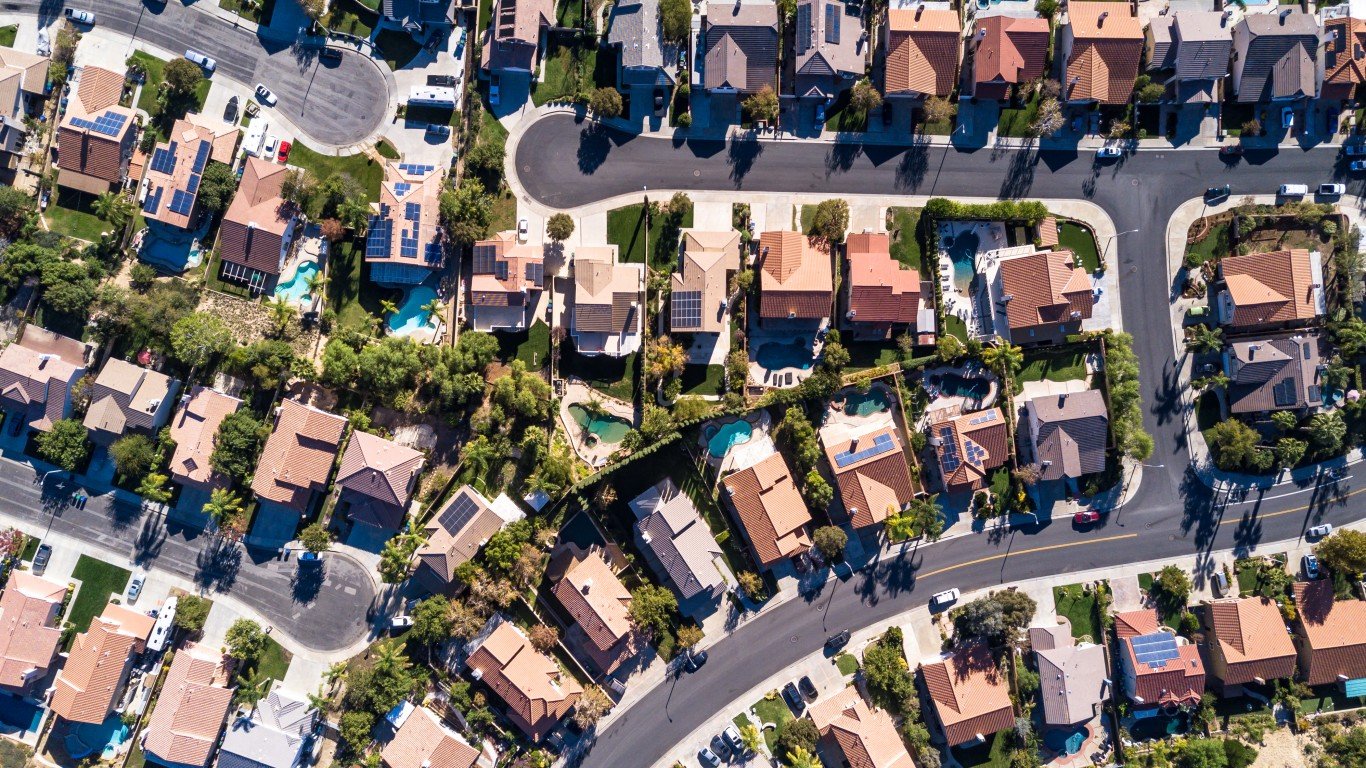
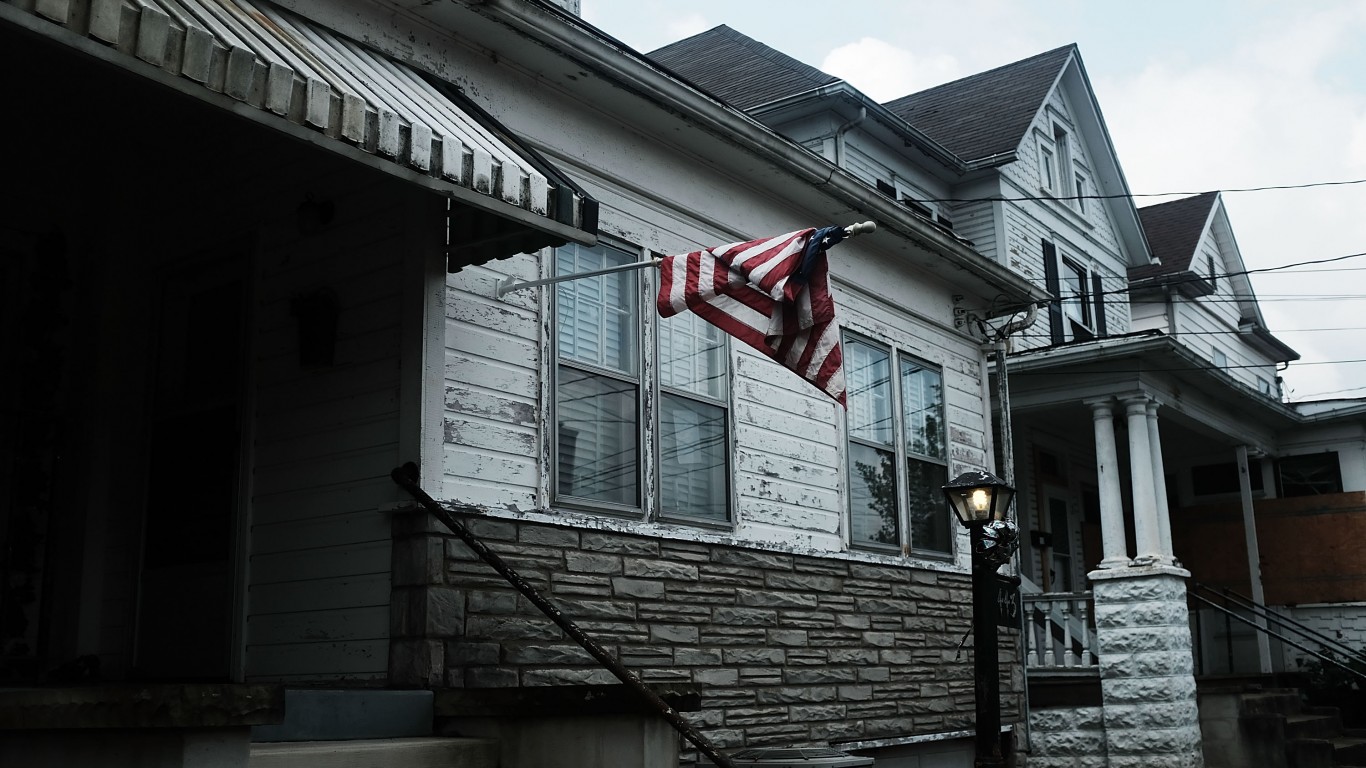
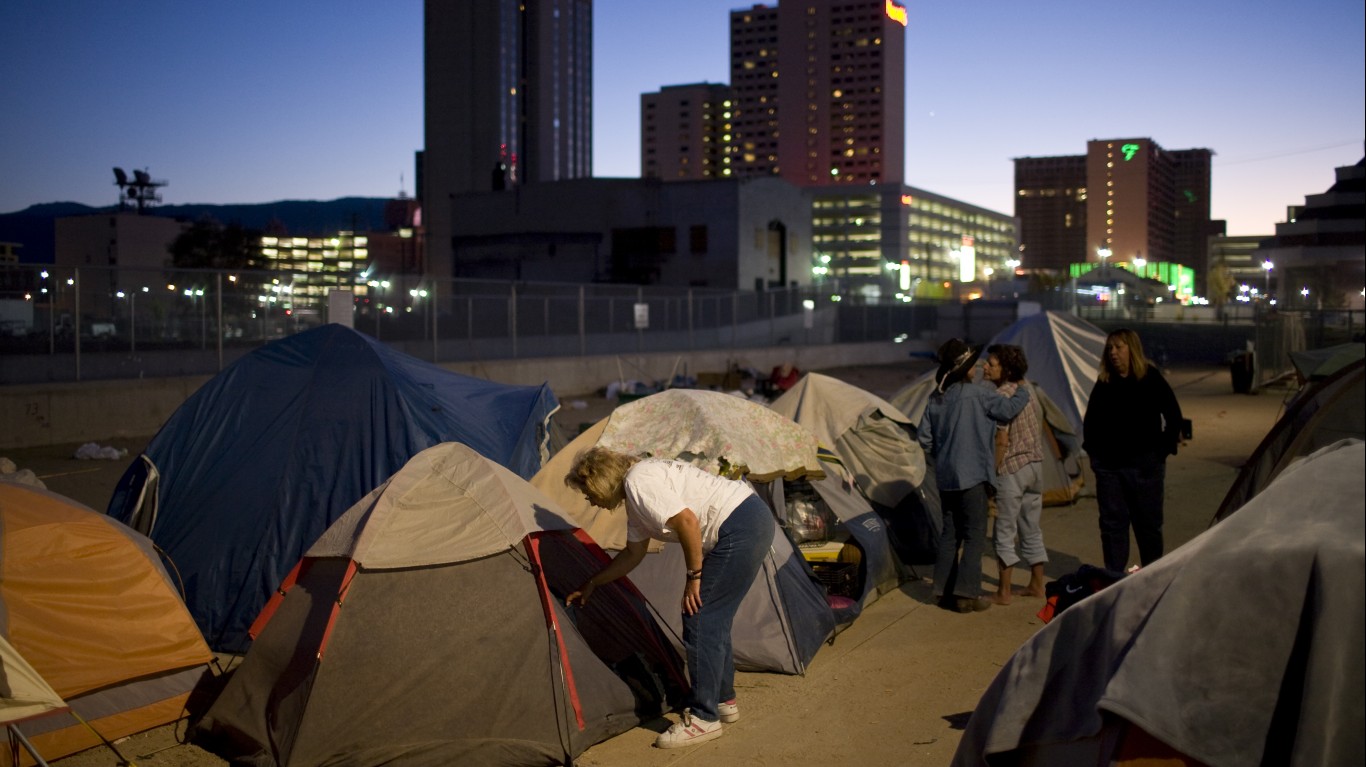
Poverty has a wide range of effects on America’s poor. People living in poverty are less likely to be healthy than the rest of the population. They are less likely to be well educated. They are less likely to have access to healthy food. To be poor usually also means to stay poor, according to several studies and research from the OECD. While the ability of people to climb out of poverty is not exactly a myth, it is rare. For people living in extreme poverty it’s even harder. Here is the city hit hardest by extreme poverty in every state.
To find the poverty rate the year you were born, 24/7 Wall St. looked at the percentage of Americans who lived below the poverty line from 1959 until 2020. The official poverty thresholds do not vary geographically, but they are updated for inflation using the consumer price index. The official poverty definition uses money income before taxes and does not include capital gains or noncash benefits, such as public housing, Medicaid, and food stamps.
Click here to see the poverty rate the year you were born
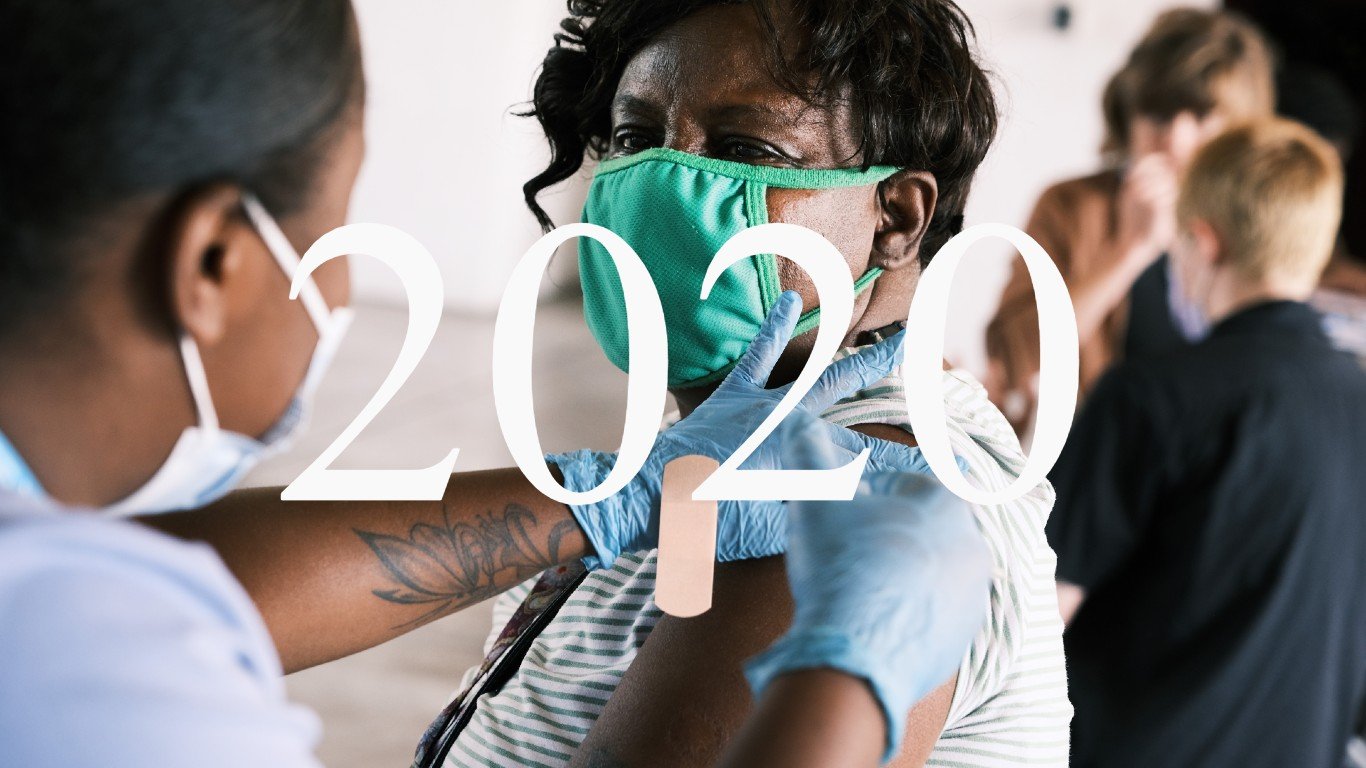
2020
> US population: 325,713,000
> Population below poverty line: 37,247,000
> Percent of all people in poverty: 11.4%
> Poverty threshold for unrelated individuals: $13,171
[in-text-ad]

2019
> US population: 324,754,000
> Population below poverty line: 33,984,000
> Percent of all people in poverty: 10.5%
> Poverty threshold for unrelated individuals: $13,011
 PARIS, FRANCE – MAY 31: Serena Williams of The United States celebrates during the ladies singles second round match against Ashleigh Barty of Ausralia during day five of the 2018 French Open at Roland Garros on May 31, 2018 in Paris, France. (Photo by Clive Brunskill/Getty Images)
2018
> US population: 323,847,000
> Population below poverty line: 38,146,000
> Percent of all people in poverty: 11.8%
> Poverty threshold for unrelated individuals: $12,784

2017
> US population: 322,549,000
> Population below poverty line: 39,698,000
> Percent of all people in poverty: 12.3%
> Poverty threshold for unrelated individuals: $12,488
[recirclink id=936172]

2016
> US population: 319,911,000
> Population below poverty line: 40,616,000
> Percent of all people in poverty: 12.7%
> Poverty threshold for unrelated individuals: $12,228
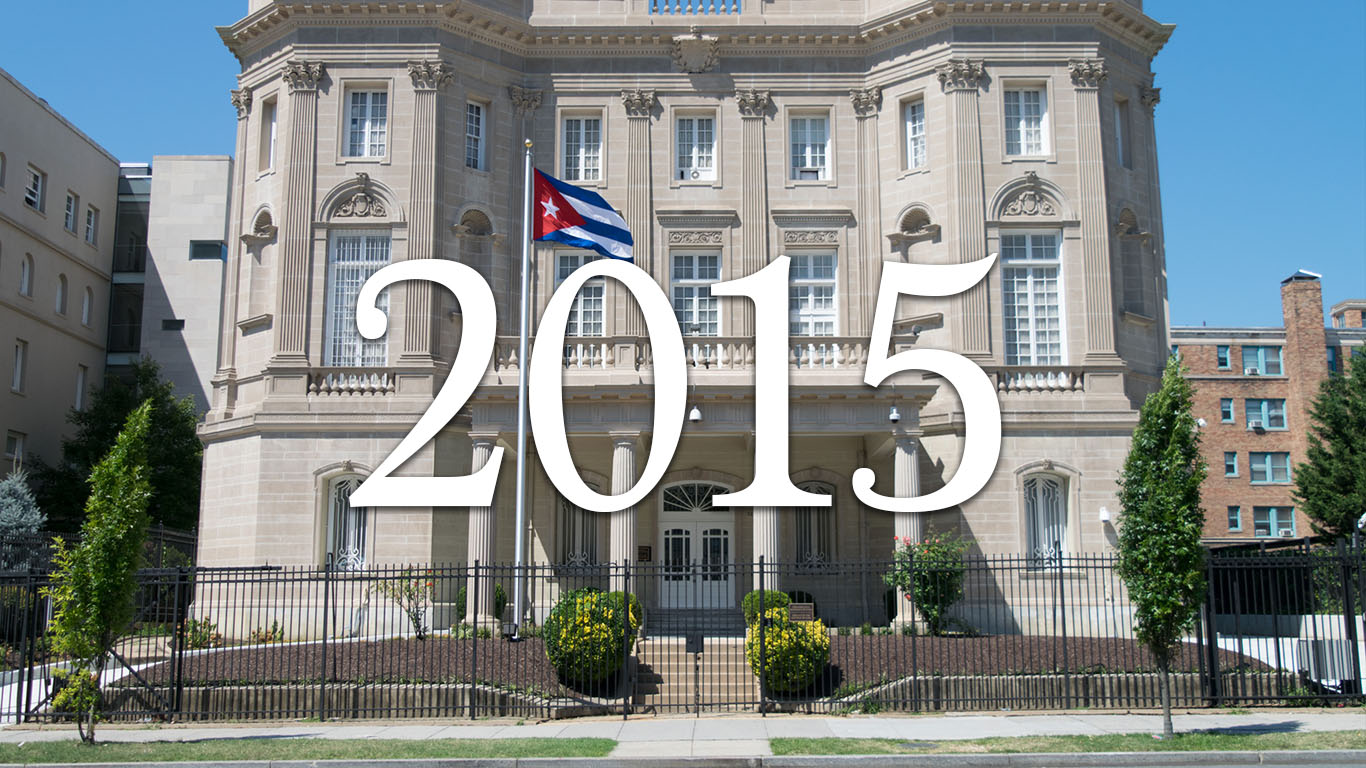
2015
> US population: 318,454,000
> Population below poverty line: 43,123,000
> Percent of all people in poverty: 13.5%
> Poverty threshold for unrelated individuals: $12,082

2014
> US population: 315,804,000
> Population below poverty line: 46,657,000
> Percent of all people in poverty: 14.8%
> Poverty threshold for unrelated individuals: $12,071
[in-text-ad-2]

2013
> US population: 313,096,000
> Population below poverty line: 46,269,000
> Percent of all people in poverty: 14.8%
> Poverty threshold for unrelated individuals: $11,880
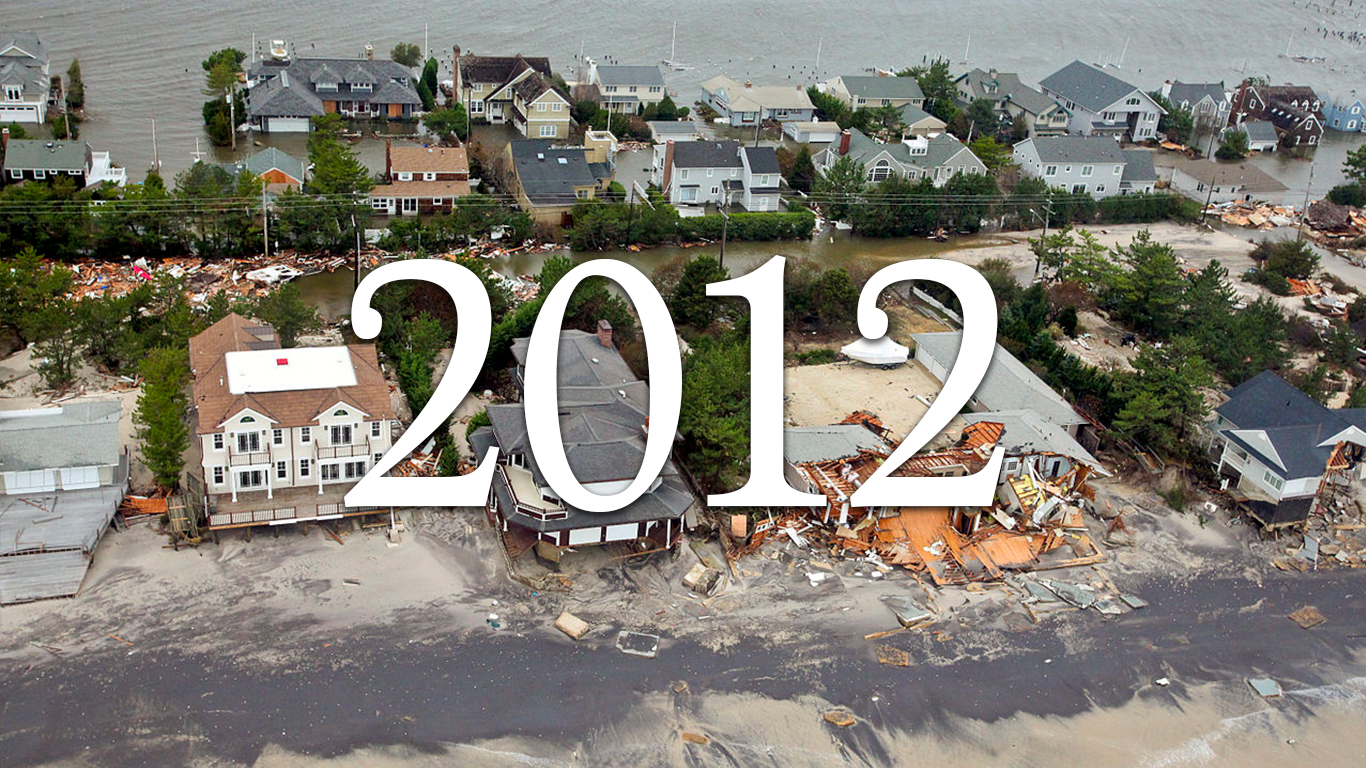
2012
> US population: 310,648,000
> Population below poverty line: 46,496,000
> Percent of all people in poverty: 15.0%
> Poverty threshold for unrelated individuals: $11,720
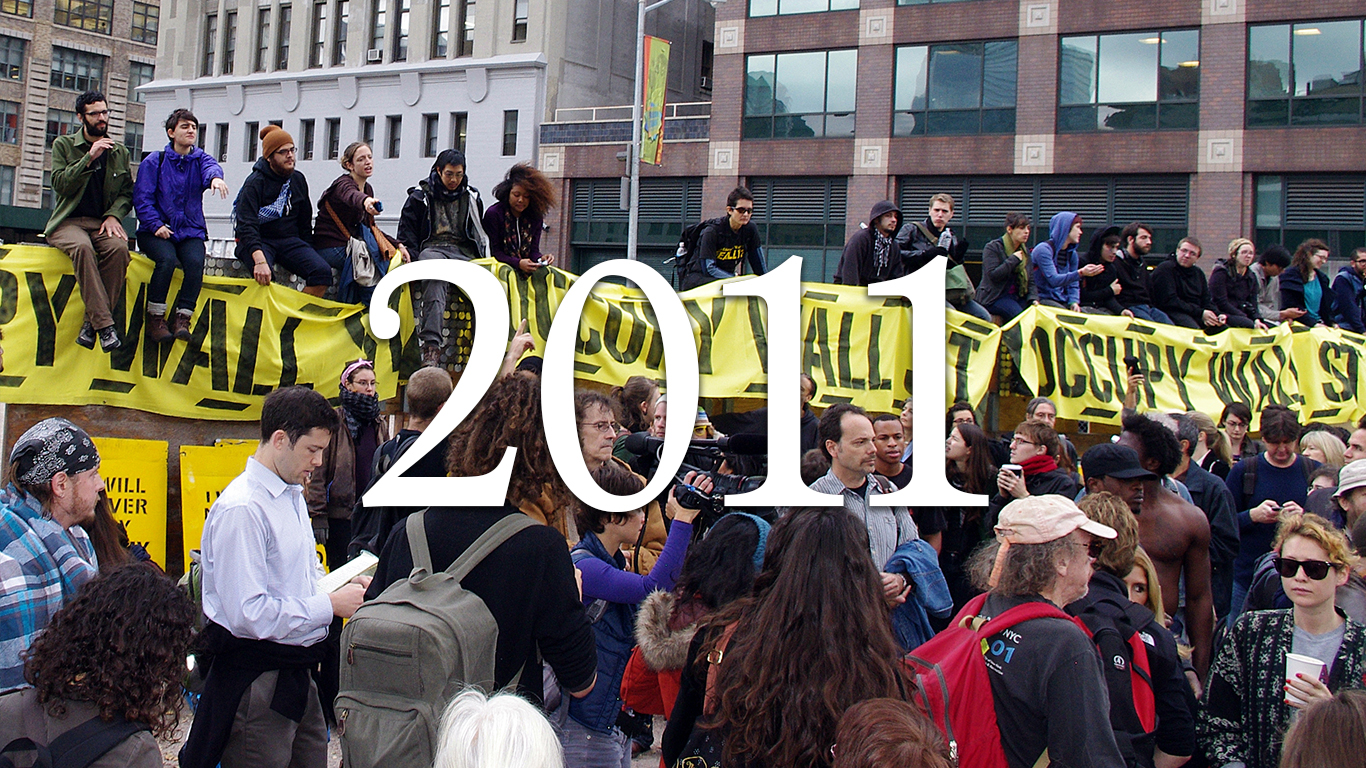
2011
> US population: 308,456,000
> Population below poverty line: 46,247,000
> Percent of all people in poverty: 15.0%
> Poverty threshold for unrelated individuals: $11,484

2010
> US population: 306,130,000
> Population below poverty line: 46,343,000
> Percent of all people in poverty: 15.1%
> Poverty threshold for unrelated individuals: $11,137
[in-text-ad]
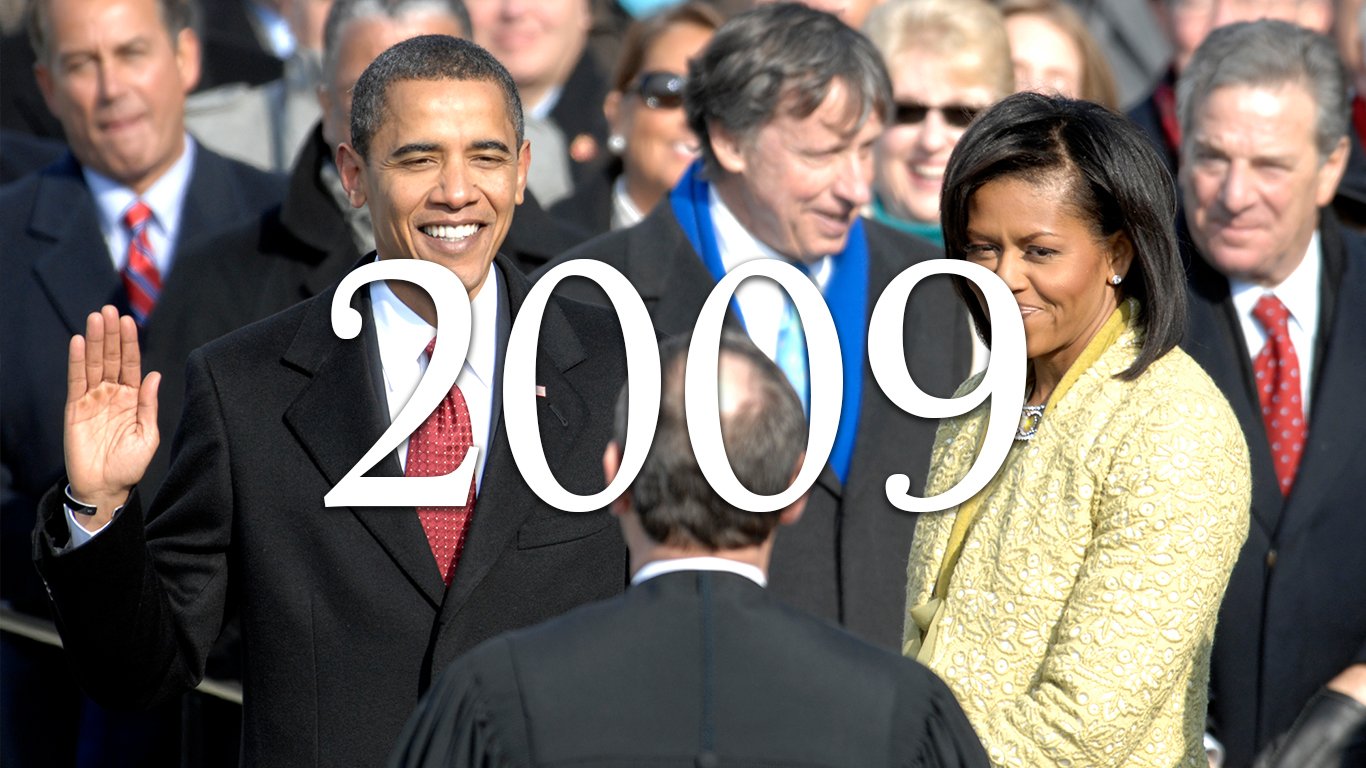
2009
> US population: 303,820,000
> Population below poverty line: 43,569,000
> Percent of all people in poverty: 14.3%
> Poverty threshold for unrelated individuals: $10,956
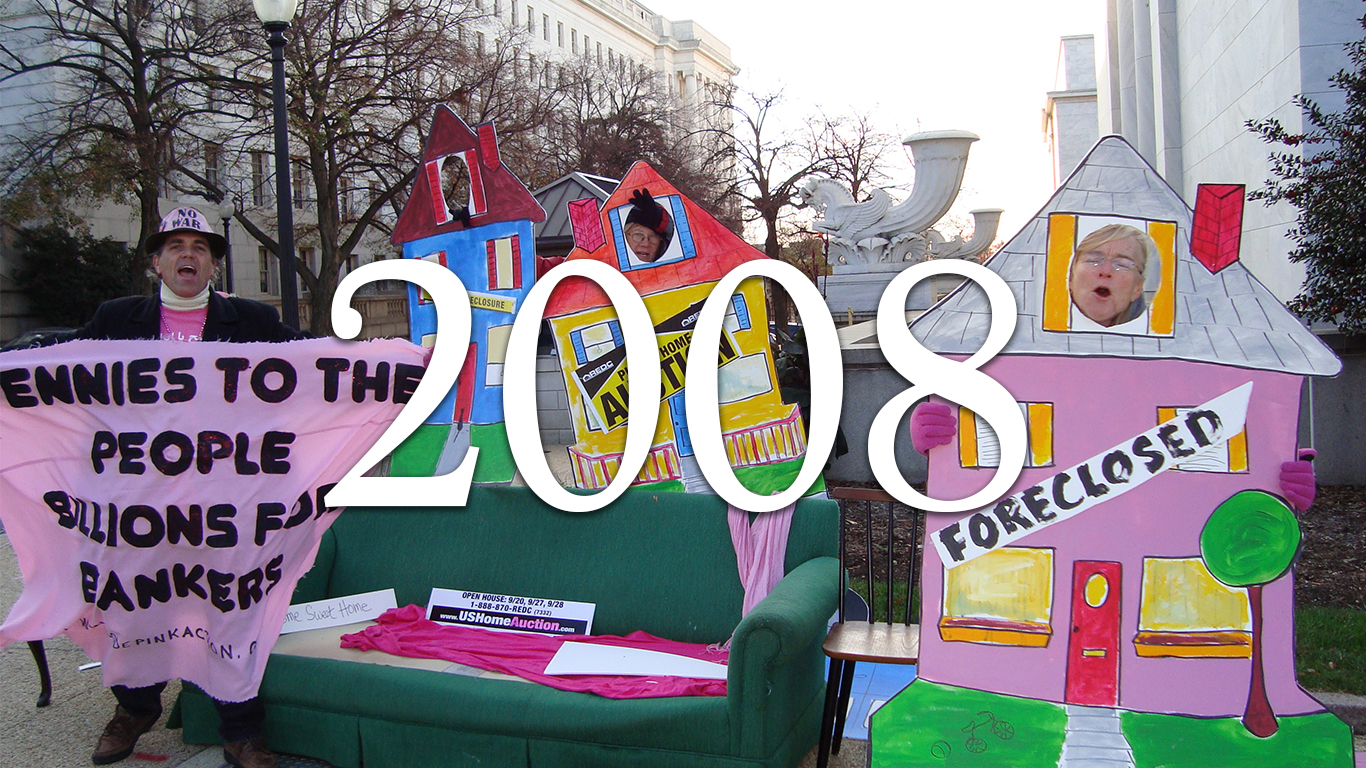
2008
> US population: 301,041,000
> Population below poverty line: 39,829,000
> Percent of all people in poverty: 13.2%
> Poverty threshold for unrelated individuals: $10,991

2007
> US population: 298,699,000
> Population below poverty line: 37,276,000
> Percent of all people in poverty: 12.5%
> Poverty threshold for unrelated individuals: $10,590
[recirclink id=956739]

2006
> US population: 296,450,000
> Population below poverty line: 36,460,000
> Percent of all people in poverty: 12.3%
> Poverty threshold for unrelated individuals: $10,294
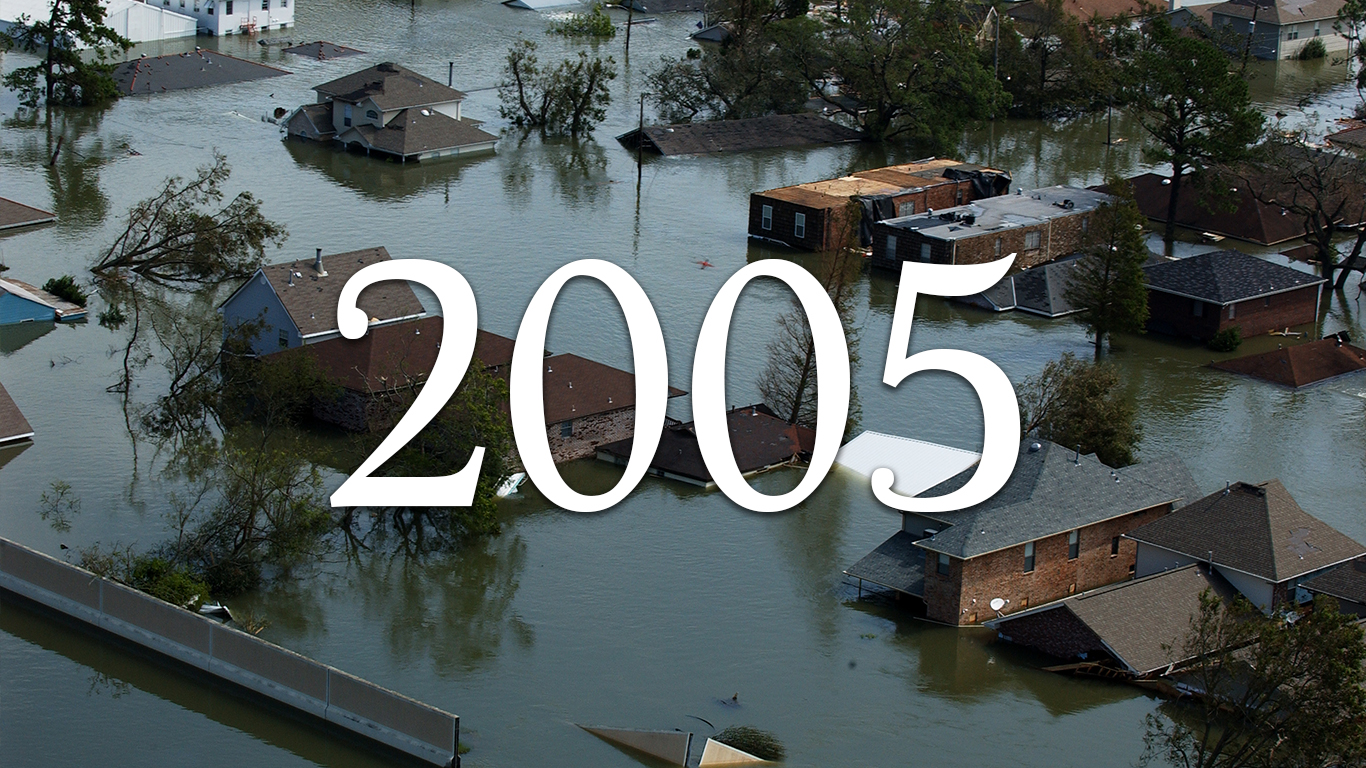
2005
> US population: 293,135,000
> Population below poverty line: 36,950,000
> Percent of all people in poverty: 12.6%
> Poverty threshold for unrelated individuals: $9,973
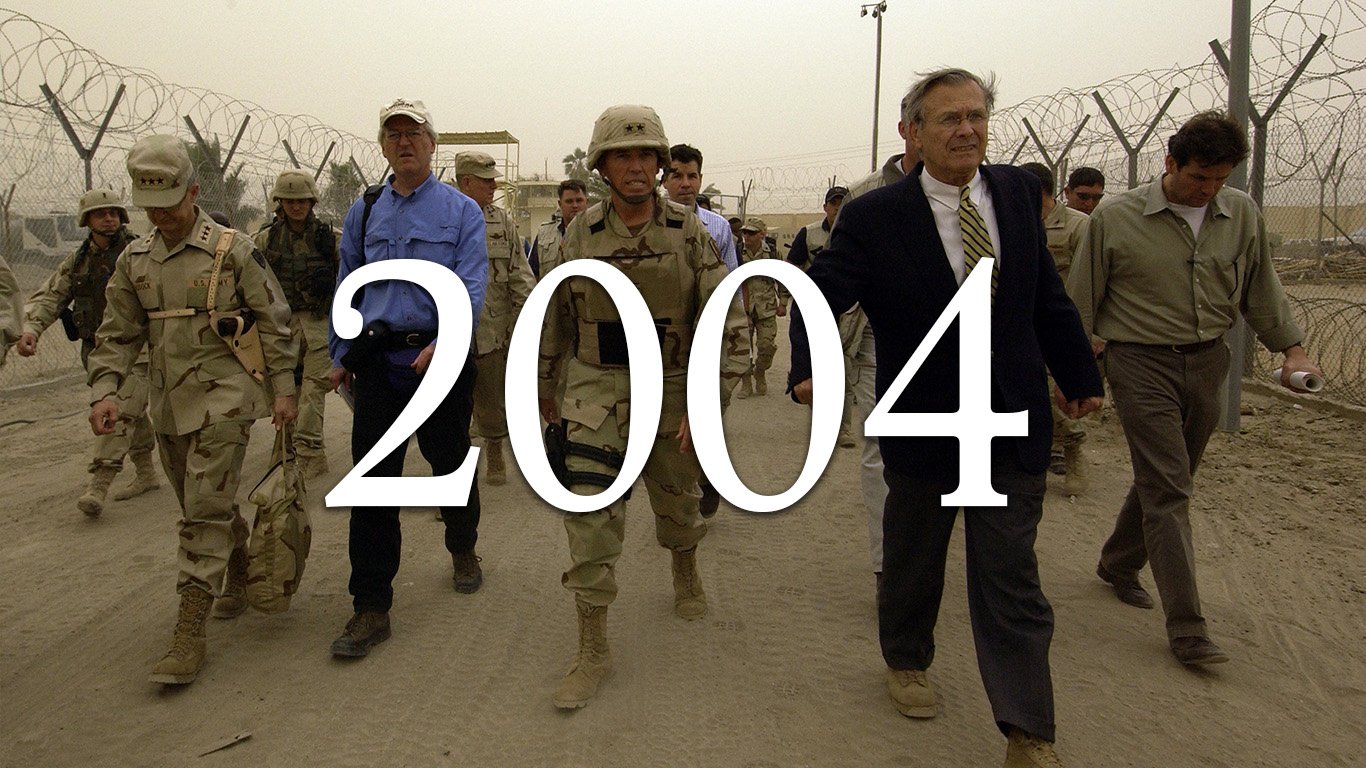
2004
> US population: 290,617,000
> Population below poverty line: 37,040,000
> Percent of all people in poverty: 12.7%
> Poverty threshold for unrelated individuals: $9,646
[in-text-ad-2]
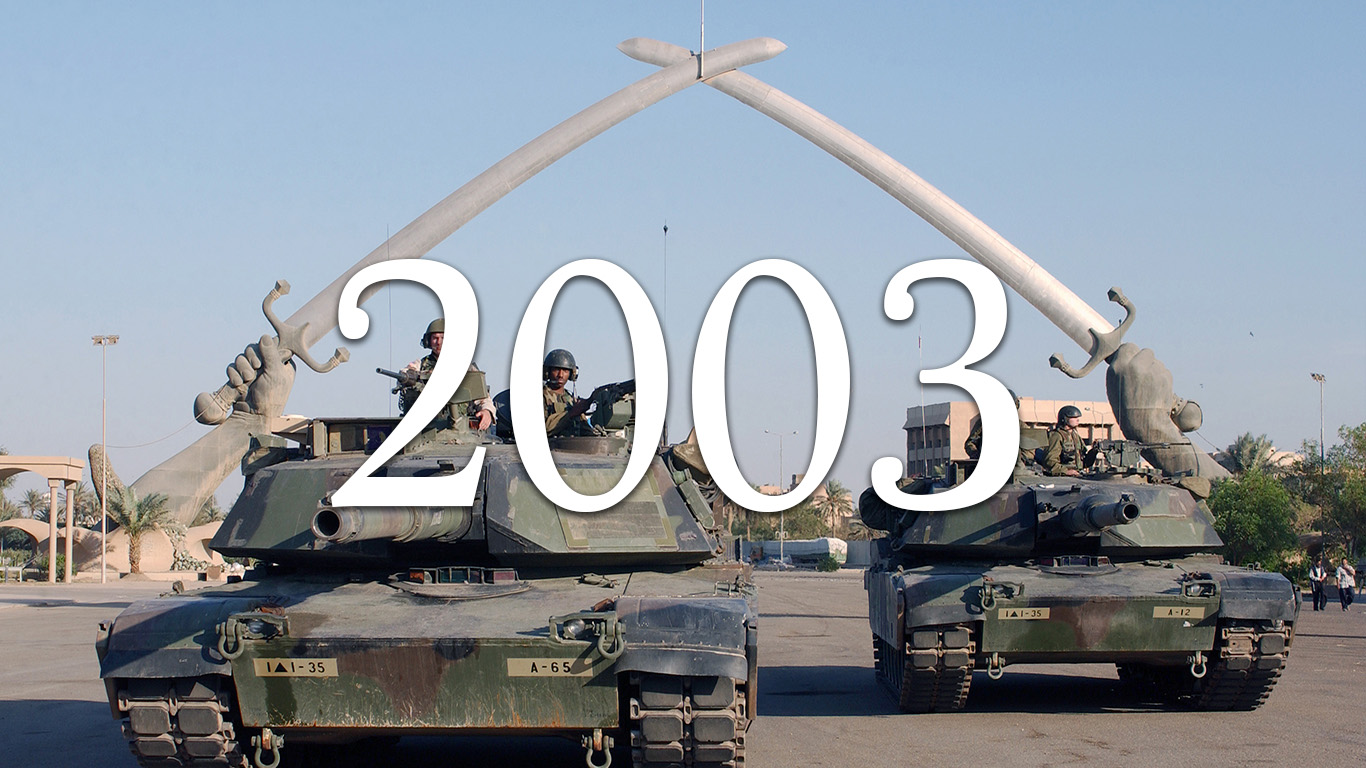
2003
> US population: 287,699,000
> Population below poverty line: 35,861,000
> Percent of all people in poverty: 12.5%
> Poverty threshold for unrelated individuals: $9,393
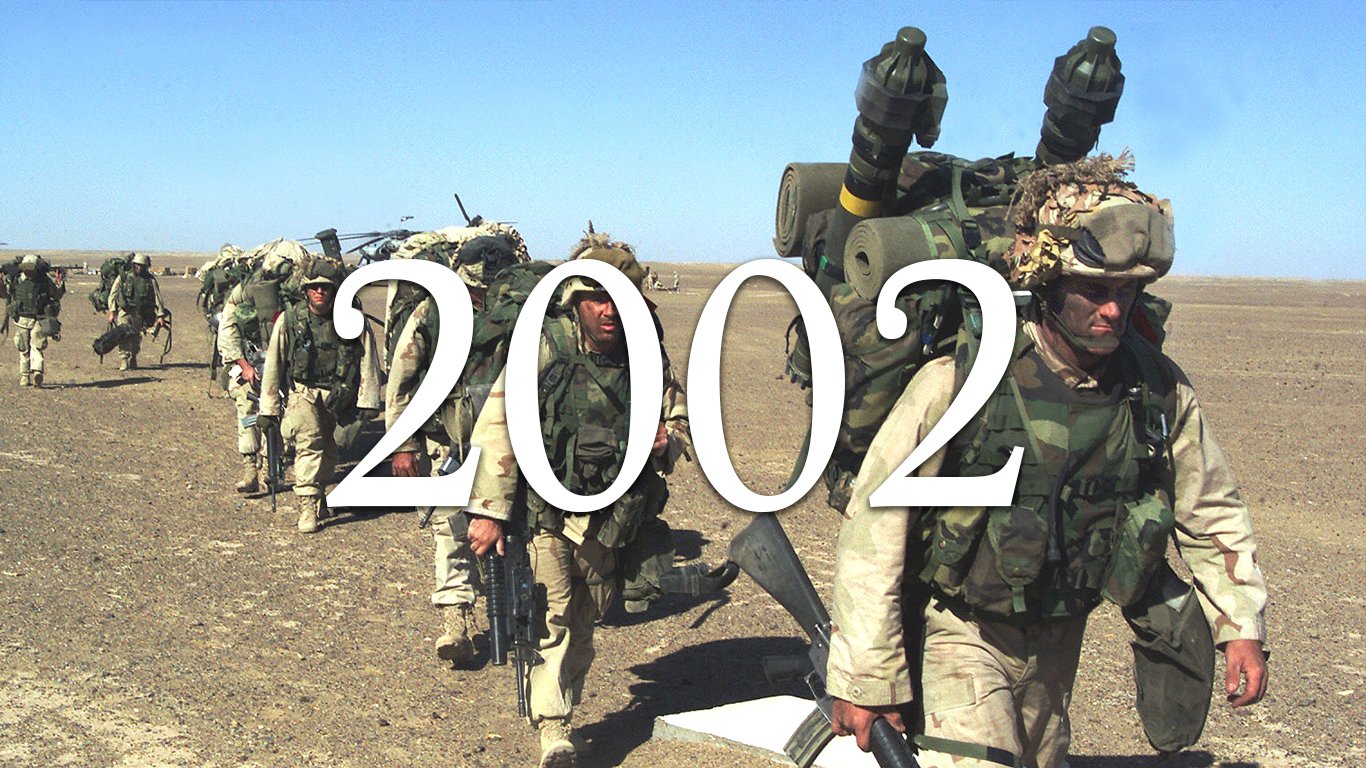
2002
> US population: 285,317,000
> Population below poverty line: 34,570,000
> Percent of all people in poverty: 12.1%
> Poverty threshold for unrelated individuals: $9,183

2001
> US population: 281,475,000
> Population below poverty line: 32,907,000
> Percent of all people in poverty: 11.7%
> Poverty threshold for unrelated individuals: $9,039

2000
> US population: 278,944,000
> Population below poverty line: 31,581,000
> Percent of all people in poverty: 11.3%
> Poverty threshold for unrelated individuals: $8,791
[in-text-ad]

1999
> US population: 276,208,000
> Population below poverty line: 32,791,000
> Percent of all people in poverty: 11.9%
> Poverty threshold for unrelated individuals: $8,499

1998
> US population: 271,059,000
> Population below poverty line: 34,476,000
> Percent of all people in poverty: 12.7%
> Poverty threshold for unrelated individuals: $8,316

1997
> US population: 268,480,000
> Population below poverty line: 35,574,000
> Percent of all people in poverty: 13.3%
> Poverty threshold for unrelated individuals: $8,183
[recirclink id=946979]

1996
> US population: 266,218,000
> Population below poverty line: 36,529,000
> Percent of all people in poverty: 13.7%
> Poverty threshold for unrelated individuals: $7,995

1995
> US population: 263,733,000
> Population below poverty line: 36,425,000
> Percent of all people in poverty: 13.8%
> Poverty threshold for unrelated individuals: $7,763

1994
> US population: 261,616,000
> Population below poverty line: 38,059,000
> Percent of all people in poverty: 14.5%
> Poverty threshold for unrelated individuals: $7,547
[in-text-ad-2]
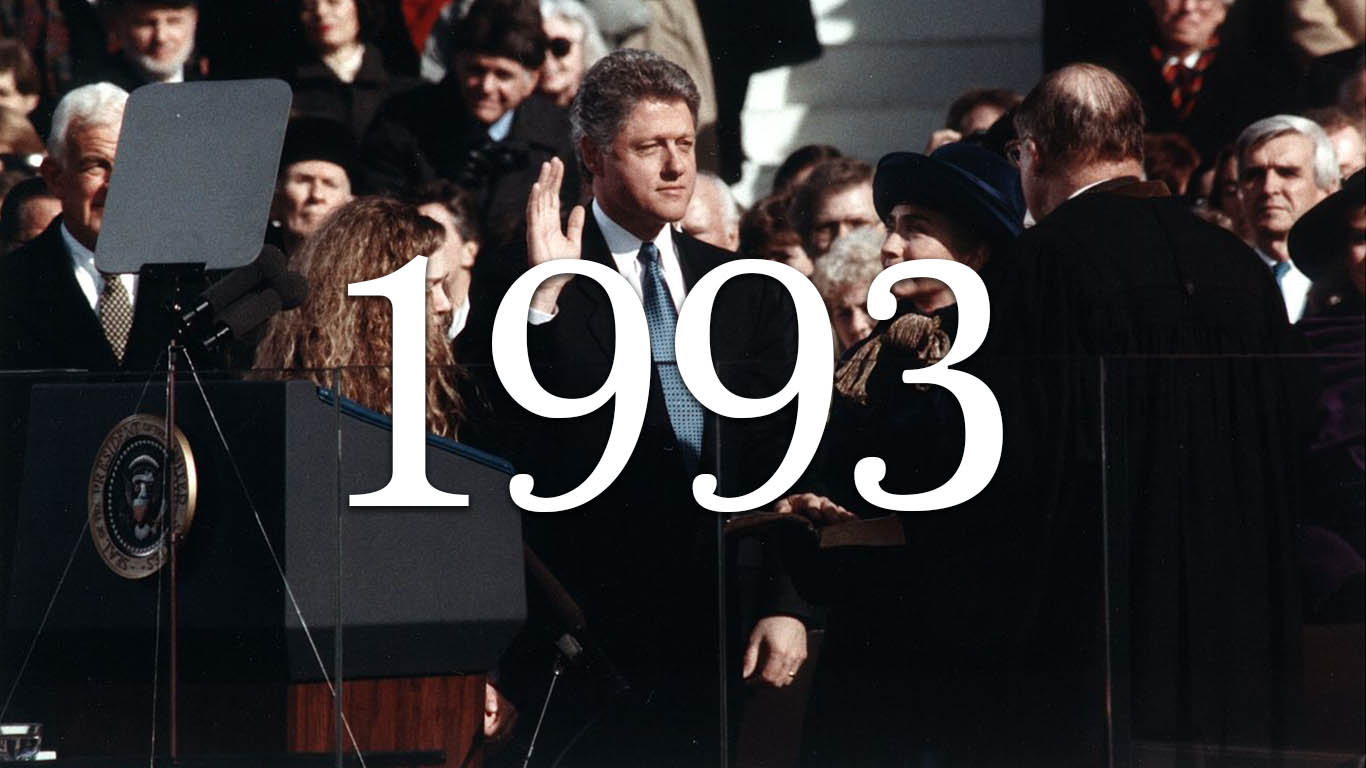
1993
> US population: 259,278,000
> Population below poverty line: 39,265,000
> Percent of all people in poverty: 15.1%
> Poverty threshold for unrelated individuals: $7,363
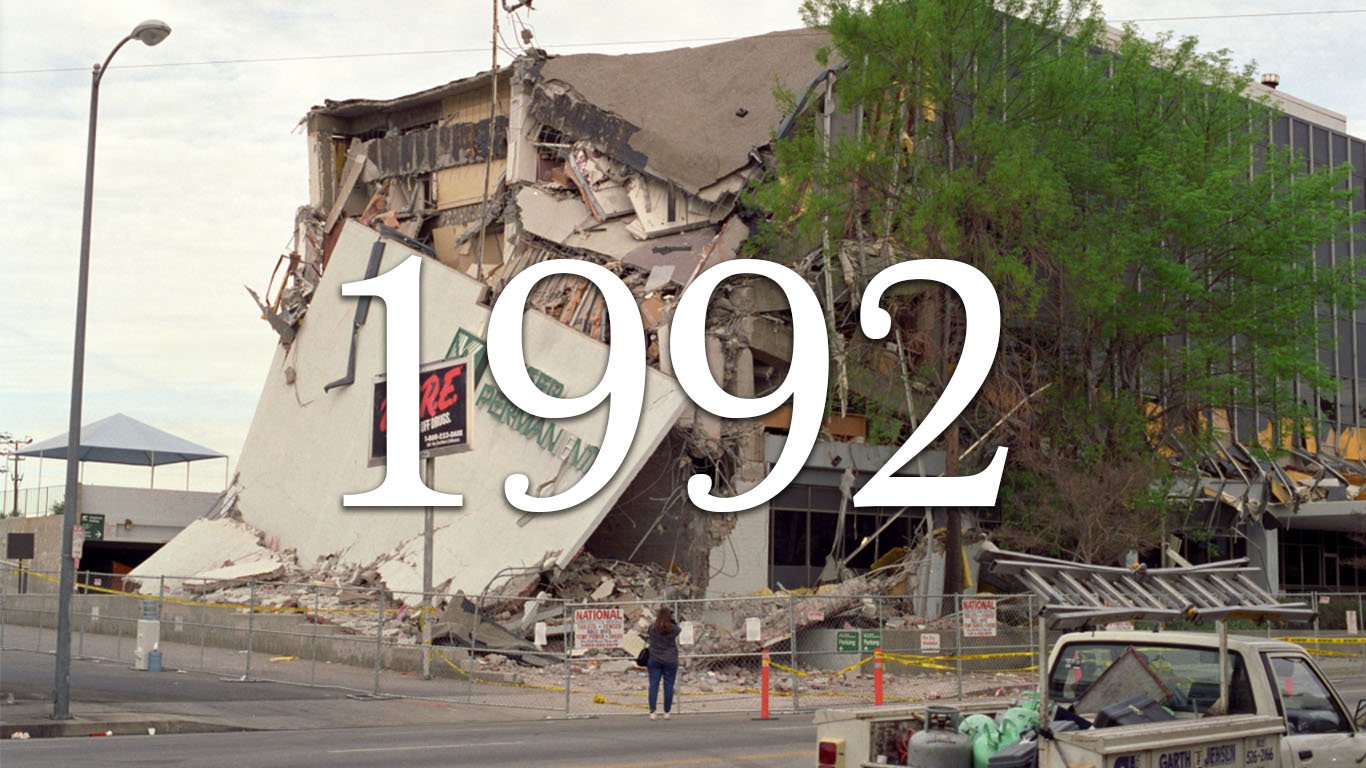
1992
> US population: 256,549,000
> Population below poverty line: 38,014,000
> Percent of all people in poverty: 14.8%
> Poverty threshold for unrelated individuals: $7,143

1991
> US population: 251,192,000
> Population below poverty line: 35,708,000
> Percent of all people in poverty: 14.2%
> Poverty threshold for unrelated individuals: $6,932

1990
> US population: 248,644,000
> Population below poverty line: 33,585,000
> Percent of all people in poverty: 13.5%
> Poverty threshold for unrelated individuals: $6,652
[in-text-ad]
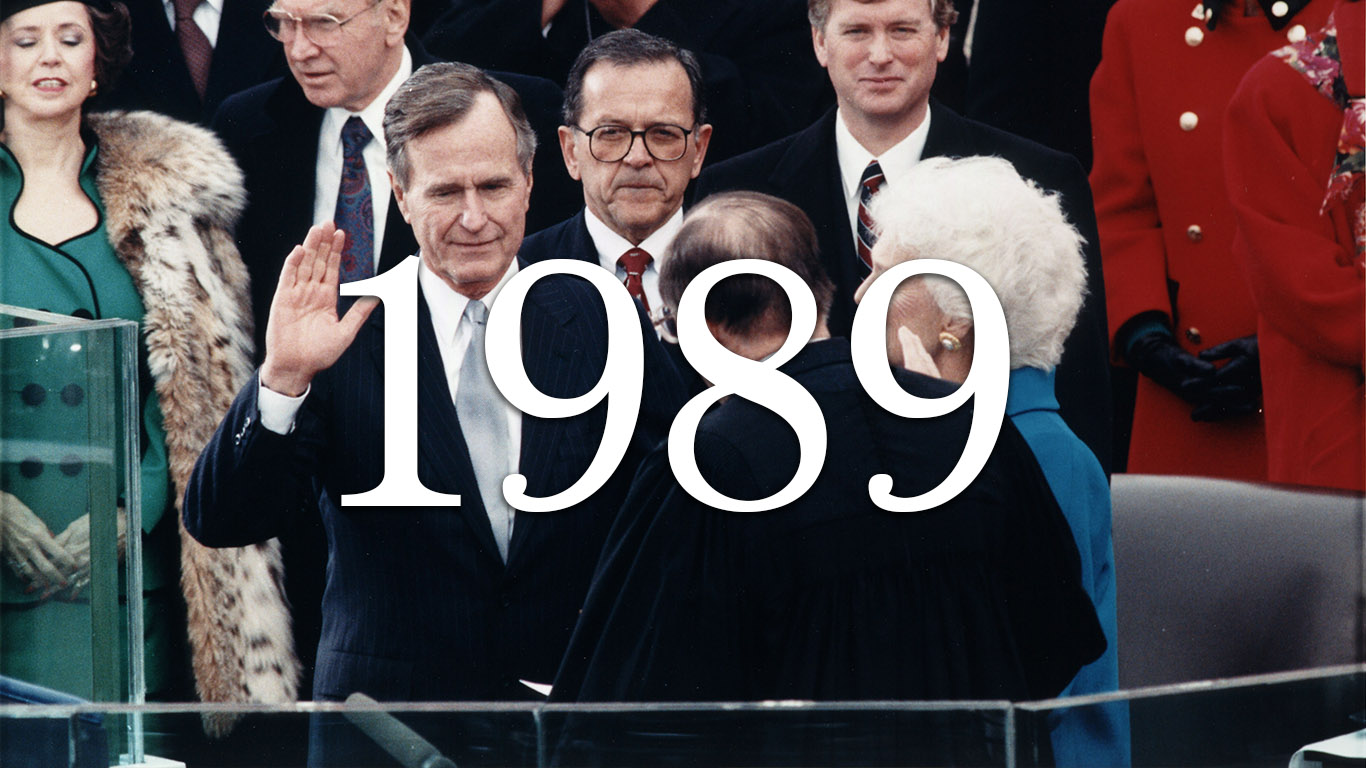
1989
> US population: 245,992,000
> Population below poverty line: 31,528,000
> Percent of all people in poverty: 12.8%
> Poverty threshold for unrelated individuals: $6,310
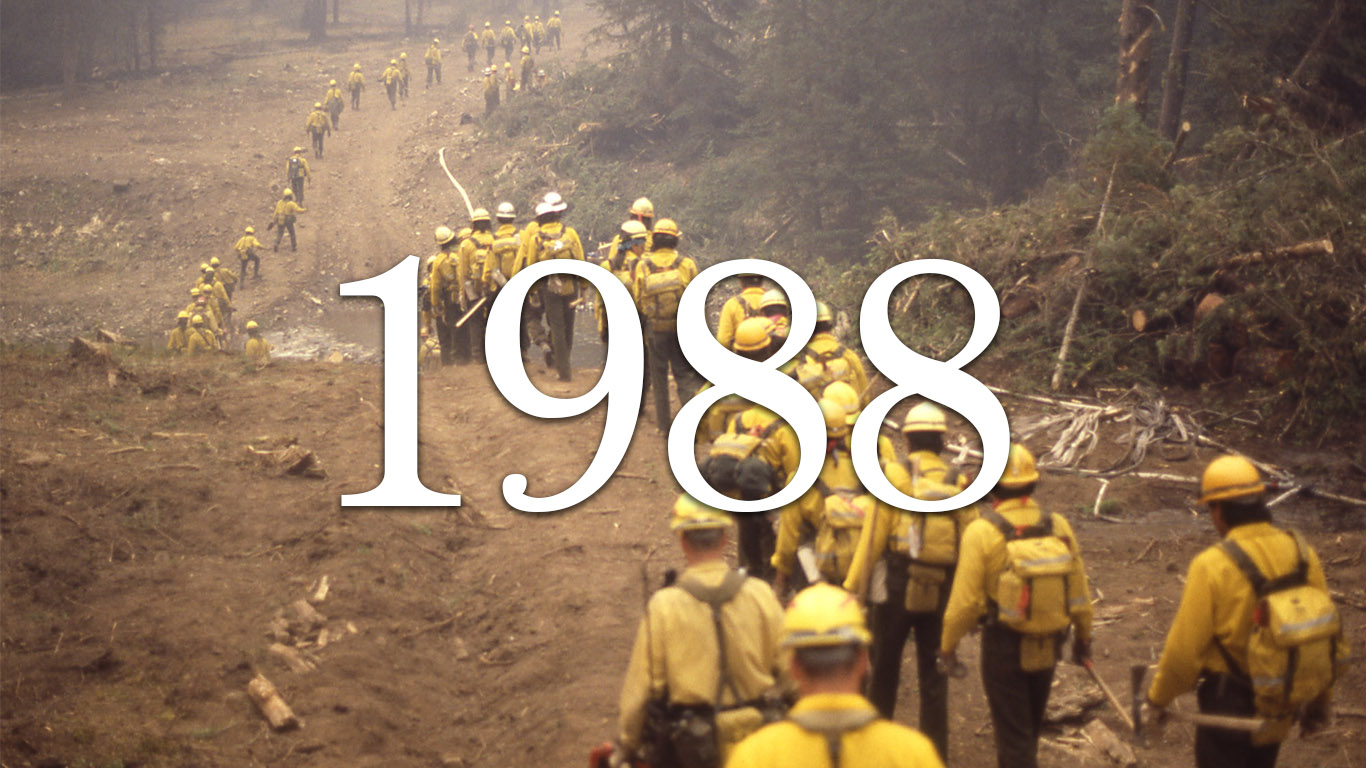
1988
> US population: 243,530,000
> Population below poverty line: 31,745,000
> Percent of all people in poverty: 13.0%
> Poverty threshold for unrelated individuals: $6,022

1987
> US population: 240,982,000
> Population below poverty line: 32,221,000
> Percent of all people in poverty: 13.4%
> Poverty threshold for unrelated individuals: $5,778
[recirclink id=949340]

1986
> US population: 238,554,000
> Population below poverty line: 32,370,000
> Percent of all people in poverty: 13.6%
> Poverty threshold for unrelated individuals: $5,572
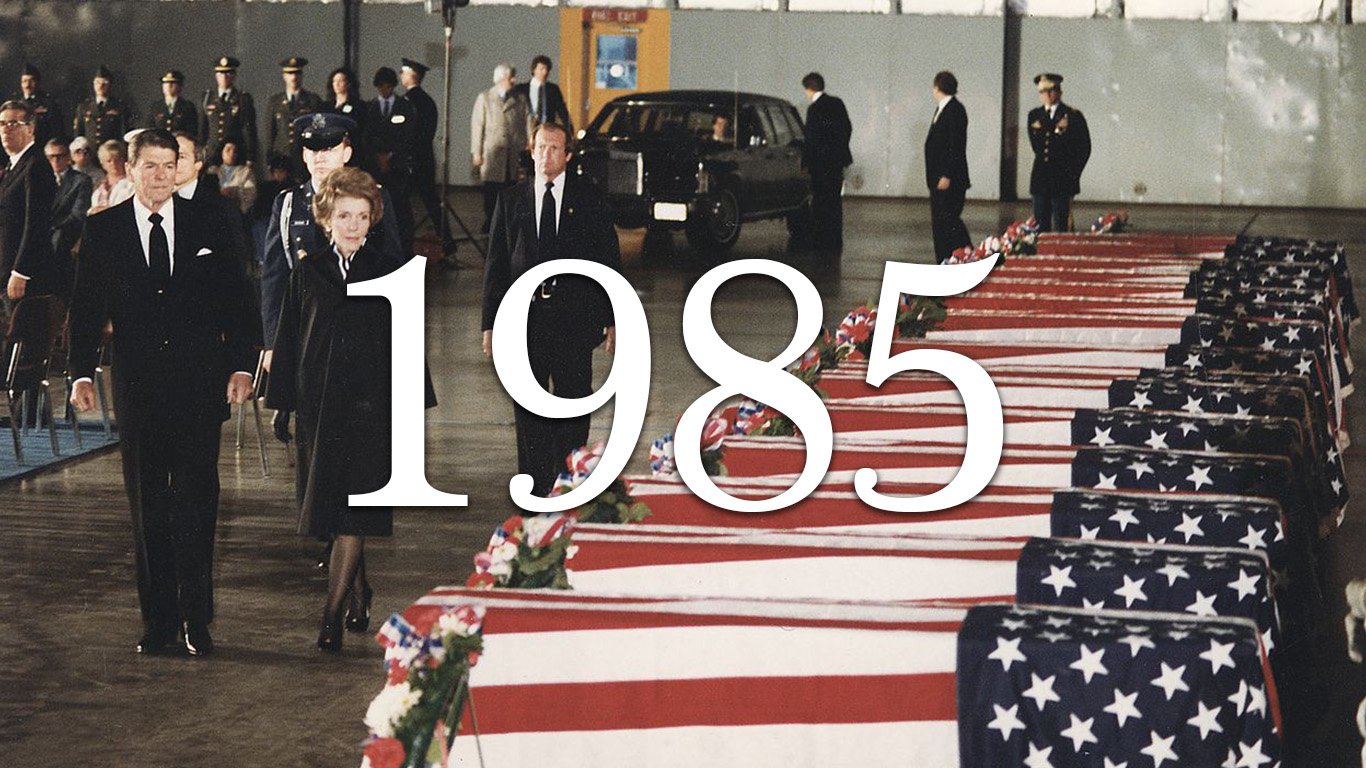
1985
> US population: 236,594,000
> Population below poverty line: 33,064,000
> Percent of all people in poverty: 14.0%
> Poverty threshold for unrelated individuals: $5,469

1984
> US population: 233,816,000
> Population below poverty line: 33,700,000
> Percent of all people in poverty: 14.4%
> Poverty threshold for unrelated individuals: $5,278
[in-text-ad-2]

1983
> US population: 231,700,000
> Population below poverty line: 35,303,000
> Percent of all people in poverty: 15.2%
> Poverty threshold for unrelated individuals: $5,061

1982
> US population: 229,412,000
> Population below poverty line: 34,398,000
> Percent of all people in poverty: 15.0%
> Poverty threshold for unrelated individuals: $4,901

1981
> US population: 227,157,000
> Population below poverty line: 31,822,000
> Percent of all people in poverty: 14.0%
> Poverty threshold for unrelated individuals: $4,620

1980
> US population: 225,027,000
> Population below poverty line: 29,272,000
> Percent of all people in poverty: 13.0%
> Poverty threshold for unrelated individuals: $4,190
[in-text-ad]
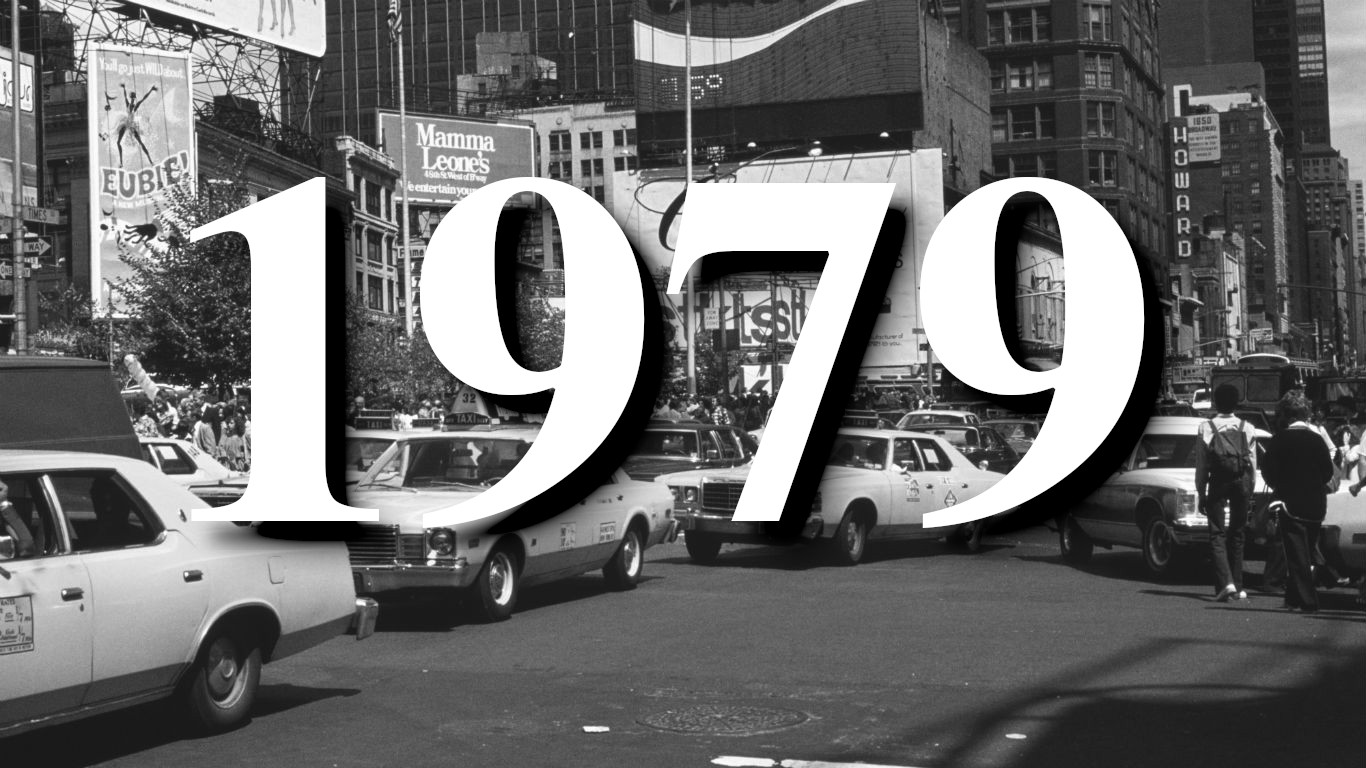
1979
> US population: 222,903,000
> Population below poverty line: 26,072,000
> Percent of all people in poverty: 11.7%
> Poverty threshold for unrelated individuals: $3,689
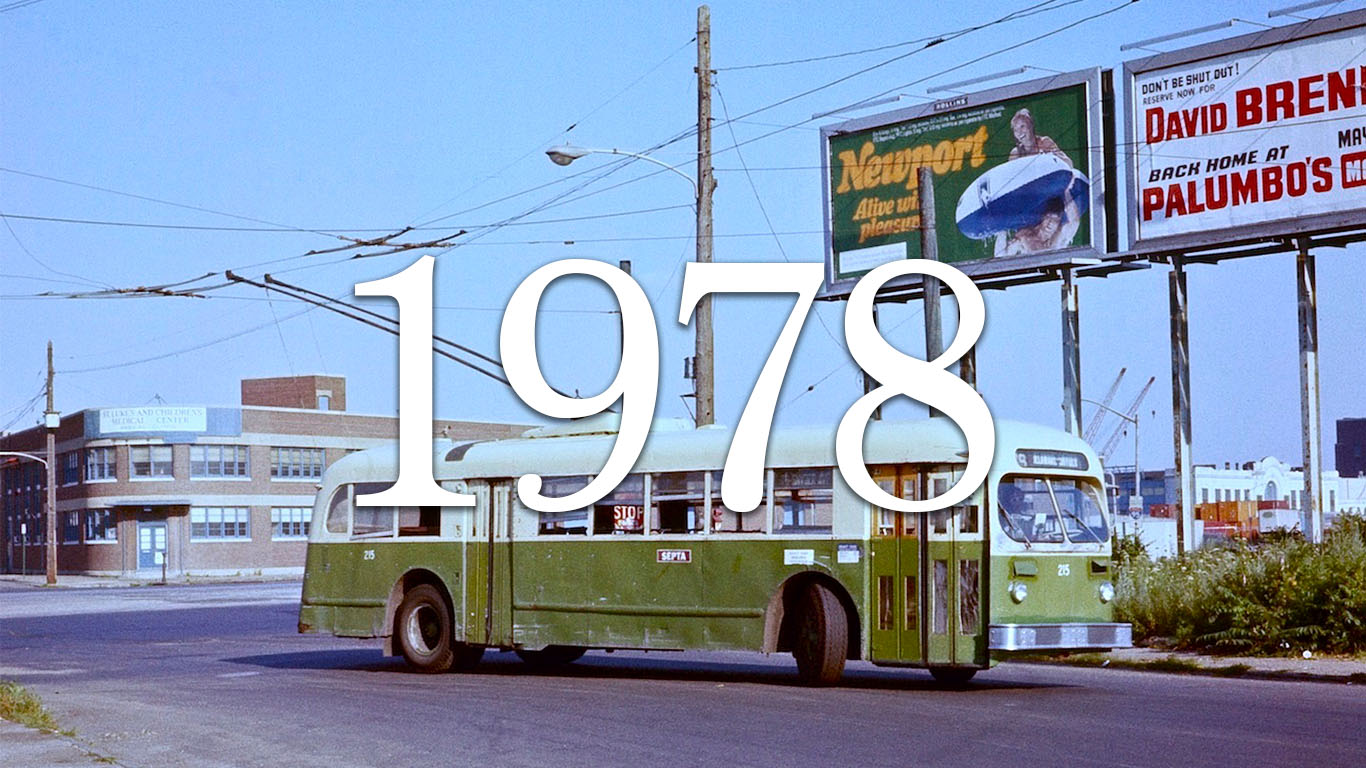
1978
> US population: 215,656,000
> Population below poverty line: 24,497,000
> Percent of all people in poverty: 11.4%
> Poverty threshold for unrelated individuals: $3,311
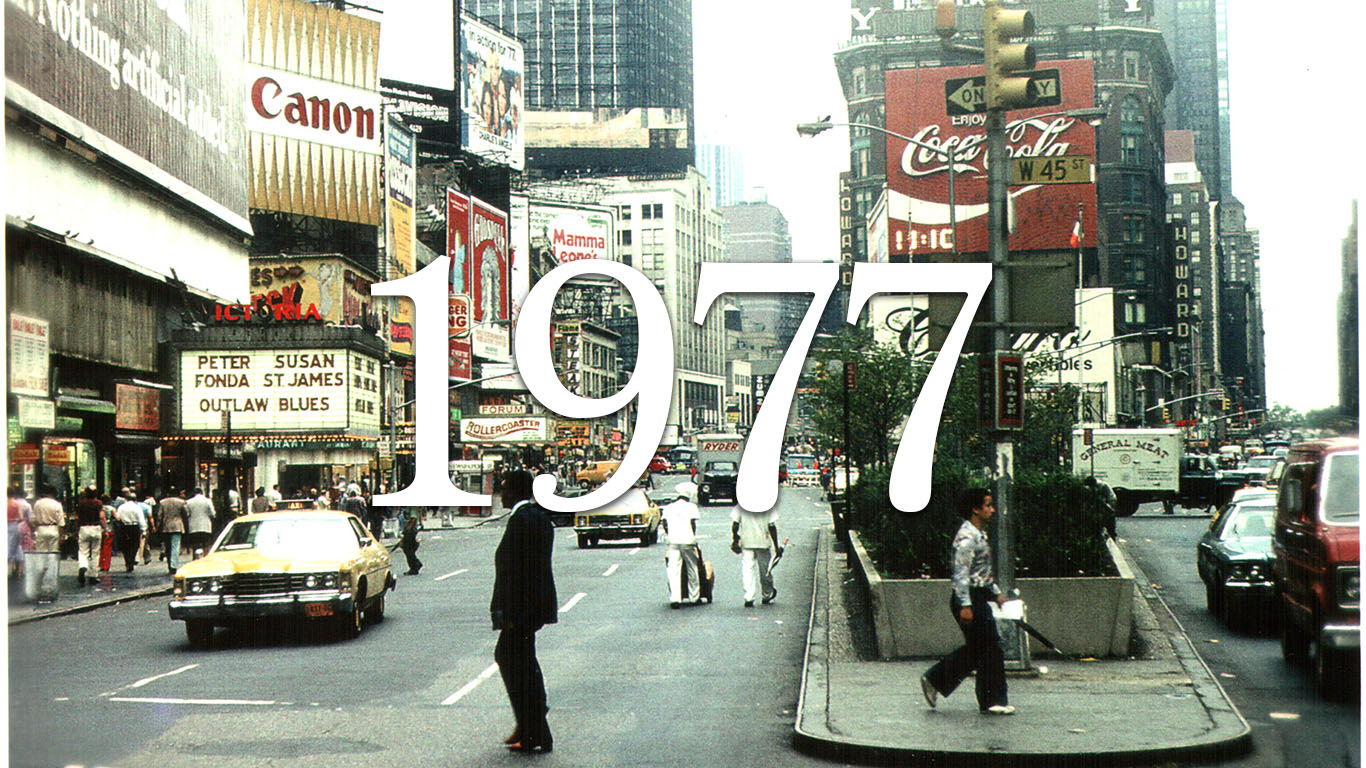
1977
> US population: 213,867,000
> Population below poverty line: 24,720,000
> Percent of all people in poverty: 11.6%
> Poverty threshold for unrelated individuals: $3,075
[recirclink id=738598]
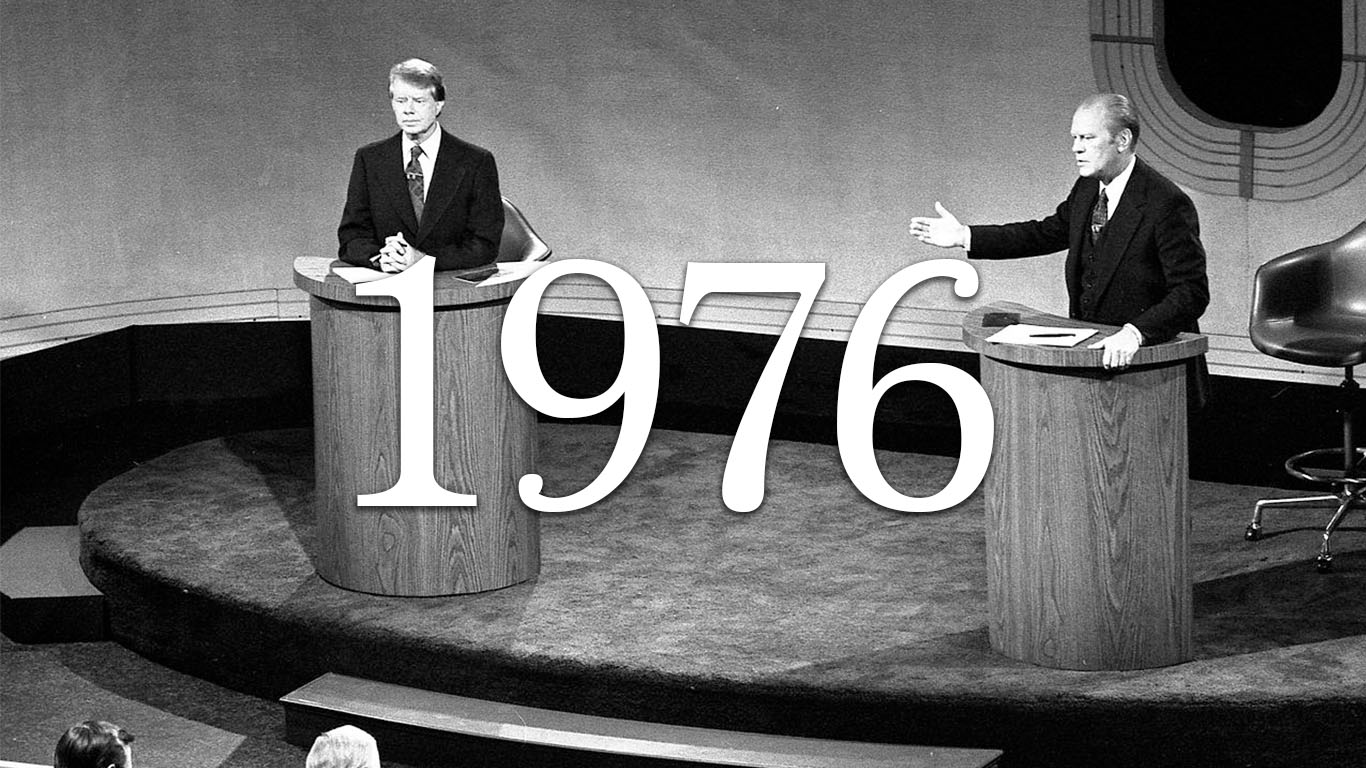
1976
> US population: 212,303,000
> Population below poverty line: 24,975,000
> Percent of all people in poverty: 11.8%
> Poverty threshold for unrelated individuals: $2,884
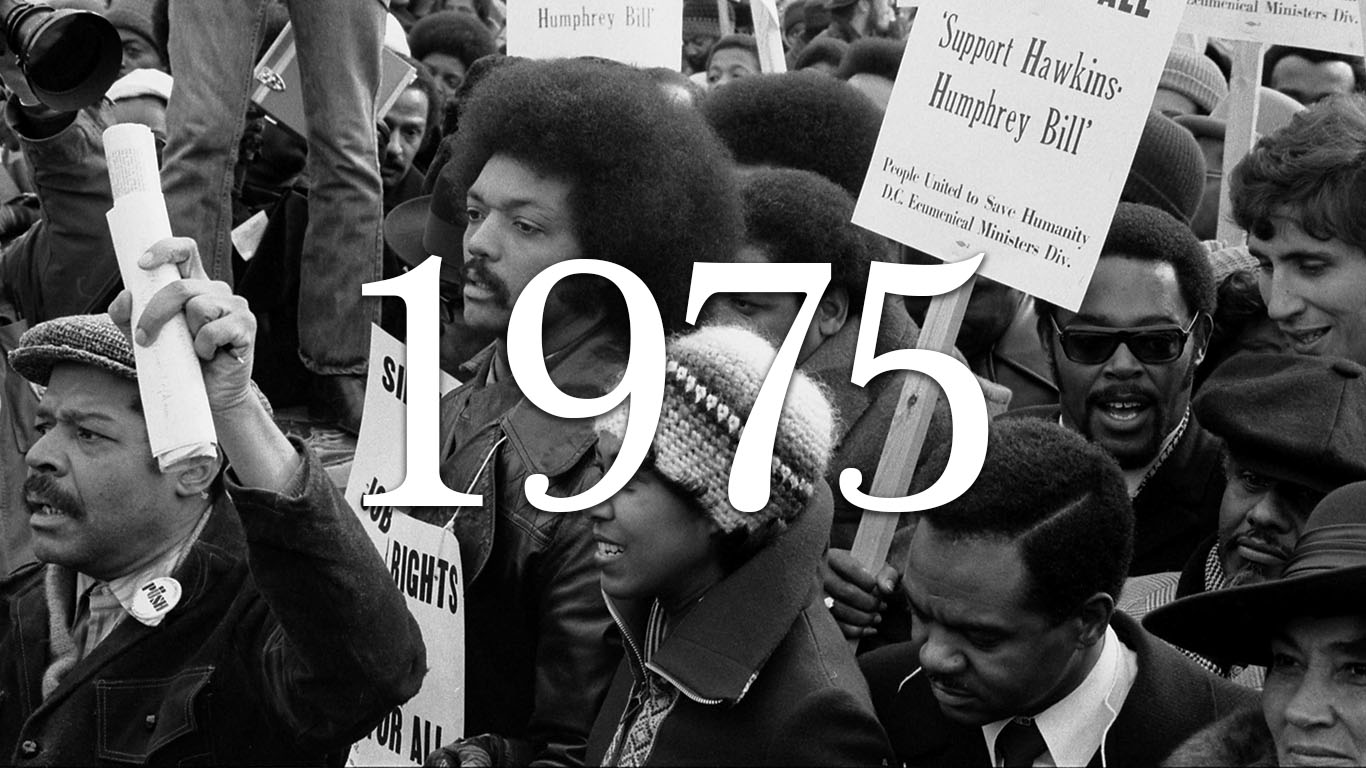
1975
> US population: 210,864,000
> Population below poverty line: 25,877,000
> Percent of all people in poverty: 12.3%
> Poverty threshold for unrelated individuals: $2,724

1974
> US population: 209,362,000
> Population below poverty line: 23,370,000
> Percent of all people in poverty: 11.2%
> Poverty threshold for unrelated individuals: $2,495
[in-text-ad-2]

1973
> US population: 207,621,000
> Population below poverty line: 22,973,000
> Percent of all people in poverty: 11.1%
> Poverty threshold for unrelated individuals: $2,247
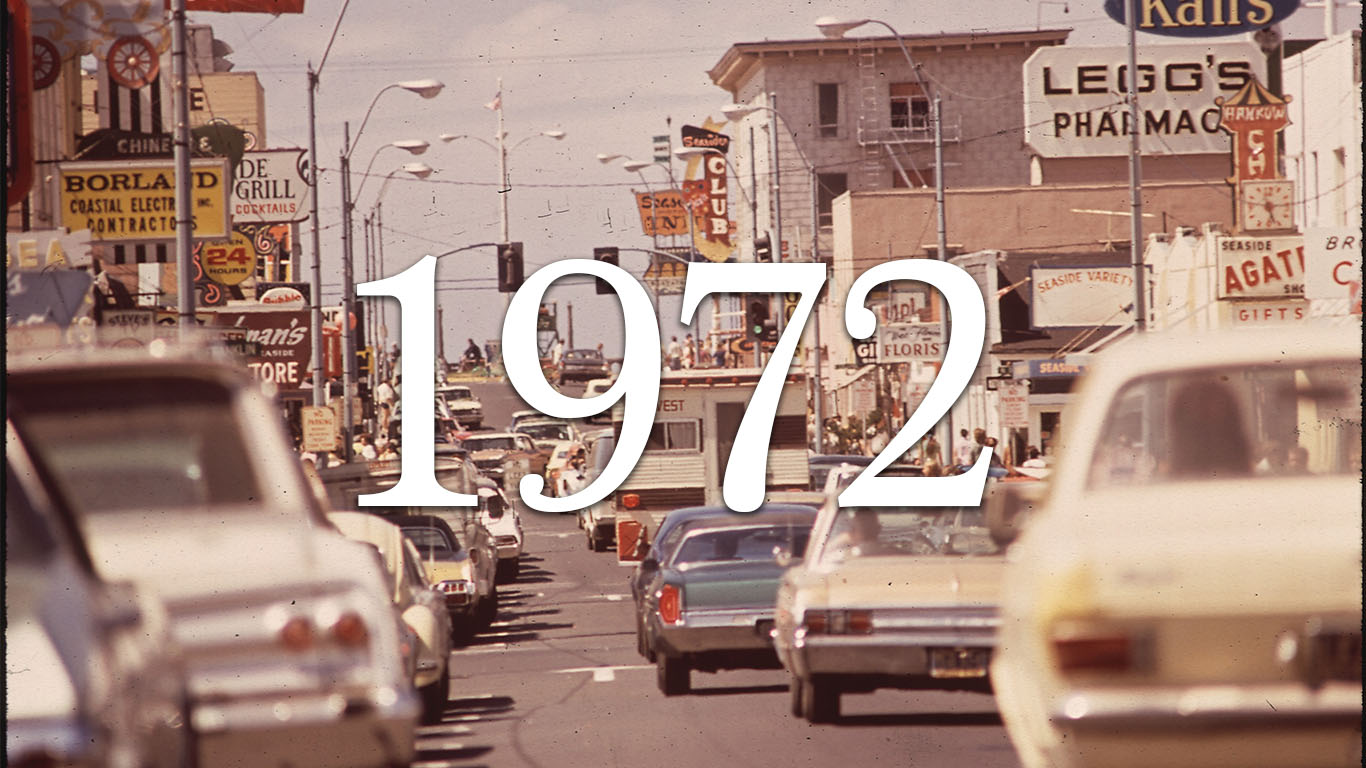
1972
> US population: 206,004,000
> Population below poverty line: 24,460,000
> Percent of all people in poverty: 11.9%
> Poverty threshold for unrelated individuals: $2,109
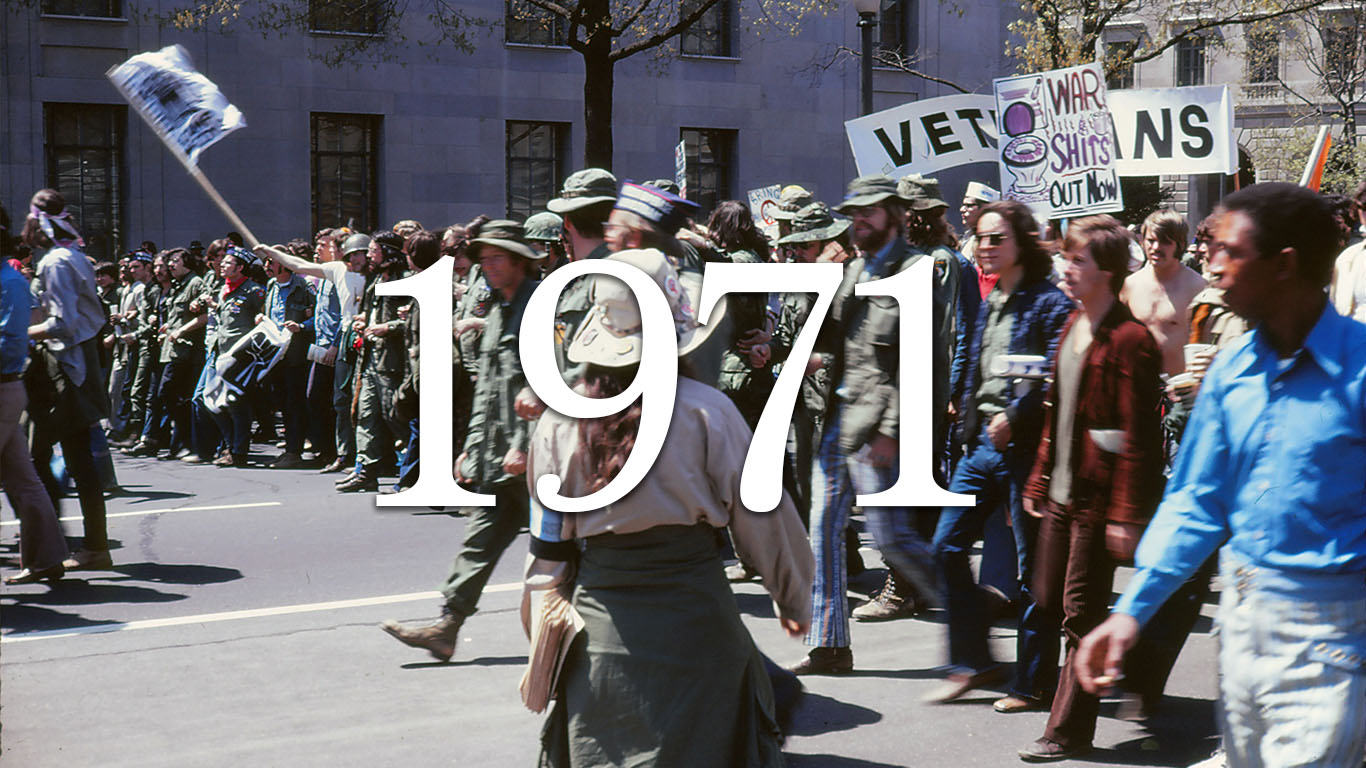
1971
> US population: 204,554,000
> Population below poverty line: 25,559,000
> Percent of all people in poverty: 12.5%
> Poverty threshold for unrelated individuals: $2,040

1970
> US population: 202,183,000
> Population below poverty line: 25,420,000
> Percent of all people in poverty: 12.6%
> Poverty threshold for unrelated individuals: $1,954
[in-text-ad]

1969
> US population: 199,517,000
> Population below poverty line: 24,147,000
> Percent of all people in poverty: 12.1%
> Poverty threshold for unrelated individuals: $1,840
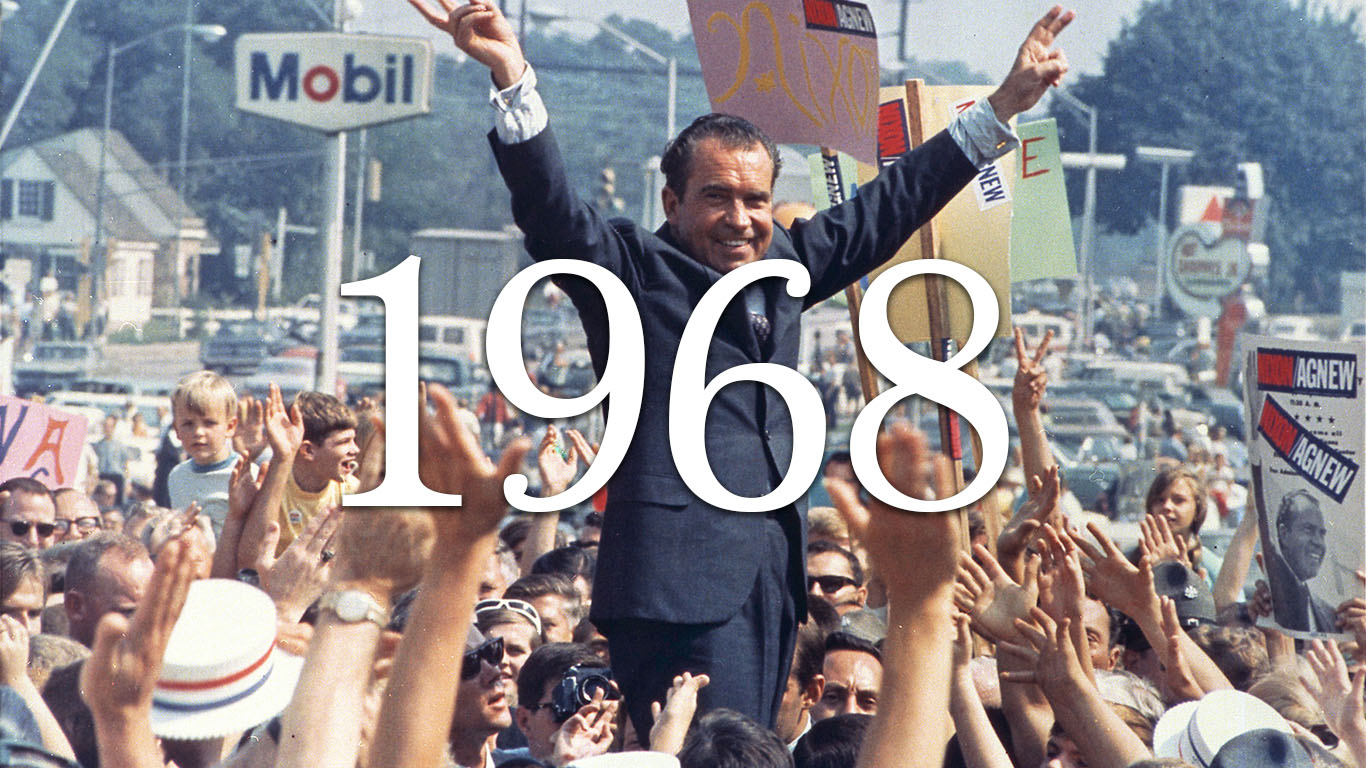
1968
> US population: 197,628,000
> Population below poverty line: 25,389,000
> Percent of all people in poverty: 12.8%
> Poverty threshold for unrelated individuals: $1,748

1967
> US population: 195,672,000
> Population below poverty line: 27,769,000
> Percent of all people in poverty: 14.2%
> Poverty threshold for unrelated individuals: $1,675
[recirclink id=936172]

1966
> US population: 193,388,000
> Population below poverty line: 28,510,000
> Percent of all people in poverty: 14.7%
> Poverty threshold for unrelated individuals: $1,628
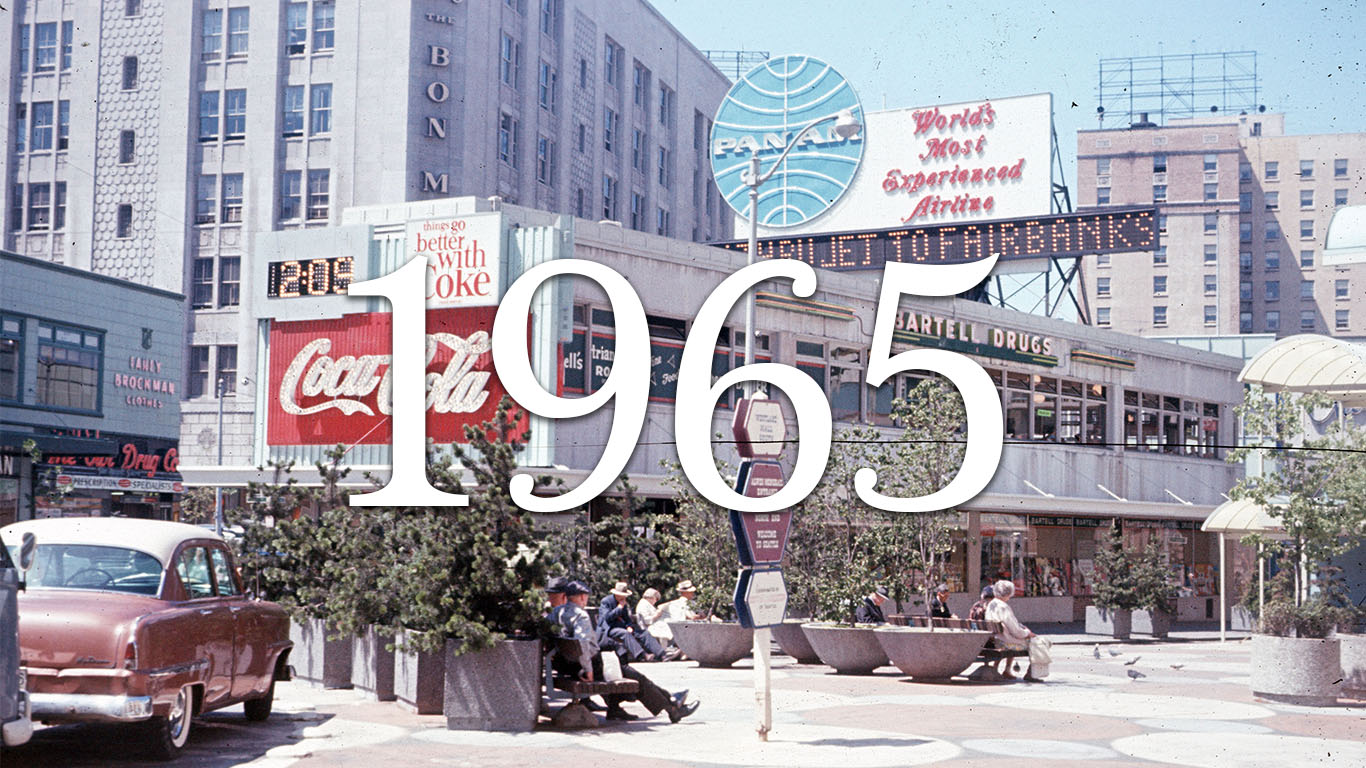
1965
> US population: 191,413,000
> Population below poverty line: 33,185,000
> Percent of all people in poverty: 17.3%
> Poverty threshold for unrelated individuals: $1,582
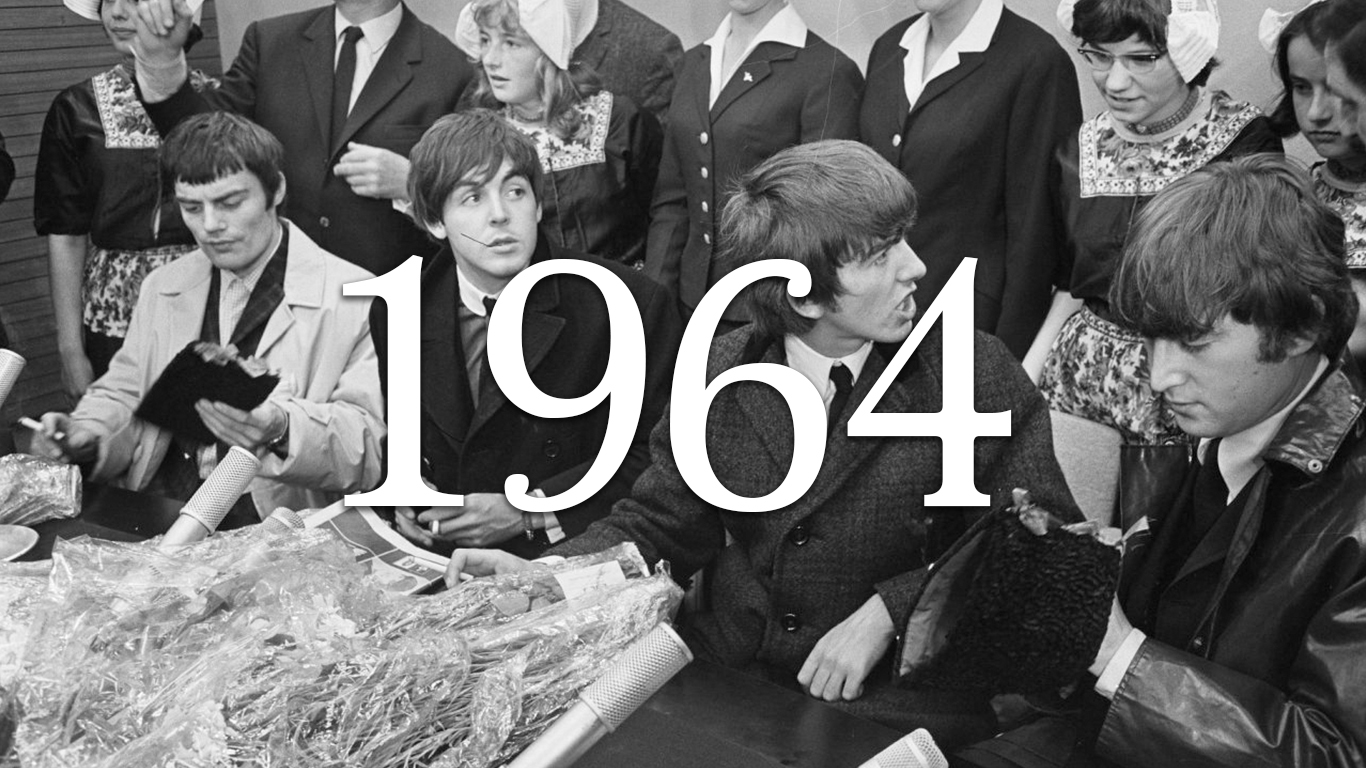
1964
> US population: 189,710,000
> Population below poverty line: 36,055,000
> Percent of all people in poverty: 19.0%
> Poverty threshold for unrelated individuals: $1,558
[in-text-ad-2]
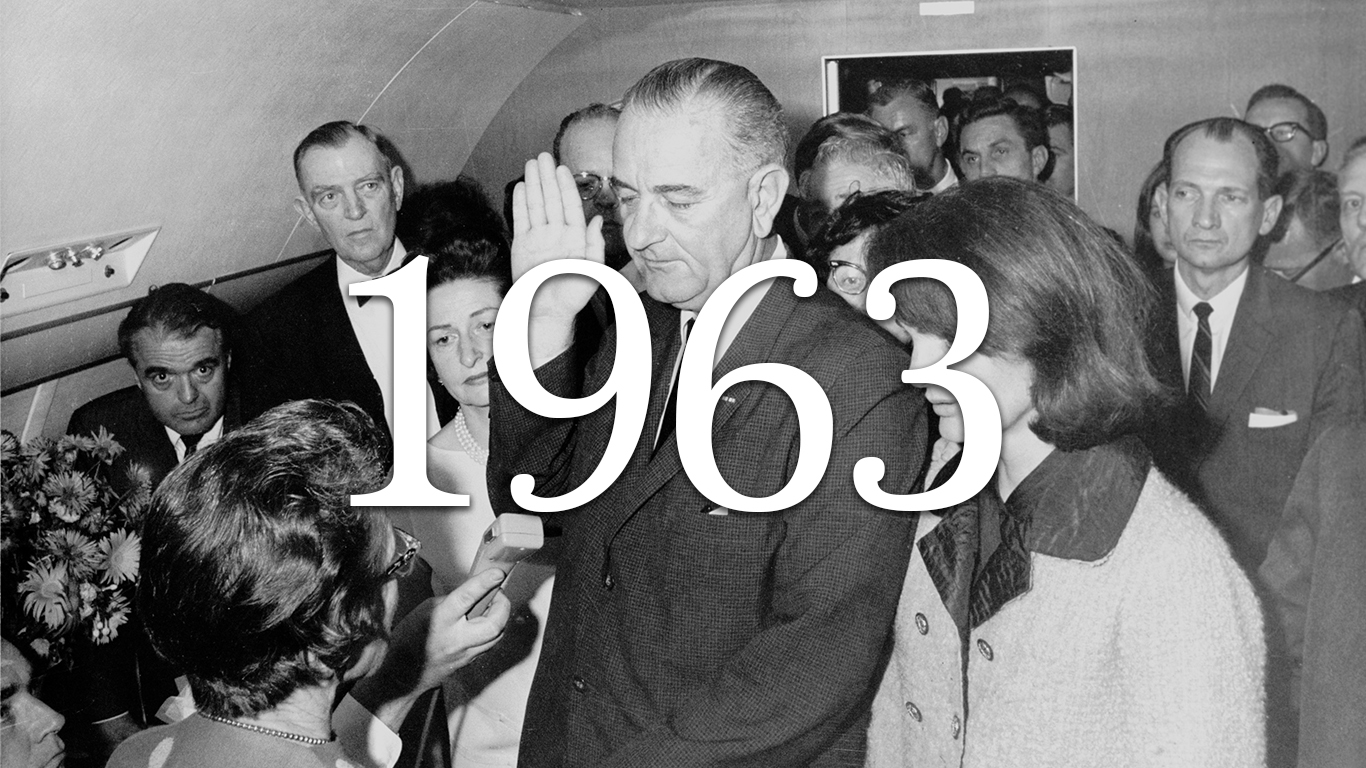
1963
> US population: 187,258,000
> Population below poverty line: 36,436,000
> Percent of all people in poverty: 19.5%
> Poverty threshold for unrelated individuals: $1,539

1962
> US population: 184,276,000
> Population below poverty line: 38,625,000
> Percent of all people in poverty: 21.0%
> Poverty threshold for unrelated individuals: $1,519
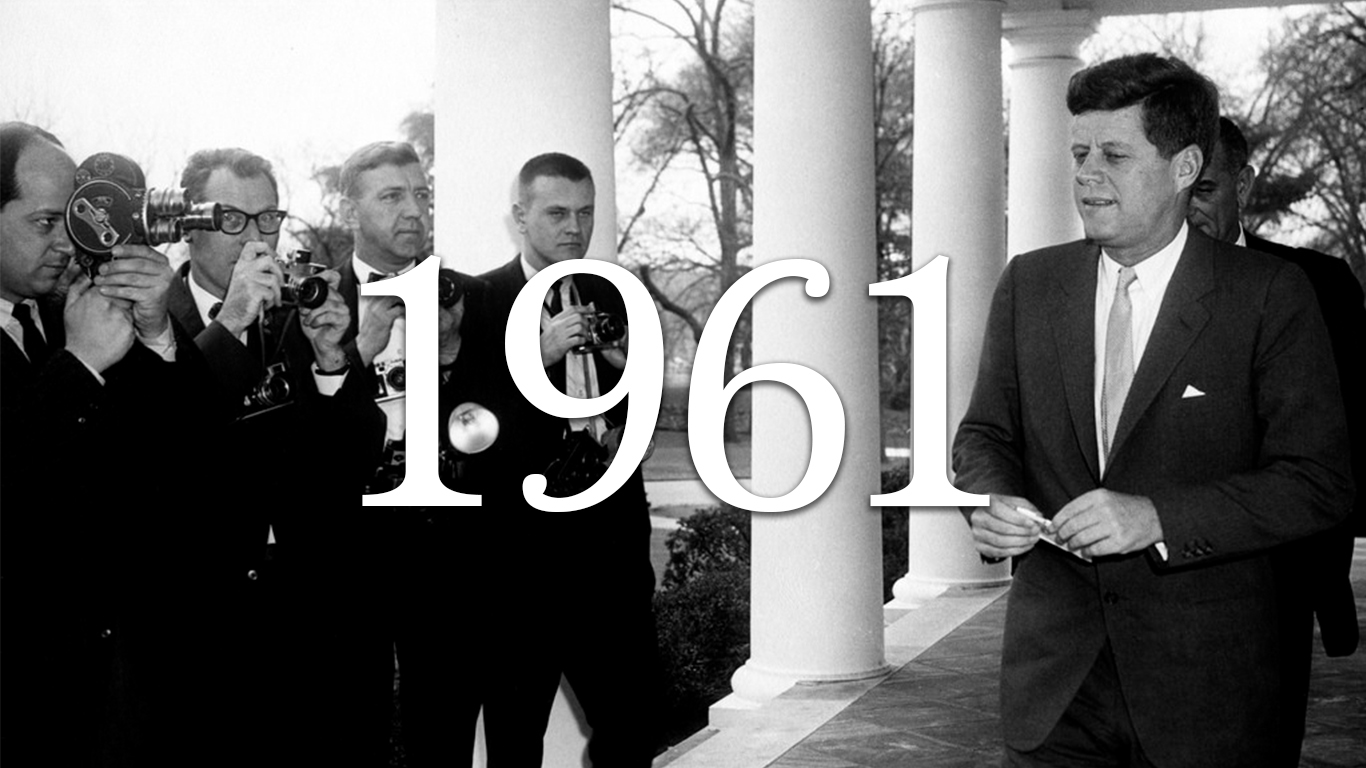
1961
> US population: 181,277,000
> Population below poverty line: 39,628,000
> Percent of all people in poverty: 21.9%
> Poverty threshold for unrelated individuals: $1,506
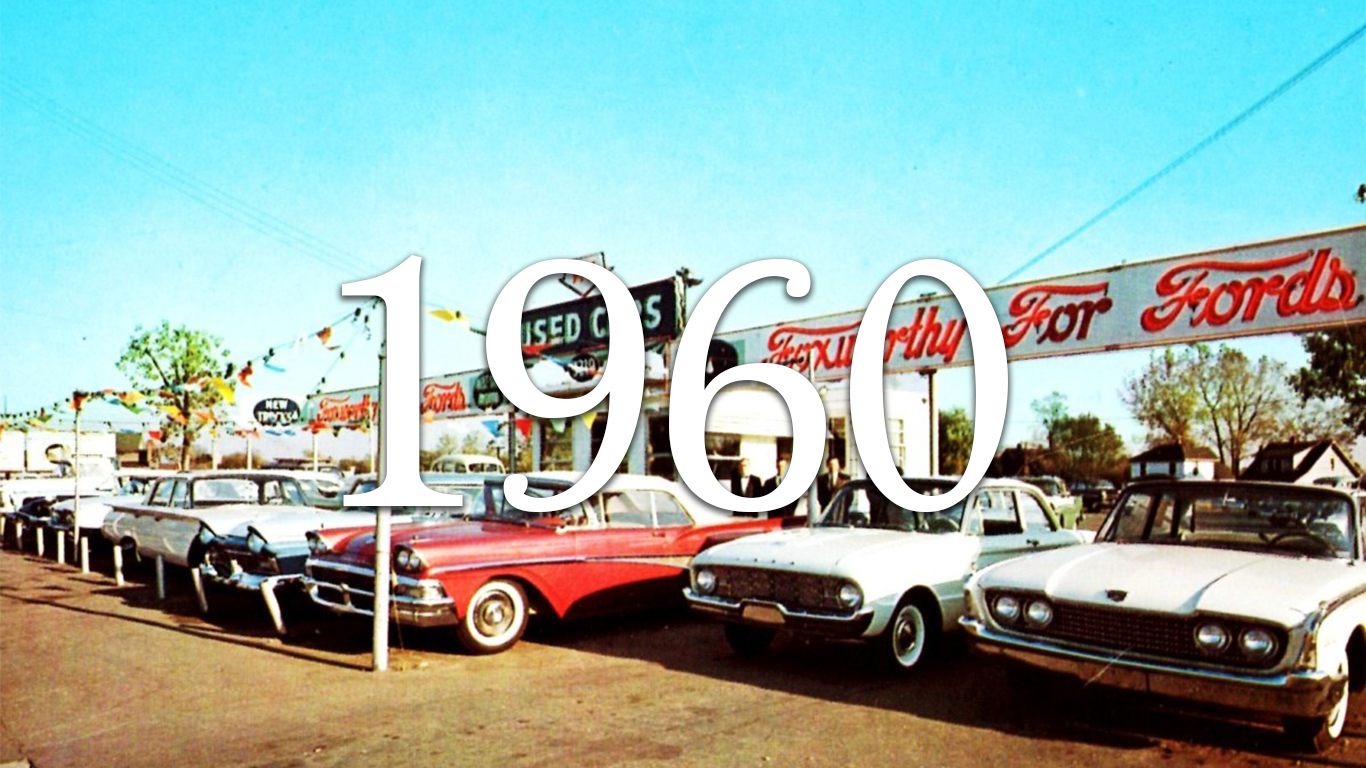
1960
> US population: 179,503,000
> Population below poverty line: 39,851,000
> Percent of all people in poverty: 22.2%
> Poverty threshold for unrelated individuals: $1,490
[in-text-ad]
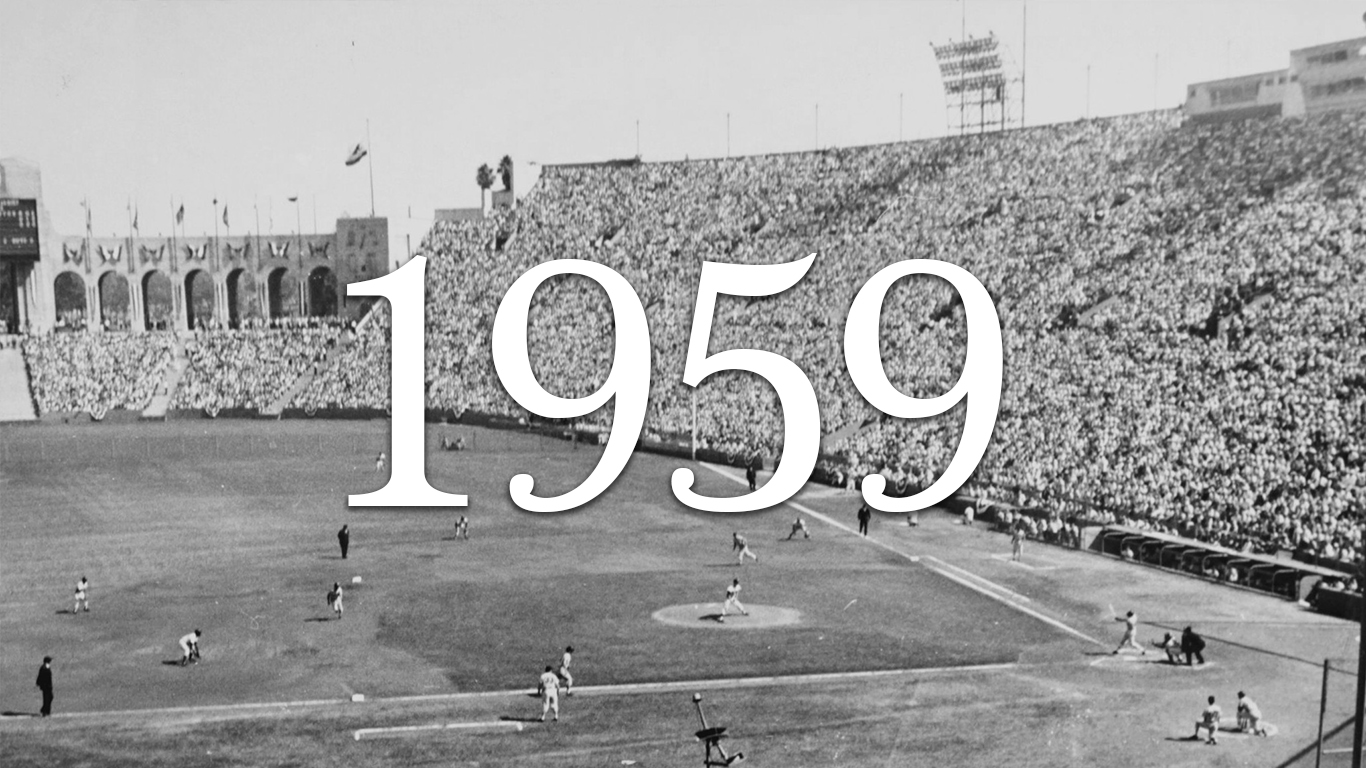
1959
> US population: 176,557,000
> Population below poverty line: 39,490,000
> Percent of all people in poverty: 22.4%
> Poverty threshold for unrelated individuals: $1,467
Contact [email protected] for any questions or corrections.