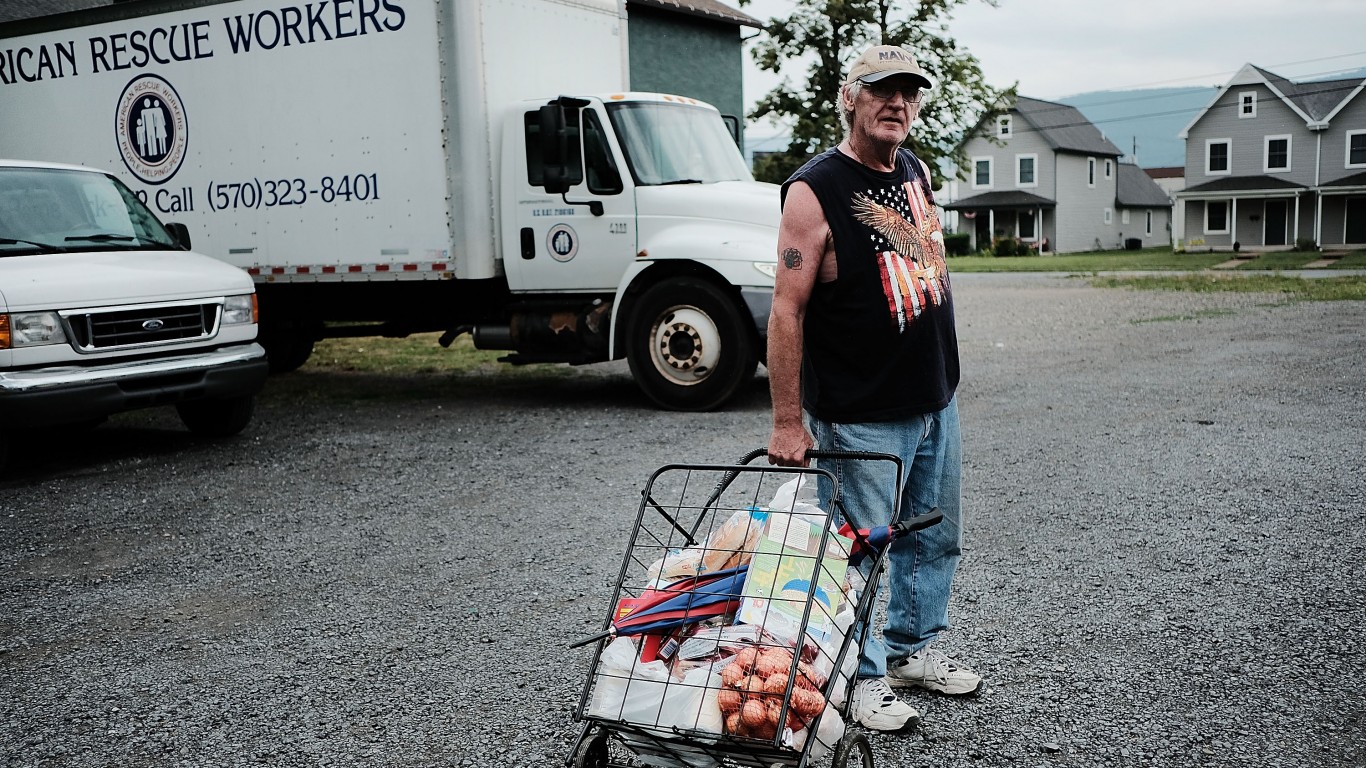
Before the COVID-19 pandemic cost millions of Americans their livelihoods, the U.S. poverty rate had been in decline for years, as the economy continued its recovery from the recession that began in 2008. The 2019 annual poverty rate was 10.5%, the lowest rate since at least 1959. The 2020 poverty rate figures to me much higher.
In 2019, the U.S. poverty threshold was in 2019 set at $26,172 or less for a family of four. There are a range of factors that affect the likelihood that a person will live below the poverty line — including their gender, their race, their education level and that of their parents, their age and health, where they were born, their residency status, and the composition of their family.
24/7 Wall St. analyzed government poverty statistics from the U.S. Census Bureau’s Current Population Survey for 26 selected population groups, including men and women, Hispanic Americans of all races, Black Americans, and white Americans, as well as full-time, part-time, and unemployed individuals.
We also compared poverty rates for people living in the South, Midwest, West, and Northeast parts of the United States. People in certain areas of the country, due in part to those areas’ dominant industries and a number of other factors, are much more susceptible to poverty than those living elsewhere in America. These are the richest and poorest states.
It is important to note that CPS data does not include certain groups. For instance, American Indian and Alaskan Natives, whose poverty rates have been estimated by some organizations at well over 20%, are not on this list.
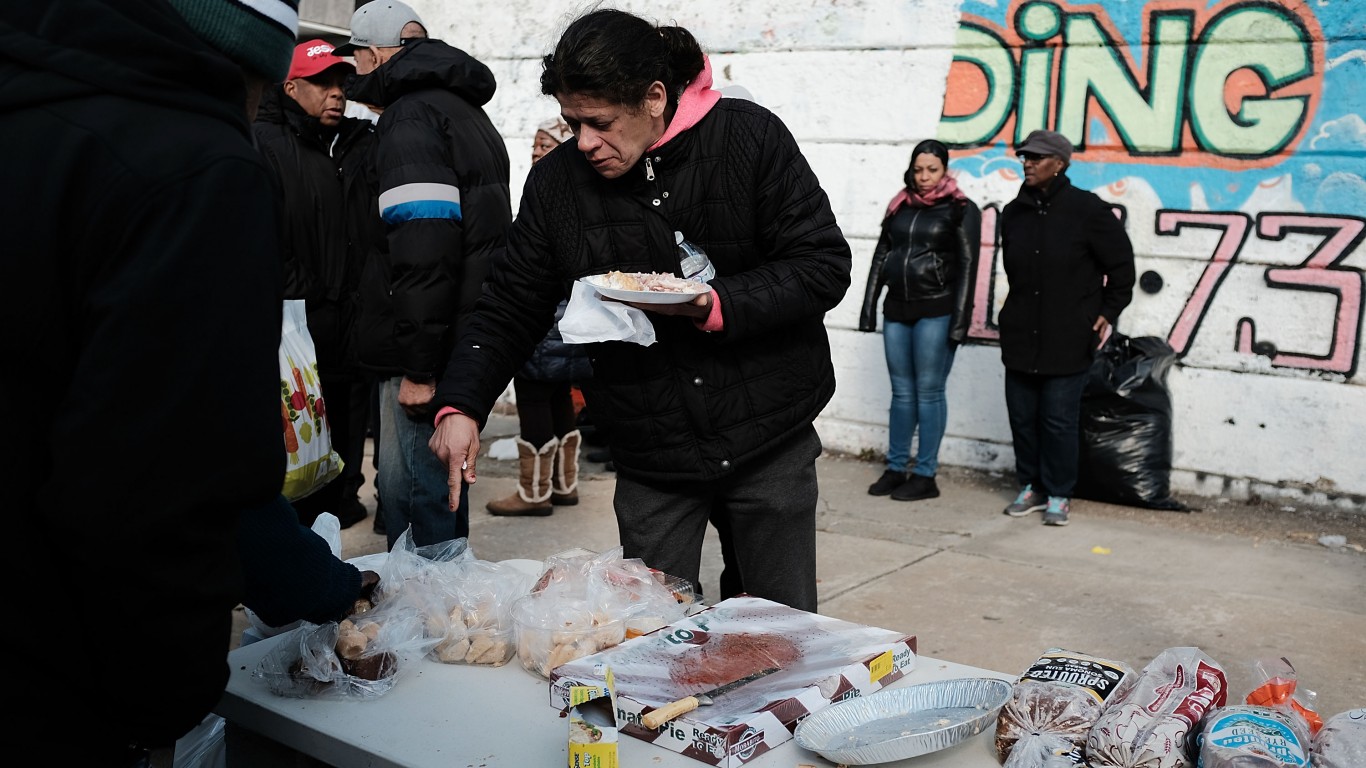
The pandemic and resulting economic fallout widened the already significant poverty gaps between white Americans and those from minority groups, who were more likely to lose their jobs and less likely to be able to work from home. The gaps similarly likely increased between men and women, who were hit harder but the COVID-19 recession. Children, workers with lower levels of education, part-time workers, and single-mother families were also hit harder by the pandemic.
Click here to see 29 Ways Poverty Affects Americans Differently.
Gender
Men
> Total group size: 159.2 million people
> Group members living below the poverty line: 15.0 million people
> Group poverty rate: 9.4%
Of the 159.2 million men in the United States, 15.0 million lived below the poverty line in 2019, or 9.4% — below the 10.5% poverty rate across all groups. For a number of reasons, men are more likely than women to be in the workforce and less likely to face discrimination related to salary or hiring.
[in-text-ad]
Women
> Total group size: 165.6 million people
> Group members living below the poverty line: 19.0 million people
> Group poverty rate: 11.5%
Women in the United States earn, on average, about 85 cents for every dollar men earn. Women are also far more likely than men to live below the poverty line. Of the 165.6 million women nationwide, 11.5% lived below the poverty line in 2019, compared to 10.5% of the 159.2 million U.S. men. The gap appeared to have widened in 2020 as women have been more vulnerable to the COVID-19 pandemic’s economic effects than men.
[recirclink id=738598]
Age
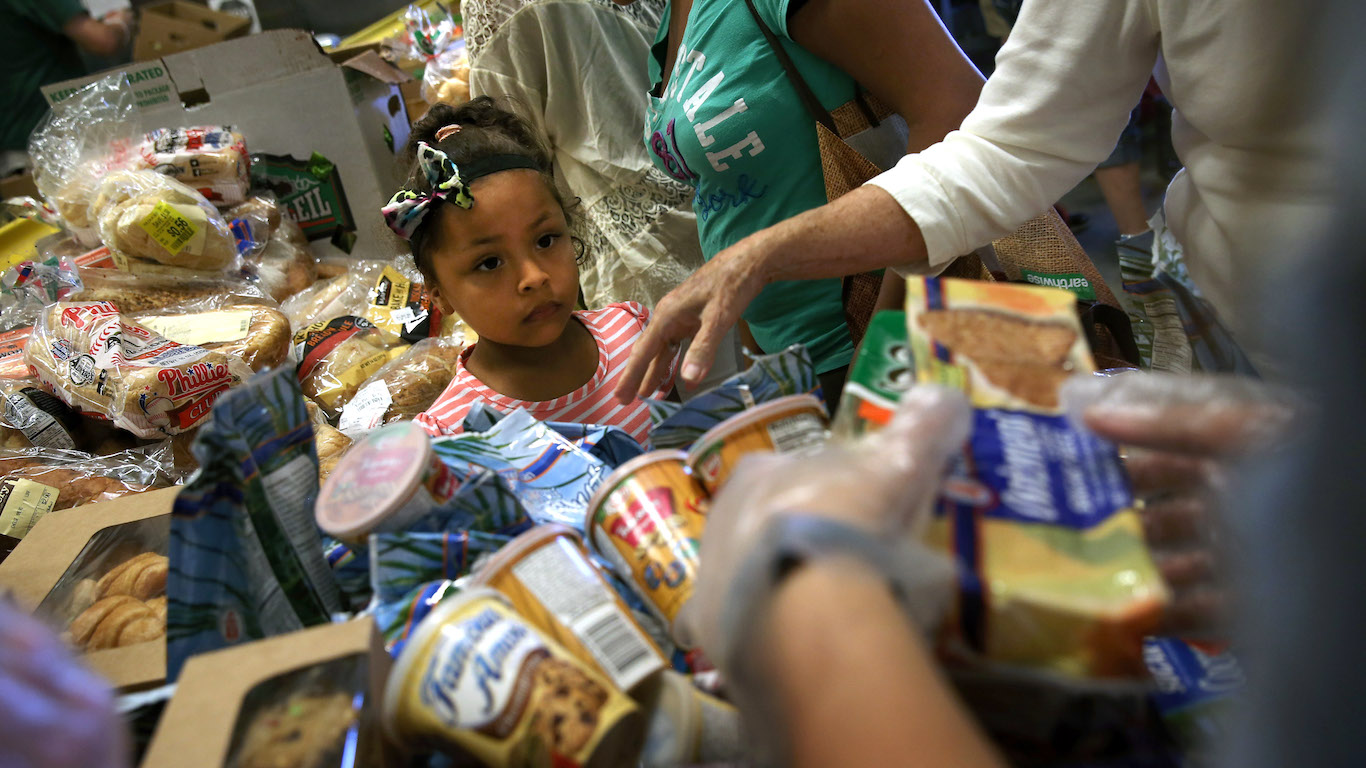
Under age 18
> Total group size: 72.6 million people
> Group members living below the poverty line: 10.5 million people
> Group poverty rate: 14.4%
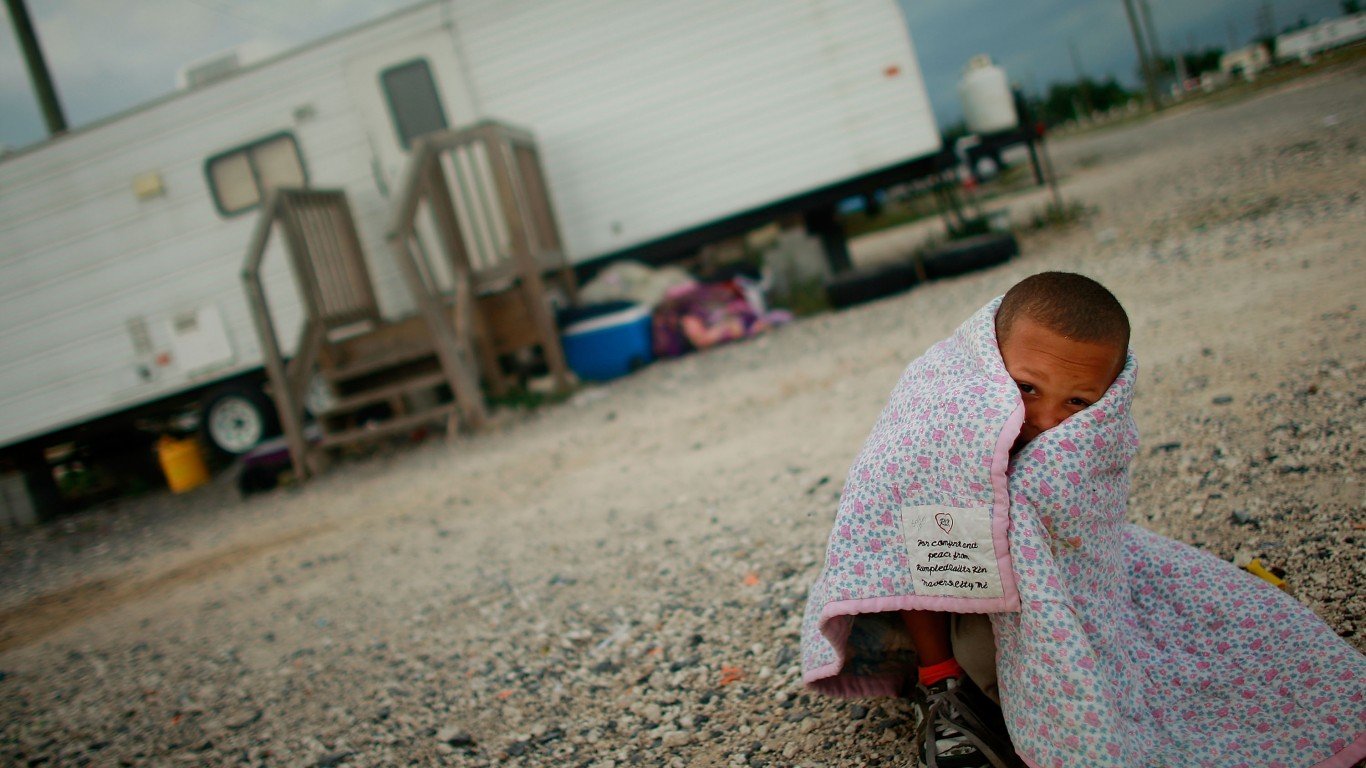
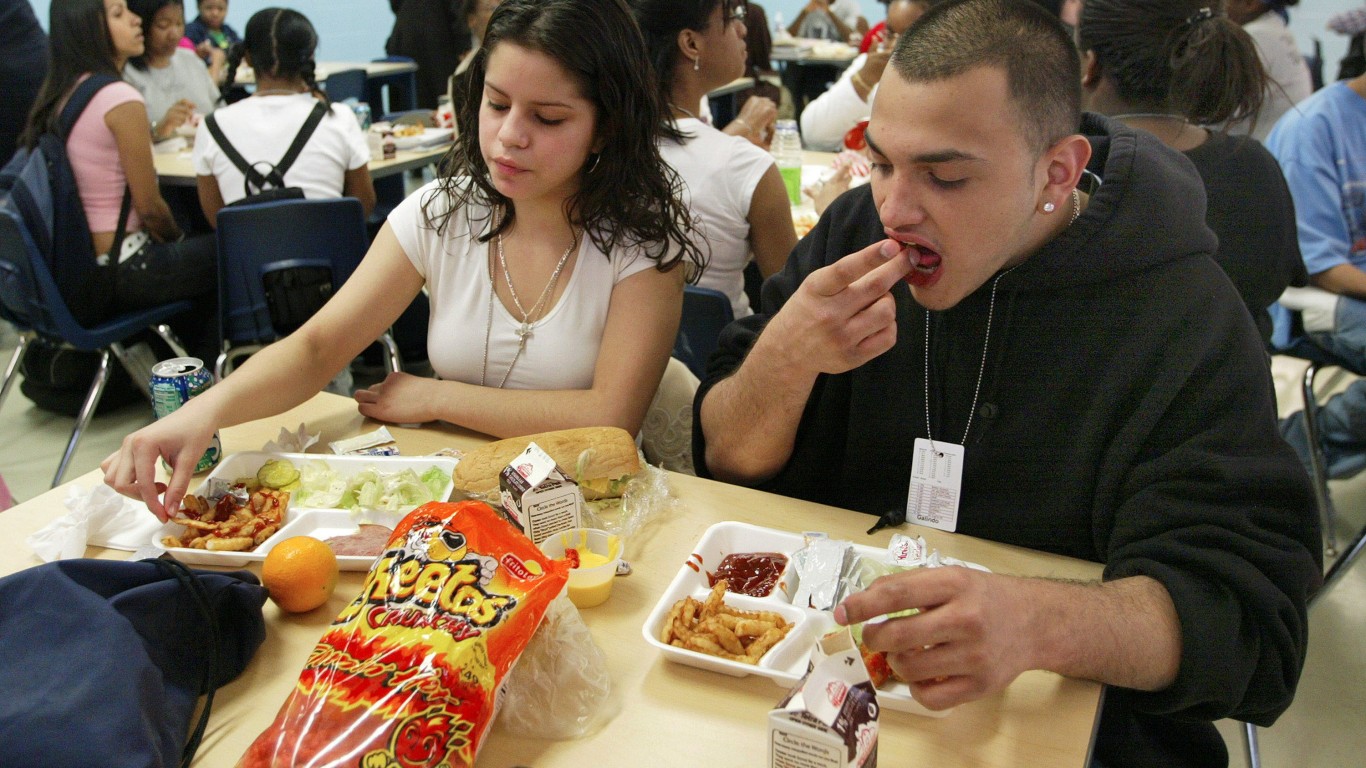
American children are far more likely to live below the poverty line than adults. Younger children are at an even greater risk of living in poverty, as are children of minority families. In 2019, there were 10.5 million children in poverty in the U.S., 14.4% of all those under age 18 nationwide.
Children were more likely than any other age group to fall below the poverty threshold during the first six months of the COVID-19 pandemic. According to research from Columbia University, the child poverty rate in America increased from 18.7% in January 2020 to 20.4% in September 2020, the largest increase among age groups.

Age 25 and over
> Total group size: 223.1 million people
> Group members living below the poverty line: 19.7 million people
> Group poverty rate: 8.8%
About 8.8% of Americans age 25 or older lived below the poverty line in 2019. The age range covers broad demographic groups, including those of prime working age as well as those who have retired.
[in-text-ad-2]

Age 65 and over
> Total group size: 54.6 million people
> Group members living below the poverty line: 4.9 million people
> Group poverty rate: 8.9%
After age 65, many working Americans begin transitioning into retirement. Those who have not saved enough or are not enrolled in a pension fund are at particularly high risk of financial hardhip and may need to continue working to stay out of poverty.
Region
Northeast
> Total group size: 55.1 million people
> Group members living below the poverty line: 5.2 million people
> Group poverty rate: 9.4%
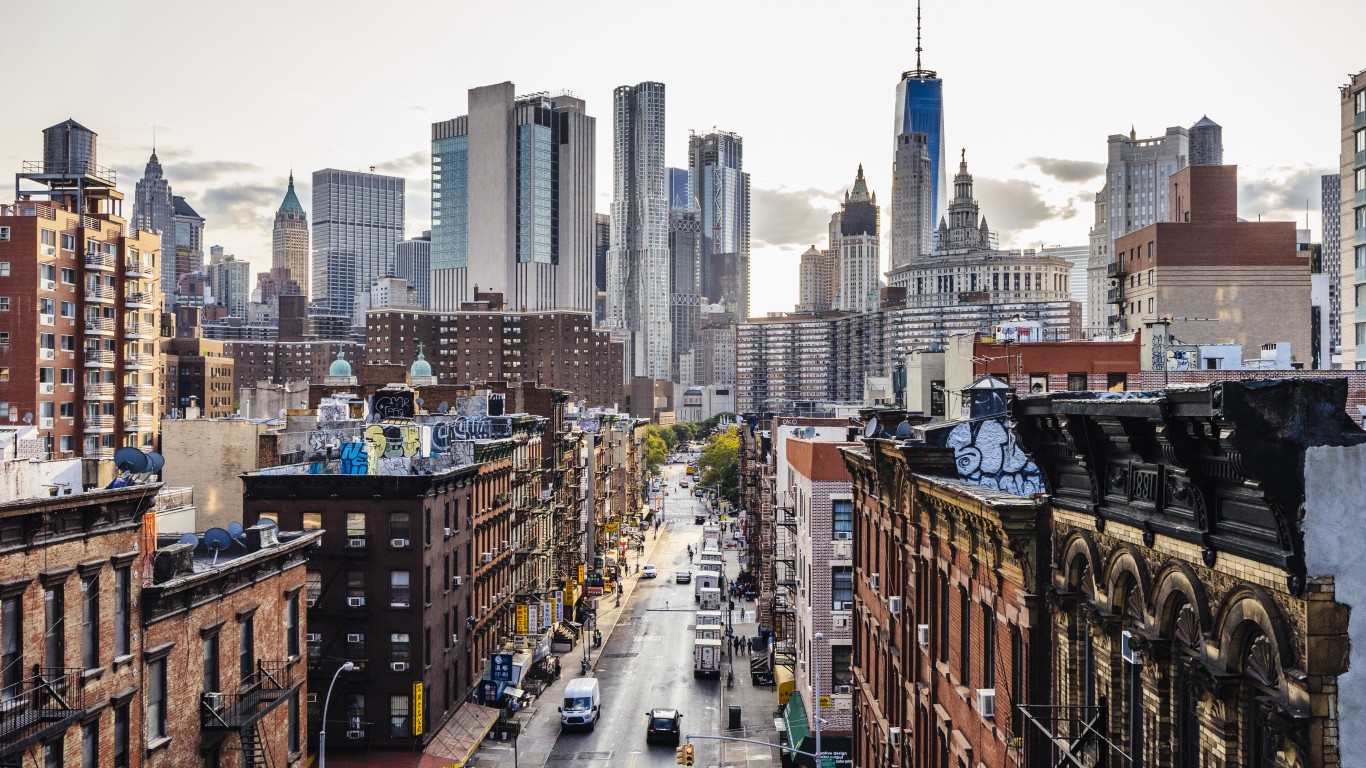
The Northeastern U.S. — a region extending from New Jersey and Pennsylvania up through New England — had the lowest poverty rate of all four Census designated regions in 2019. Of all nine states in the Northeast, New York had the highest poverty rate in 2019, at 12.5%. New Hampshire had the lowest, at 3.7%
[in-text-ad]
Midwest
> Total group size: 67.5 million people
> Group members living below the poverty line: 6.5 million people
> Group poverty rate: 9.7%
There are 12 states in the Midwest, extending from Ohio down and across to Kansas. Large swaths of the Midwest have been hit especially hard by the decline of American manufacturing. State poverty rates in the region ranged from 5.7% in Minnesota to 12.4% in Ohio in 2019.
[recirclink id=841244]

West
> Total group size: 78.0 million people
> Group members living below the poverty line: 7.4 million people
> Group poverty rate: 9.5%
The poverty rate among the 13 states in the West was 9.5% in 2019, slightly lower than the 10.5% rate across the U.S. as a whole. New Mexico’s 15.3% poverty rate was the highest in the region and third highest of U.S. states. Meanwhile, Washington had a poverty rate of 7.0%, tied for the fifth lowest among states.

South
> Total group size: 124.1 million people
> Group members living below the poverty line: 14.8 million people
> Group poverty rate: 12.0%
Ameicans in the South are more likely to live in poverty than those in any other geographic region. Across the 16 states that make up the South, the poverty rate was 12.0% in 2019. The region includes the two states with the highest poverty rates — Louisiana and Mississippi, which had poverty rates of 17.9% and 19.2%, respectively.
[in-text-ad-2]
Education
Adults without a high school diploma
> Total group size: 20.2 million people
> Group members living below the poverty line: 4.8 million people
> Group poverty rate: 23.7%
Education is one of the best ways to help ensure financial security in the United States, and American adults who have not completed high school are at an especially high risk of living in poverty. More than one in every five of the 22 million adults aged 25 and over who dropped out of high school lived below the poverty line in 2019.

Adults with a high school diploma, no college
> Total group size: 61.6 million people
> Group members living below the poverty line: 7.1 million people
> Group poverty rate: 11.5%
Adults for whom the highest level of education is high school are at a slightly greater than average risk of poverty. Of the 61.6 million Americans who fit into this demographic, 11.5% lived in poverty in 2019, compared to 10.5% of all Americans.
[in-text-ad]

Adults with some college
> Total group size: 57.6 million people
> Group members living below the poverty line: 4.5 million people
> Group poverty rate: 7.8%
Income tends to rise with educational attainment, and the risk of poverty tends to fall. Of the 57.6 million Americans with some college education but less than a bachelor’s degree, 7.8% lived in poverty in 2019.
[recirclink id=817762]

Adults with a bachelor’s degree or higher
> Total group size: 83.7 million people
> Group members living below the poverty line: 3.3 million people
> Group poverty rate: 3.9%
Adults with a four-year degree are far less likely to face serious financial hardship — but that does not mean that college-educated adults are immune to poverty by any means. In 2019, there were some 3.3 million Americans aged 25 and over with a bachelor’s degree or higher, or 3.9% of the demographics, who lived below the poverty line.
Family status
All families
> Total group size: 83.7 million people
> Group members living below the poverty line: 6.6 million people
> Group poverty rate: 7.8%
Married-couple families gs updated MA
> Total group size: 62.4 million people
> Group members living below the poverty line: 2.5 million people
> Group poverty rate: 4.0%
People living with family members in the United States are less likely than the typical American to live below the poverty line. The poverty rate among the 83.7 million Americans living with their family was 7.8% in 2019, compared to the 10.5% poverty rate across the population as a whole.
Family status
Those living in a two-parent household are far less likely than those in other living situations to live on poverty-level incomes. Married-couple families have a greater range of options related to childcare and employment than single-parent households. Nationwide, some 4.0% of people living in married-couple families lived below the poverty line in 2019, less than half the 10.5% poverty rate among all Americans.
[in-text-ad-2]

Single parent households with male head of household
> Total group size: 6.5 million people
> Group members living below the poverty line: 746,000 people
> Group poverty rate: 11.5%
Single-father households are far less common in the United States than single-mother households. And just as men are less likely to live in poverty than women, those living in single-father households are far less likely to live in poverty than single-mother households. Some 11.5% of Americans in single-parent households headed by a man lived in poverty in 2019, compared to 22.2% of such households headed by a woman.
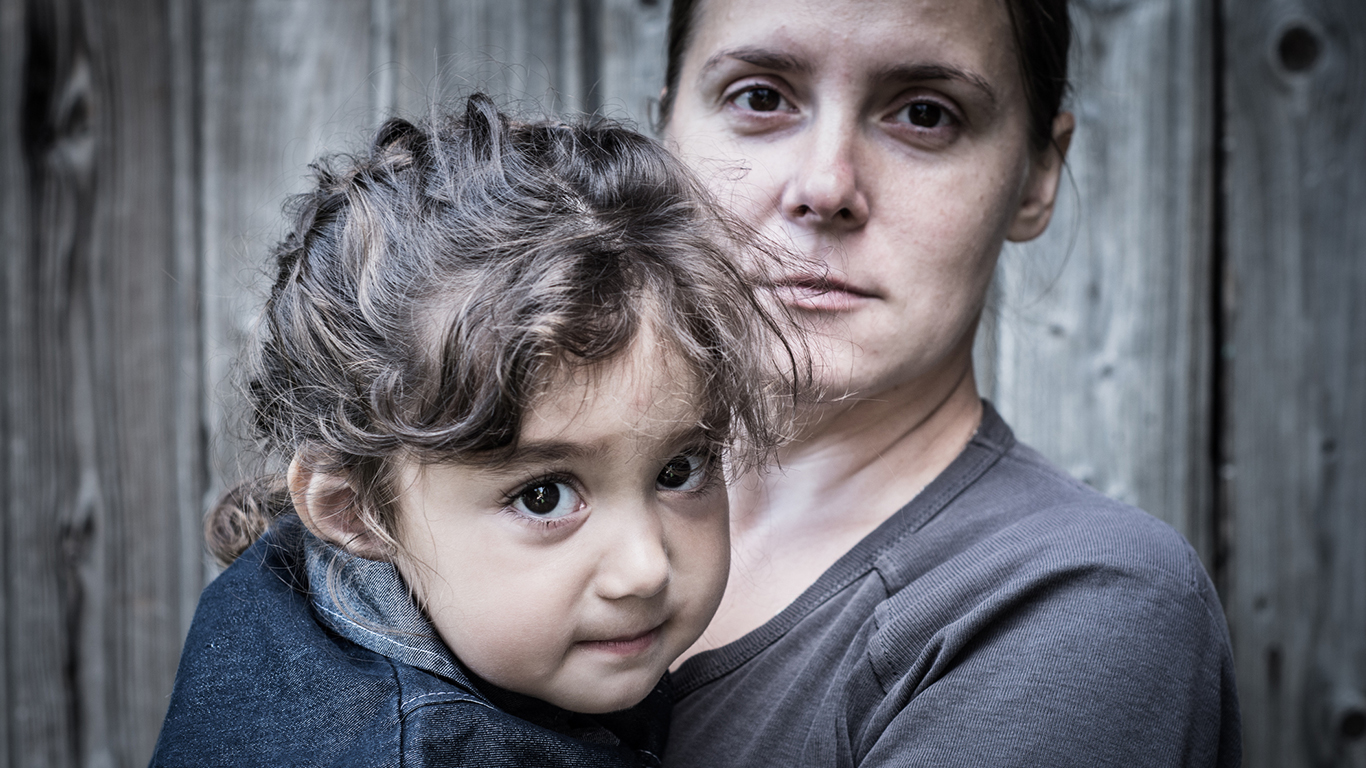
Single parent households with female head of household
> Total group size: 14.8 million people
> Group members living below the poverty line: 3.3 million people
> Group poverty rate: 22.2%
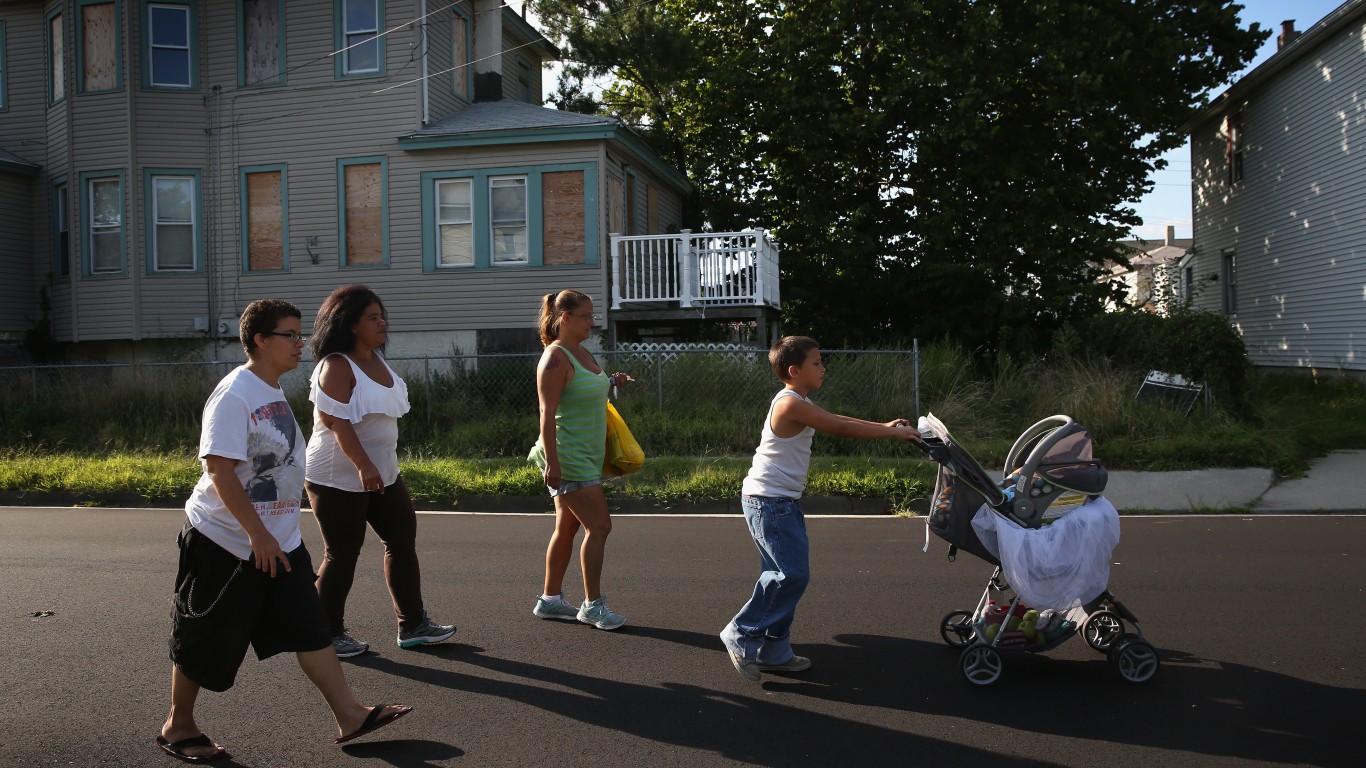
Women are more likely than men to live in poverty, and adding dependents into the picture only adds to the financial struggles. Roughly two out of every nine people living in single-parent households headed by a woman lived below the poverty line in 2019, compared to the poverty rate of 11.5% among women alone.
The increased likelihood of financial hardship is due to a number of factors, including that employed mothers are less likely to work full time than employed fathers, and that women earn an average of 85 cents for every dollar men earn.
[in-text-ad]
Employment
Worked full-time, year round
> Total group size: 119.1 million people
> Group members living below the poverty line: 2.4 million people
> Group poverty rate: 2.0%
The best way to avoid poverty is to have a steady source of income. Perhaps not surprisingly, the poverty rate among Americans working full time was just 2.0% in the last year, a fraction of the overall 10.5% poverty rate. Still, for many working Americans, particularly those in low-paying jobs with dependents, even working 40 hours a week is not enough to stay out of poverty. There were some 2.4 million Americans working full time living below the poverty line in 2019.
[recirclink id=824625]

Part-time workers
> Total group size: 50.4 million people
> Group members living below the poverty line: 5.3 million people
> Group poverty rate: 10.5%
Americans may be working part time for any number of reasons, including setting aside time to further their education, child care responsibilities, or difficulty finding a full-time position. Of the 50.4 million Americans working part time in 2019, 10.5% lived below the poverty line, equivalent to the overall poverty rate.
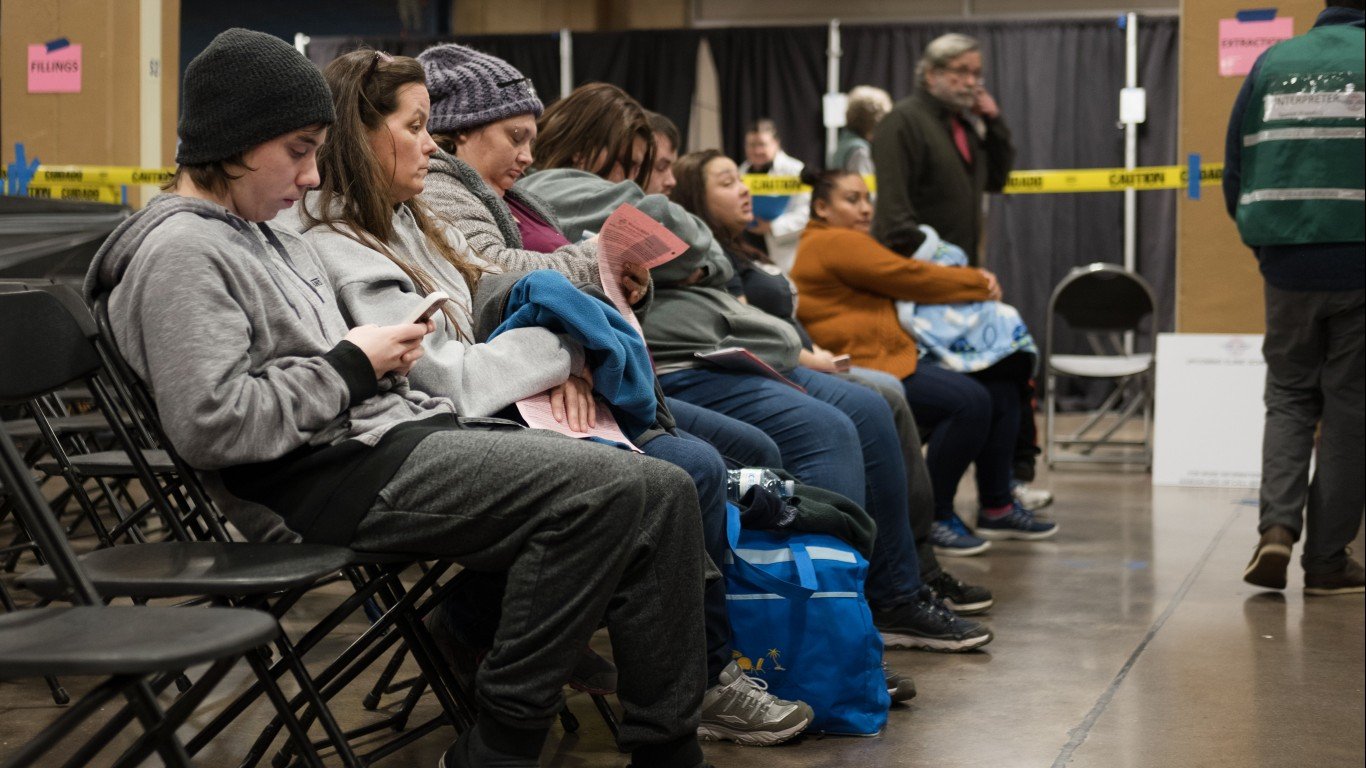
Not working (age 16 and older)
> Total group size: 91.2 million people
> Group members living below the poverty line: 16.9 million people
> Group poverty rate: 18.5%
There were over 91 million Americans aged 16 and over who did not work in 2019. Without a steady income stream, this demographic is particularly susceptible to poverty. Slightly less than one in every five working-age Americans who did not work in 2019 lived in poverty, well above the 10.5% national poverty rate. The COVID-19 pandemic cost millions of Americans their jobs, causing many people who were formerly employed to slip below the income threshold needed to avoid poverty.
[in-text-ad-2]
Race and Ethnicity

White alone, not hispanic
> Total group size: 194.6 million people
> Group members living below the poverty line: 14.2 million people
> Group poverty rate: 7.3%
Americans who identify as white are the least likely racial group to live below the poverty line. Among the 194.6 million non-Hispanic whites living in the United States, 7.3% lived in poverty in 2019, a considerably smaller share than the 10.5% national poverty rate.

Asian alone
> Total group size: 19.9 million people
> Group members living below the poverty line: 1.5 million people
> Group poverty rate: 7.3%
Americans of Asian descent are less likely to live in poverty than the typical American but just slightly more likely to live in poverty than white Americans. Of the nearly 20 million Americans who identify as Asian, 7.34% lived below the poverty line in 2019 — below the 10.5% overall poverty rate but higher than the 7.27% rate among Americans who identify as white.
[in-text-ad]

Hispanic (any race)
> Total group size: 60.6 million people
> Group members living below the poverty line: 9.5 million people
> Group poverty rate: 15.7%
Hispanic Americans are defined as those of Cuban, Mexican, Puerto Rican, South or Central American descent, or other Spanish culture or origin regardless of race. Hispanic Americans are far more likely than the typical American to live below the poverty line. Of the 60.6 million Americans who identify as Hispanic, 15.7% live in poverty, compared to 10.5% of all Americans.
The poverty gap between white and Hispanic Americans widened during the pandemic. For white Americans, the monthly poverty rate was roughly 11%, and it increased to 12.3% by August 2020. For Hispanic individuals, the pre-pandemic monthly poverty rate was nearly 24%. That figure increased to 26.9% as of August 2020.
[recirclink id=830326]

Black alone
> Total group size: 43.0 million people
> Group members living below the poverty line: 8.1 million people
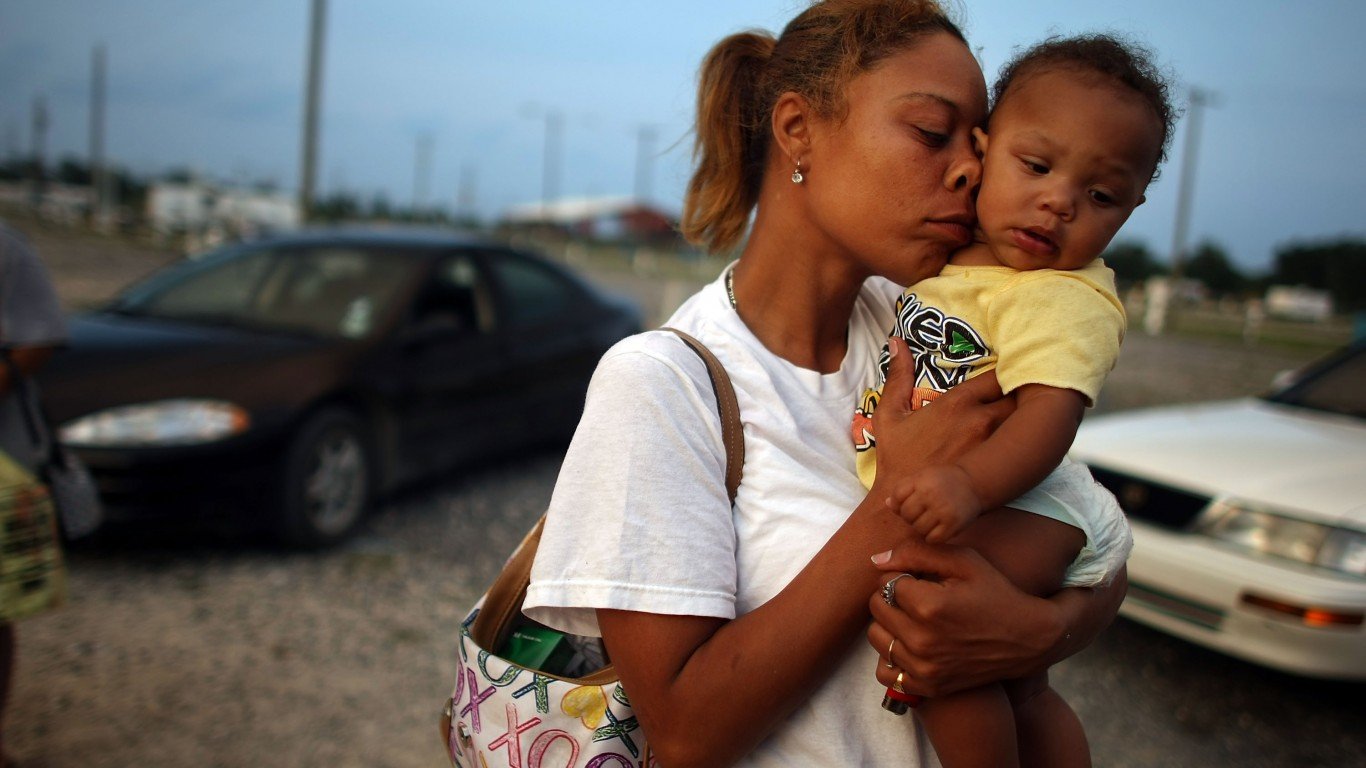
> Group poverty rate: 18.8%
Black Americans were nearly twice as likely to live below the poverty line as white Americans, in 2019. More than one in every six of the 43.0 million Americans who identify as Black live below the poverty line, compared to less than one in every 10 white Americans.
Citizenship
People born in the US
> Total group size: 279.9 million people
> Group members living below the poverty line: 28.3 million people
> Group poverty rate: 10.1%
People who were born in the United States are slightly less likely to face serious financial hardship than those who live in the U.S. but were born abroad. Some 10.1% of native-born Americans lived below the poverty line in 2019, slightly below the 10.5% poverty rate overall.
[in-text-ad-2]
All US citizens
> Total group size: 302.6 million people
> Group members living below the poverty line: 30.4 million people
> Group poverty rate: 10.0%
One of the strongest predictors of poverty in the United States is citizenship. U.S. citizens — both foreign and native born — have access to a far wider range of employment opportunities than non-citizens. The poverty rate among American citizens was 10.0% in 2019, below the 10.5% poverty rate among everyone living in the United States.
Foreign-born, naturalized citizen
> Total group size: 22.7 million people
> Group members living below the poverty line: 2.0 million people
> Group poverty rate: 9.0%
Overall, those born outside of the United States are more likely to live in poverty than those born in the country. The one exception, however, is those who were born abroad and have become naturalized U.S. citizens. Of the 22.7 million Americans who fit that description, 9.0% lived in poverty in 2019, compared to the 10.1% poverty rate among native-born citizens. The requirements to become a naturalized citizen are extensive and may favor those who are more likely to be financially secure.
[in-text-ad]
Foreign-born, not a citizen
> Total group size: 22.1 million people
> Group members living below the poverty line: 3.6 million people
> Group poverty rate: 16.3%
The poverty rate among those born in a different country and are not U.S. citizens was 16.3% in 2019. Non-U.S. citizens living in the country are often forced to live and work in the shadows, and doing so often means working at very low paying jobs.
Contact [email protected] for any questions or corrections.