
U.S. population growth slowed over the last decade to its lowest rate since the Great Depression. The U.S. population is aging rapidly, as baby boomers have started to hit retirement age, while challenging economic circumstances caused many younger Americans to postpone having a family — and this was before the pandemic made conditions even more difficult.
While the U.S. population increased in the past decade, albeit at a slow pace, some areas reported population decline, mostly due to people moving away. As people move away to either retire or to take on a new job, natural population increase has not been enough to offset net migration losses. Nearly every state has at least one county where the population declined significantly from 2010 to 2020 — in some cases by well over 10%.
To determine the fastest shrinking county in every state, 24/7 Wall St. reviewed data on population from the U.S. Census Bureau’s Population and Housing Unit Estimates Program. Counties were ranked based on the total population change from 2010 to 2020.
There are four states with no counties that experienced population decline from 2010 to 2020 — Delaware, Hawaii, South Dakota, and Washington. All but Hawaii rank among the fastest growing states. There are 11 states with a county that reported a more than 14% decline in population from 2010 to 2020. Nine are located in the South.
Economic opportunity — or lack thereof — can be a major factor that causes people to relocate. Most of the fastest shrinking counties in every state have an unemployment rate and a poverty rate greater than or equal to that of the state itself. Other factors, like prevalence of violent crime, lack of recreational activities, and other less desirable qualities can be factors that cause residents to leave an area in droves. These are the worst counties to live in every state.
Click here to see the fastest shrinking county in every state
Click here to see our detailed methodology

Alabama: Perry County
> 2010-2020 population change: -17.9% (10,577 to 8,687)
> 2010-2020 population change, Alabama: +3.0% (4.8 million to 4.9 million)
> 2010-2020 population change due to migration: -1,684
> May 2021 unemployment: 7.0% (state: 2.9%)
[in-text-ad]

Alaska: Kodiak Island Borough
> 2010-2020 population change: -4.5% (13,606 to 12,992)
> 2010-2020 population change, Alaska: +2.9% (710,246 to 731,158)
> 2010-2020 population change due to migration: -2,075
> May 2021 unemployment: 6.4% (state: 6.4%)
[recirclink id=914737]

Arizona: Cochise County
> 2010-2020 population change: -3.0% (131,359 to 127,450)
> 2010-2020 population change, Arizona: +16.1% (6.4 million to 7.4 million)
> 2010-2020 population change due to migration: -6,564
> May 2021 unemployment: 6.4% (state: 6.7%)

Arkansas: Phillips County
> 2010-2020 population change: -20.5% (21,755 to 17,299)
> 2010-2020 population change, Arkansas: +3.9% (2.9 million to 3.0 million)
> 2010-2020 population change due to migration: -4,755
> May 2021 unemployment: 8.1% (state: 4.5%)
[in-text-ad-2]

California: Lassen County
> 2010-2020 population change: -14.0% (34,895 to 30,016)
> 2010-2020 population change, California: +5.7% (37.3 million to 39.4 million)
> 2010-2020 population change due to migration: -5,792
> May 2021 unemployment: 5.3% (state: 7.5%)

Colorado: Las Animas County
> 2010-2020 population change: -7.0% (15,506 to 14,420)
> 2010-2020 population change, Colorado: +15.5% (5.0 million to 5.8 million)
> 2010-2020 population change due to migration: -643
> May 2021 unemployment: 6.5% (state: 5.8%)
[in-text-ad]

Connecticut: Litchfield County
> 2010-2020 population change: -5.4% (189,876 to 179,610)
> 2010-2020 population change, Connecticut: -0.5% (3.6 million to 3.6 million)
> 2010-2020 population change due to migration: -6,434
> May 2021 unemployment: 5.0% (state: 6.8%)
[recirclink id=916521]

Delaware: New Castle County
> 2010-2020 population change: +4.3% (538,496 to 561,531)
> 2010-2020 population change, Delaware: +9.9% (897,947 to 986,809)
> 2010-2020 population change due to migration: +4,474
> May 2021 unemployment: 5.1% (state: 5.1%)
Florida: Gulf County
> 2010-2020 population change: -14.7% (15,863 to 13,534)
> 2010-2020 population change, Florida: +15.6% (18.8 million to 21.7 million)
> 2010-2020 population change due to migration: -1,746
> May 2021 unemployment: 3.9% (state: 5.0%)
[in-text-ad-2]
Georgia: Macon County
> 2010-2020 population change: -13.8% (14,743 to 12,712)
> 2010-2020 population change, Georgia: +10.5% (9.7 million to 10.7 million)
> 2010-2020 population change due to migration: -1,849
> May 2021 unemployment: 4.6% (state: 4.0%)

Hawaii: Honolulu County
> 2010-2020 population change: +1.1% (953,203 to 963,826)
> 2010-2020 population change, Hawaii: +3.4% (1.4 million to 1.4 million)
> 2010-2020 population change due to migration: -42,716
> May 2021 unemployment: 6.7% (state: 7.4%)
[in-text-ad]

Idaho: Fremont County
> 2010-2020 population change: -0.2% (13,243 to 13,218)
> 2010-2020 population change, Idaho: +16.5% (1.6 million to 1.8 million)
> 2010-2020 population change due to migration: -879
> May 2021 unemployment: 2.3% (state: 2.9%)
[recirclink id=916394]

Illinois: Cass County
> 2010-2020 population change: -12.6% (13,641 to 11,925)
> 2010-2020 population change, Illinois: -1.9% (12.8 million to 12.6 million)
> 2010-2020 population change due to migration: -2,007
> May 2021 unemployment: 4.3% (state: 6.7%)
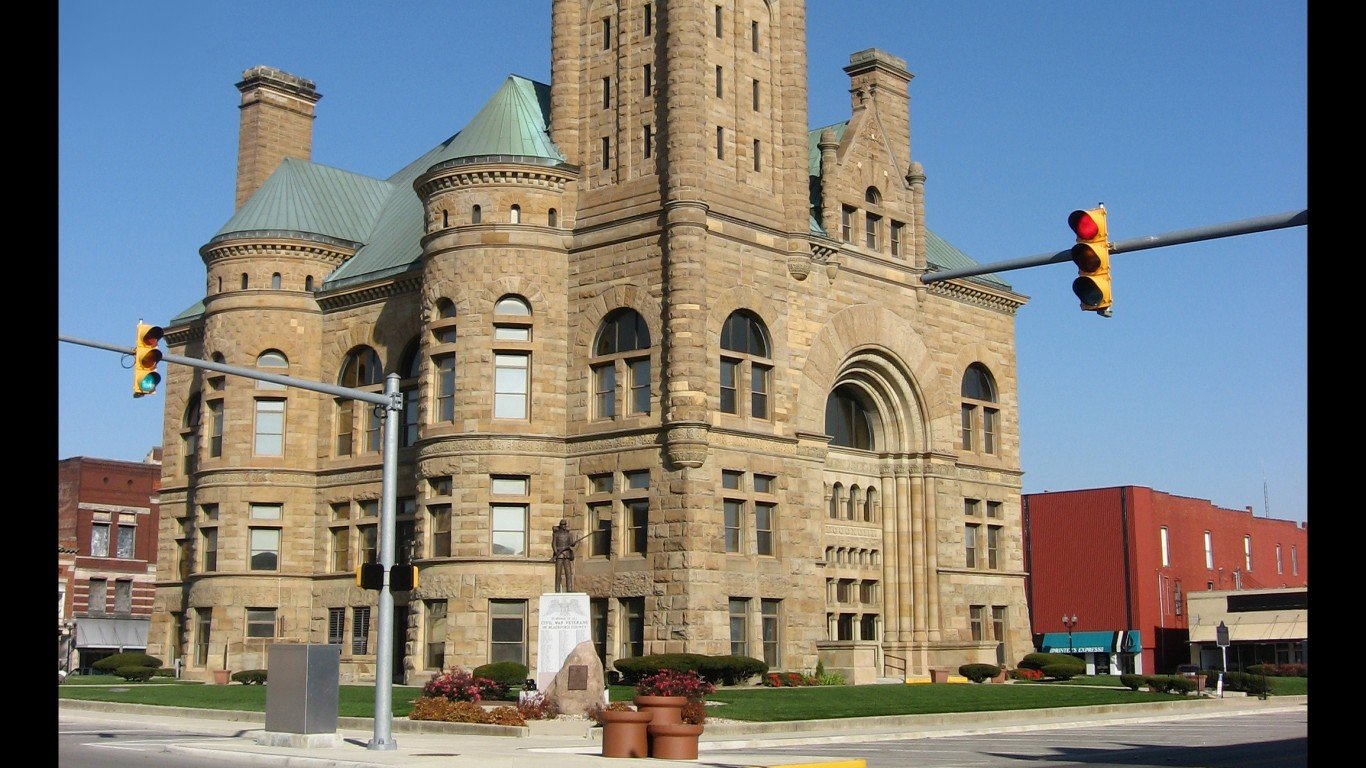
Indiana: Blackford County
> 2010-2020 population change: -7.7% (12,766 to 11,782)
> 2010-2020 population change, Indiana: +4.2% (6.5 million to 6.8 million)
> 2010-2020 population change due to migration: -768
> May 2021 unemployment: 4.4% (state: 4.5%)
[in-text-ad-2]
Iowa: Emmet County
> 2010-2020 population change: -11.7% (10,302 to 9,095)
> 2010-2020 population change, Iowa: +3.8% (3.0 million to 3.2 million)
> 2010-2020 population change due to migration: -1,062
> May 2021 unemployment: 3.9% (state: 4.1%)

Kansas: Montgomery County
> 2010-2020 population change: -11.2% (35,468 to 31,502)
> 2010-2020 population change, Kansas: +2.1% (2.9 million to 2.9 million)
> 2010-2020 population change due to migration: -3,741
> May 2021 unemployment: 4.6% (state: 3.7%)
[in-text-ad]

Kentucky: Leslie County
> 2010-2020 population change: -14.8% (11,310 to 9,637)
> 2010-2020 population change, Kentucky: +3.2% (4.3 million to 4.5 million)
> 2010-2020 population change due to migration: -1,284
> May 2021 unemployment: 6.7% (state: 3.9%)
[recirclink id=914737]

Louisiana: Morehouse Parish
> 2010-2020 population change: -13.4% (27,979 to 24,227)
> 2010-2020 population change, Louisiana: +2.5% (4.5 million to 4.6 million)
> 2010-2020 population change due to migration: -3,500
> May 2021 unemployment: 8.2% (state: 6.7%)

Maine: Aroostook County
> 2010-2020 population change: -7.1% (71,873 to 66,804)
> 2010-2020 population change, Maine: +1.6% (1.3 million to 1.4 million)
> 2010-2020 population change due to migration: -2,816
> May 2021 unemployment: 6.2% (state: 5.1%)
[in-text-ad-2]

Maryland: Allegany County
> 2010-2020 population change: -6.6% (75,042 to 70,057)
> 2010-2020 population change, Maryland: +4.9% (5.8 million to 6.1 million)
> 2010-2020 population change due to migration: -2,504
> May 2021 unemployment: 6.3% (state: 5.9%)

Massachusetts: Berkshire County
> 2010-2020 population change: -5.1% (131,274 to 124,571)
> 2010-2020 population change, Massachusetts: +5.3% (6.5 million to 6.9 million)
> 2010-2020 population change due to migration: -2,256
> May 2021 unemployment: 7.0% (state: 5.0%)
[in-text-ad]

Michigan: Gogebic County
> 2010-2020 population change: -15.7% (16,424 to 13,842)
> 2010-2020 population change, Michigan: +0.8% (9.9 million to 10.0 million)
> 2010-2020 population change due to migration: -1,715
> May 2021 unemployment: 5.5% (state: 5.2%)
[recirclink id=916521]

Minnesota: Koochiching County
> 2010-2020 population change: -9.5% (13,319 to 12,059)
> 2010-2020 population change, Minnesota: +6.7% (5.3 million to 5.7 million)
> 2010-2020 population change due to migration: -759
> May 2021 unemployment: 5.0% (state: 3.7%)
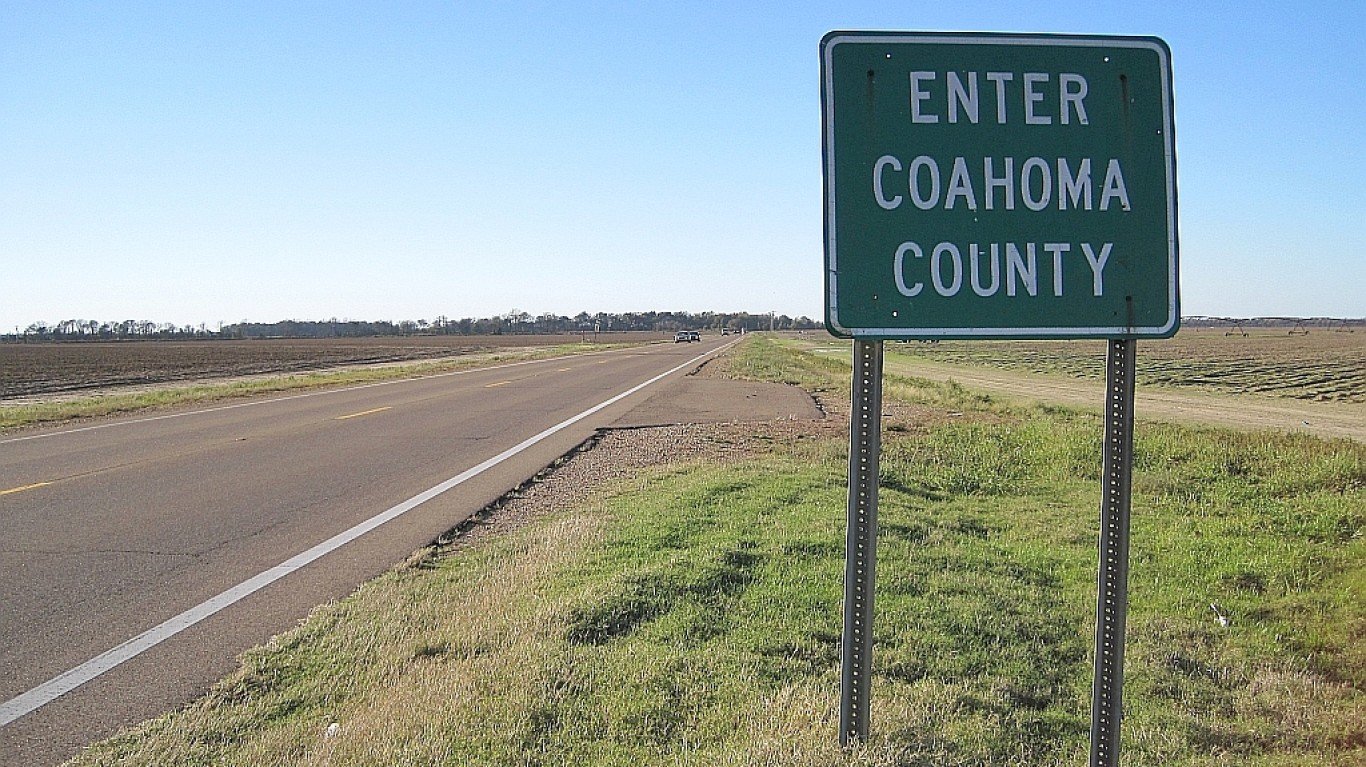
Mississippi: Coahoma County
> 2010-2020 population change: -17.5% (26,151 to 21,564)
> 2010-2020 population change, Mississippi: +0.0% (3.0 million to 3.0 million)
> 2010-2020 population change due to migration: -5,634
> May 2021 unemployment: 9.7% (state: 6.1%)
[in-text-ad-2]

Missouri: DeKalb County
> 2010-2020 population change: -15.1% (12,888 to 10,944)
> 2010-2020 population change, Missouri: +2.7% (6.0 million to 6.2 million)
> 2010-2020 population change due to migration: -1,786
> May 2021 unemployment: 3.8% (state: 4.7%)

Montana: Fergus County
> 2010-2020 population change: -4.2% (11,590 to 11,104)
> 2010-2020 population change, Montana: +9.2% (989,400 to 1.1 million)
> 2010-2020 population change due to migration: -88
> May 2021 unemployment: 2.7% (state: 3.2%)
[in-text-ad]

Nebraska: Box Butte County
> 2010-2020 population change: -5.4% (11,308 to 10,696)
> 2010-2020 population change, Nebraska: +6.1% (1.8 million to 1.9 million)
> 2010-2020 population change due to migration: -913
> May 2021 unemployment: 2.2% (state: 2.3%)
[recirclink id=916394]

Nevada: White Pine County
> 2010-2020 population change: -5.6% (10,026 to 9,466)
> 2010-2020 population change, Nevada: +16.2% (2.7 million to 3.1 million)
> 2010-2020 population change due to migration: -680
> May 2021 unemployment: 3.0% (state: 7.7%)

New Hampshire: Coos County
> 2010-2020 population change: -5.7% (33,052 to 31,174)
> 2010-2020 population change, New Hampshire: +3.8% (1.3 million to 1.4 million)
> 2010-2020 population change due to migration: +35
> May 2021 unemployment: 1.8% (state: 2.4%)
[in-text-ad-2]

New Jersey: Cumberland County
> 2010-2020 population change: -6.1% (156,610 to 147,008)
> 2010-2020 population change, New Jersey: +1.0% (8.8 million to 8.9 million)
> 2010-2020 population change due to migration: -14,342
> May 2021 unemployment: 7.8% (state: 7.0%)
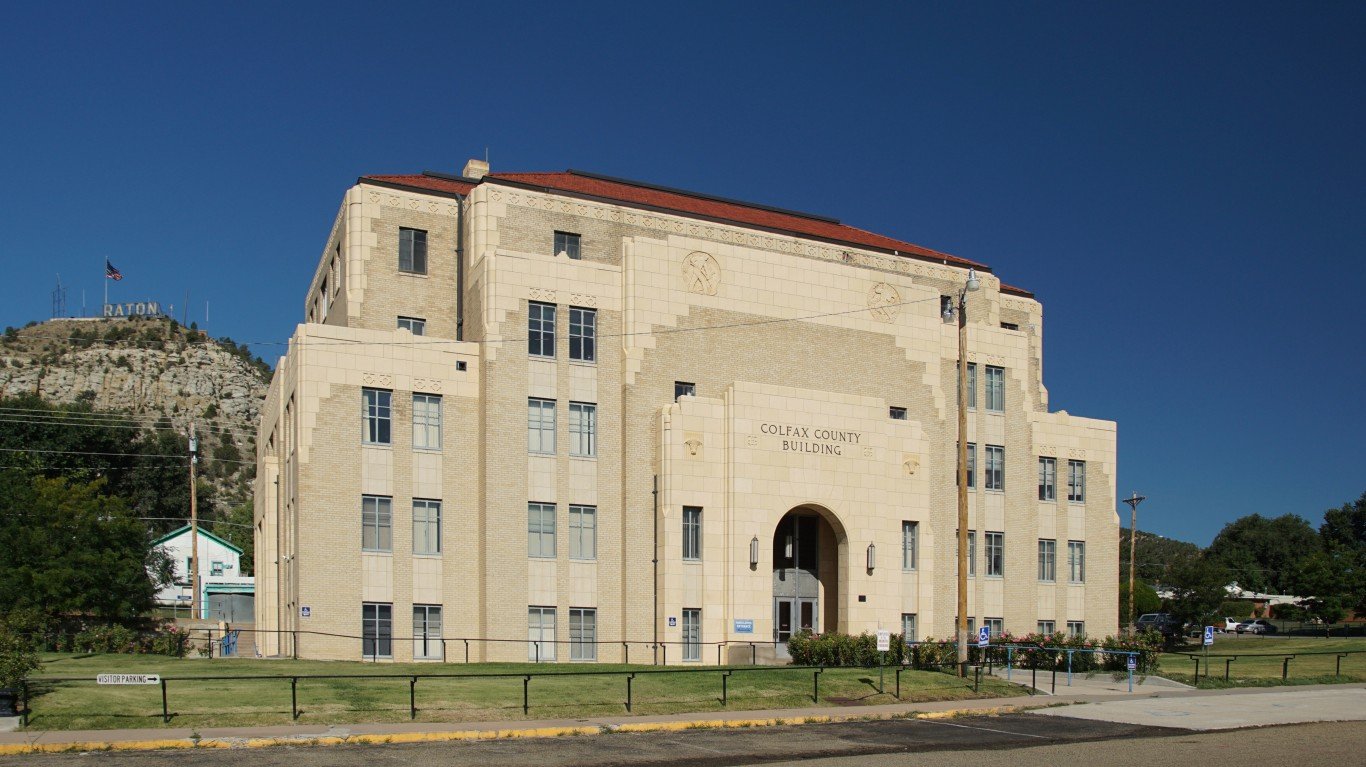
New Mexico: Colfax County
> 2010-2020 population change: -13.3% (13,751 to 11,927)
> 2010-2020 population change, New Mexico: +2.3% (2.1 million to 2.1 million)
> 2010-2020 population change due to migration: -1,595
> May 2021 unemployment: 6.7% (state: 7.4%)
[in-text-ad]

New York: Delaware County
> 2010-2020 population change: -8.4% (47,962 to 43,938)
> 2010-2020 population change, New York: -0.2% (19.4 million to 19.3 million)
> 2010-2020 population change due to migration: -2,425
> May 2021 unemployment: 4.4% (state: 7.0%)
[recirclink id=914737]

North Carolina: Northampton County
> 2010-2020 population change: -13.6% (22,104 to 19,088)
> 2010-2020 population change, North Carolina: +11.2% (9.5 million to 10.6 million)
> 2010-2020 population change due to migration: -2,090
> May 2021 unemployment: 5.5% (state: 4.5%)

North Dakota: Walsh County
> 2010-2020 population change: -6.2% (11,126 to 10,437)
> 2010-2020 population change, North Dakota: +13.8% (672,575 to 765,309)
> 2010-2020 population change due to migration: -621
> May 2021 unemployment: 4.6% (state: 3.5%)
[in-text-ad-2]

Ohio: Monroe County
> 2010-2020 population change: -7.1% (14,631 to 13,586)
> 2010-2020 population change, Ohio: +1.4% (11.5 million to 11.7 million)
> 2010-2020 population change due to migration: -689
> May 2021 unemployment: 7.0% (state: 5.0%)

Oklahoma: Blaine County
> 2010-2020 population change: -20.9% (11,943 to 9,447)
> 2010-2020 population change, Oklahoma: +6.1% (3.8 million to 4.0 million)
> 2010-2020 population change due to migration: -2,935
> May 2021 unemployment: 2.7% (state: 3.4%)
[in-text-ad]

Oregon: Malheur County
> 2010-2020 population change: -1.1% (31,316 to 30,983)
> 2010-2020 population change, Oregon: +10.7% (3.8 million to 4.2 million)
> 2010-2020 population change due to migration: -1,590
> May 2021 unemployment: 4.3% (state: 5.3%)
[recirclink id=916521]

Pennsylvania: Cambria County
> 2010-2020 population change: -10.5% (143,693 to 128,672)
> 2010-2020 population change, Pennsylvania: +0.6% (12.7 million to 12.8 million)
> 2010-2020 population change due to migration: -9,554
> May 2021 unemployment: 6.3% (state: 5.7%)

Rhode Island: Bristol County
> 2010-2020 population change: -3.0% (49,842 to 48,350)
> 2010-2020 population change, Rhode Island: +0.4% (1.1 million to 1.1 million)
> 2010-2020 population change due to migration: +345
> May 2021 unemployment: 4.1% (state: 5.5%)
[in-text-ad-2]

South Carolina: Allendale County
> 2010-2020 population change: -20.0% (10,419 to 8,331)
> 2010-2020 population change, South Carolina: +12.8% (4.6 million to 5.2 million)
> 2010-2020 population change due to migration: -1,823
> May 2021 unemployment: 6.7% (state: 3.6%)

South Dakota: Yankton County
> 2010-2020 population change: +1.4% (22,438 to 22,742)
> 2010-2020 population change, South Dakota: +9.6% (814,198 to 892,717)
> 2010-2020 population change due to migration: -44
> May 2021 unemployment: 2.6% (state: 2.9%)
[in-text-ad]

Tennessee: Haywood County
> 2010-2020 population change: -9.6% (18,805 to 17,002)
> 2010-2020 population change, Tennessee: +8.5% (6.3 million to 6.9 million)
> 2010-2020 population change due to migration: -1,863
> May 2021 unemployment: 6.3% (state: 4.5%)
[recirclink id=916394]

Texas: Hale County
> 2010-2020 population change: -9.5% (36,207 to 32,754)
> 2010-2020 population change, Texas: +16.8% (25.1 million to 29.4 million)
> 2010-2020 population change due to migration: -5,285
> May 2021 unemployment: 6.4% (state: 5.9%)

Utah: Emery County
> 2010-2020 population change: -7.6% (10,976 to 10,147)
> 2010-2020 population change, Utah: +17.6% (2.8 million to 3.2 million)
> 2010-2020 population change due to migration: -1,331
> May 2021 unemployment: 3.8% (state: 2.7%)
[in-text-ad-2]

Vermont: Rutland County
> 2010-2020 population change: -6.3% (61,659 to 57,764)
> 2010-2020 population change, Vermont: -0.4% (625,727 to 623,347)
> 2010-2020 population change due to migration: -2,175
> May 2021 unemployment: 1.8% (state: 2.6%)

Virginia: Buchanan County
> 2010-2020 population change: -14.5% (24,109 to 20,613)
> 2010-2020 population change, Virginia: +7.4% (8.0 million to 8.6 million)
> 2010-2020 population change due to migration: -2,510
> May 2021 unemployment: 6.8% (state: 4.1%)
[in-text-ad]

Washington: Yakima County
> 2010-2020 population change: +3.6% (243,240 to 251,879)
> 2010-2020 population change, Washington: +14.4% (6.7 million to 7.7 million)
> 2010-2020 population change due to migration: -11,825
> May 2021 unemployment: 6.6% (state: 5.0%)
[recirclink id=914737]

West Virginia: McDowell County
> 2010-2020 population change: -23.5% (22,108 to 16,916)
> 2010-2020 population change, West Virginia: -3.7% (1.9 million to 1.8 million)
> 2010-2020 population change due to migration: -3,974
> May 2021 unemployment: 8.4% (state: 5.0%)
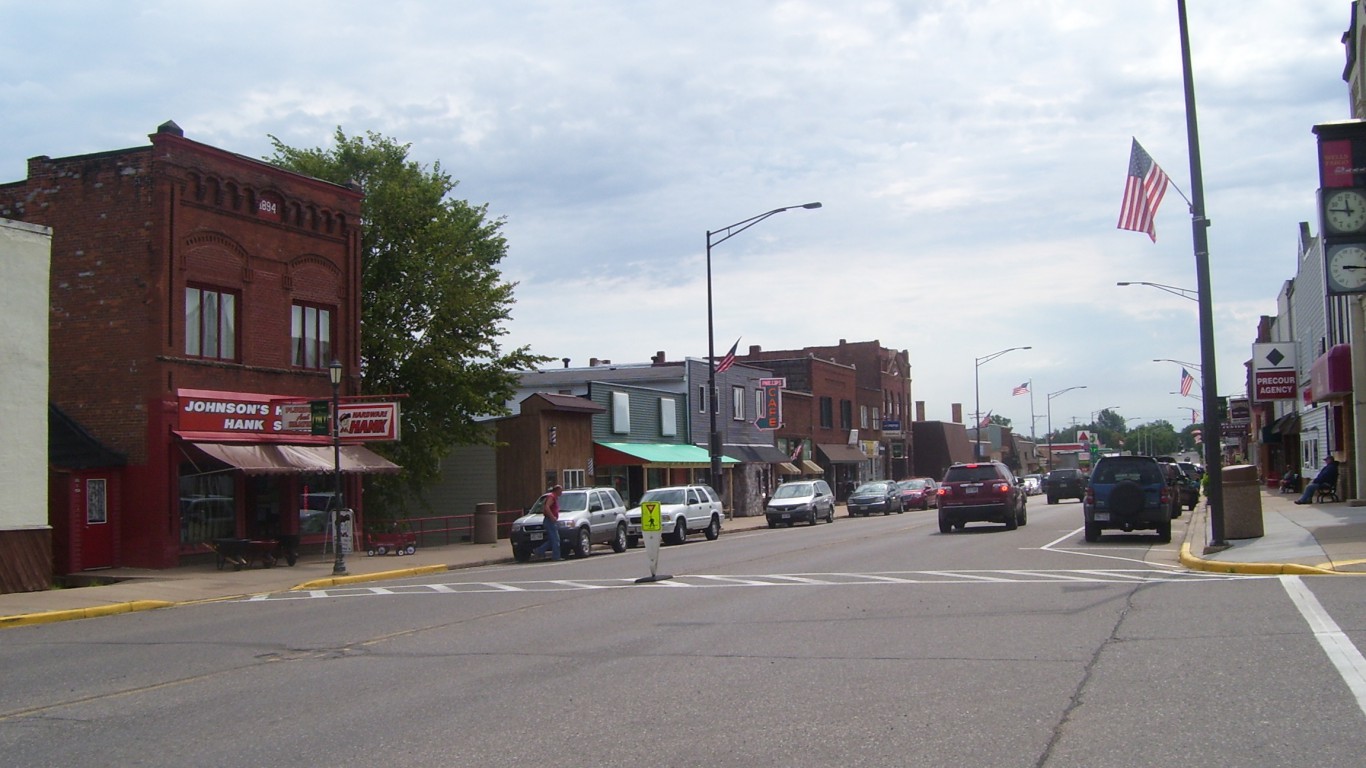
Wisconsin: Price County
> 2010-2020 population change: -6.5% (14,159 to 13,245)
> 2010-2020 population change, Wisconsin: +2.6% (5.7 million to 5.8 million)
> 2010-2020 population change due to migration: -186
> May 2021 unemployment: 4.6% (state: 4.0%)
[in-text-ad-2]

Wyoming: Carbon County
> 2010-2020 population change: -7.4% (15,884 to 14,711)
> 2010-2020 population change, Wyoming: +3.3% (563,775 to 582,328)
> 2010-2020 population change due to migration: -1,840
> May 2021 unemployment: 4.3% (state: 5.4%)
Methodology
To determine the fastest shrinking county in every state, 24/7 Wall St. reviewed data on population from the U.S. Census Bureau’s Population and Housing Unit Estimates Program. Counties were ranked based on the total population change from 2010 to 2020. Only counties with at least 10,000 residents in 2010 were considered. Data on population change due to natural growth and net migration also came from the Census Bureau PEP program. Data on median household income and poverty rate came from the Census Bureau’s 2019 American Community Survey and are five-year estimates. Data on unemployment for May 2021 came from the Bureau of Labor Statistics and are not seasonally adjusted.
Contact [email protected] for any questions or corrections.