
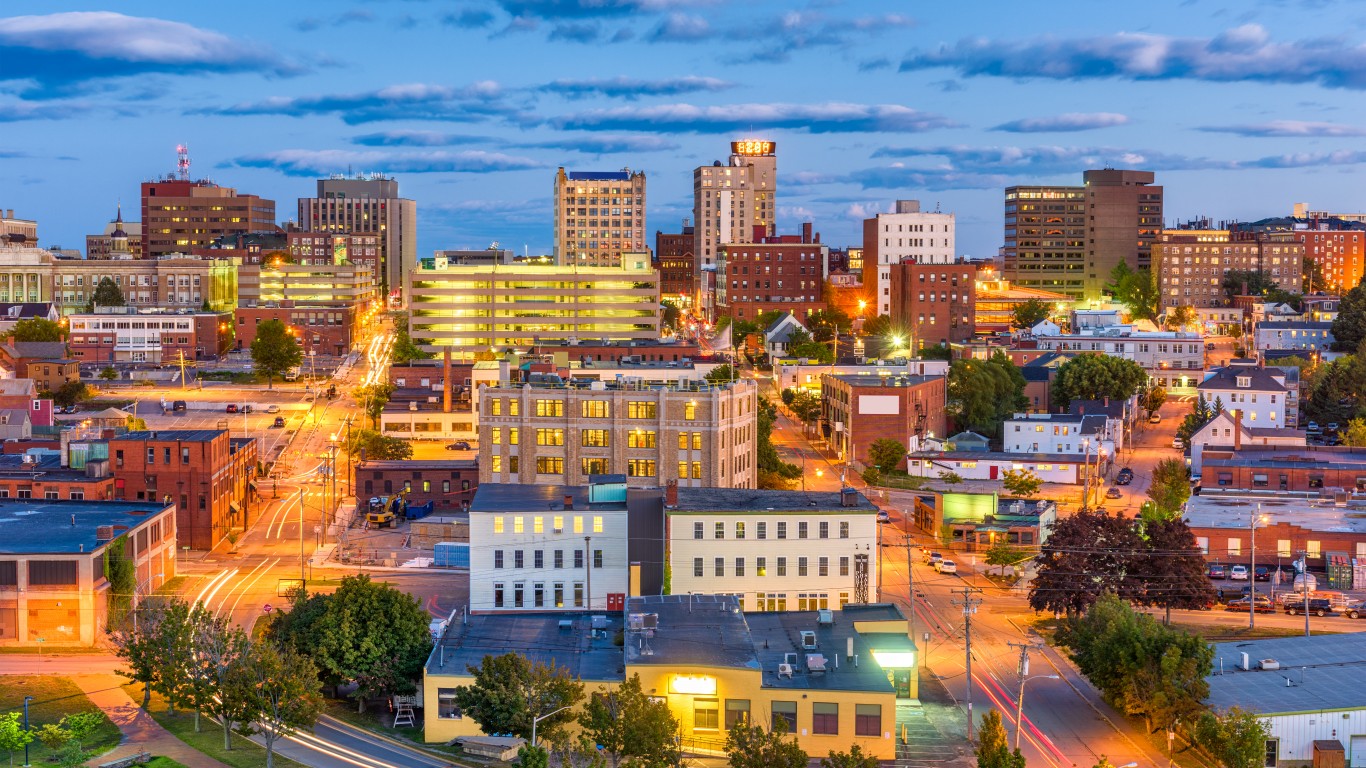
The average cost of a college education in the United States is $35,720 a year — three times higher than it was two decades ago. While rising tuition costs are discouraging many Americans from enrolling, a college education is an investment that can broaden access to career opportunities, improve job security, and increase earning potential.
Nationwide, an estimated 32.1% of American adults 25 and older have a bachelor’s degree or higher. Educational attainment rates vary considerably across the country, however, and in every state, there is at least one city where the share of adults with a bachelor’s degree is higher than the national average.
Using education data from the U.S. Census Bureau, 24/7 Wall St. identified the most educated city in every state. It is important to note that Burlington is the only city in Vermont with sufficient data and ranks as the most educated city in the state by default only.
According to the Bureau of Labor Statistics, the unemployment rate among adults with a four-year college education was 5.5% in 2020. Meanwhile, the jobless rate among those with no more than a high school diploma was 9.0%. In all but eight cities on this list, the five-year average unemployment rate is lower than the comparable jobless rate across the state as a whole.
In addition to being better protected from unemployment, Americans with a bachelor’s degree also tend to have higher incomes. The average weekly wage for a college-educated worker in the United States is about 67% higher than it is for those with no more than a high school diploma — and in cities with well-educated populations, incomes also tend to be higher than average. In the vast majority of cities on this list, the typical household earns more in a year than the statewide median household income.
Click here to see the most educated city in every state
Click here to see our detailed methodology
Alabama: Vestavia Hills
> Adults with at least a bachelor’s degree: 69.3% (Alabama: 25.5%)
> Median household income: $109,485 (Alabama: $50,536)
> Estimated unemployment rate 2015-2019, all workers: 1.9% (Alabama: 4.8%)
> Estimated unemployment rate 2015-2019, adults with at least a bachelor’s degree: 1.3% (Alabama: 2.1%)
[in-text-ad]

Alaska: Juneau
> Adults with at least a bachelor’s degree: 38.4% (Alaska: 29.6%)
> Median household income: $88,390 (Alaska: $77,640)
> Estimated unemployment rate 2015-2019, all workers: 4.1% (Alaska: 5.9%)
> Estimated unemployment rate 2015-2019, adults with at least a bachelor’s degree: 1.4% (Alaska: 2.2%)
[recirclink id=899095]

Arizona: Catalina Foothills
> Adults with at least a bachelor’s degree: 67.8% (Arizona: 29.5%)
> Median household income: $92,929 (Arizona: $58,945)
> Estimated unemployment rate 2015-2019, all workers: 3.7% (Arizona: 4.7%)
> Estimated unemployment rate 2015-2019, adults with at least a bachelor’s degree: 2.8% (Arizona: 2.7%)
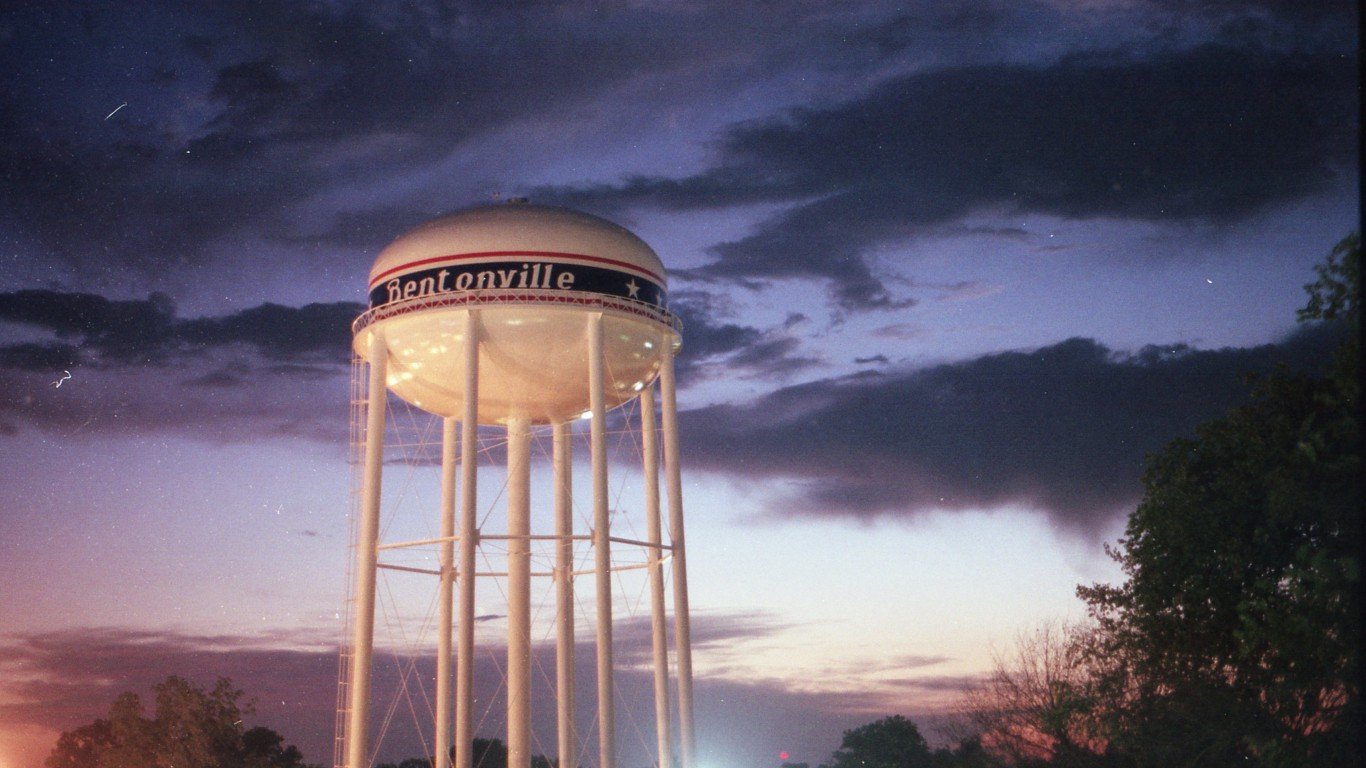
Arkansas: Bentonville
> Adults with at least a bachelor’s degree: 50.2% (Arkansas: 23.0%)
> Median household income: $80,392 (Arkansas: $47,597)
> Estimated unemployment rate 2015-2019, all workers: 1.9% (Arkansas: 4.0%)
> Estimated unemployment rate 2015-2019, adults with at least a bachelor’s degree: 1.7% (Arkansas: 1.8%)
[in-text-ad-2]
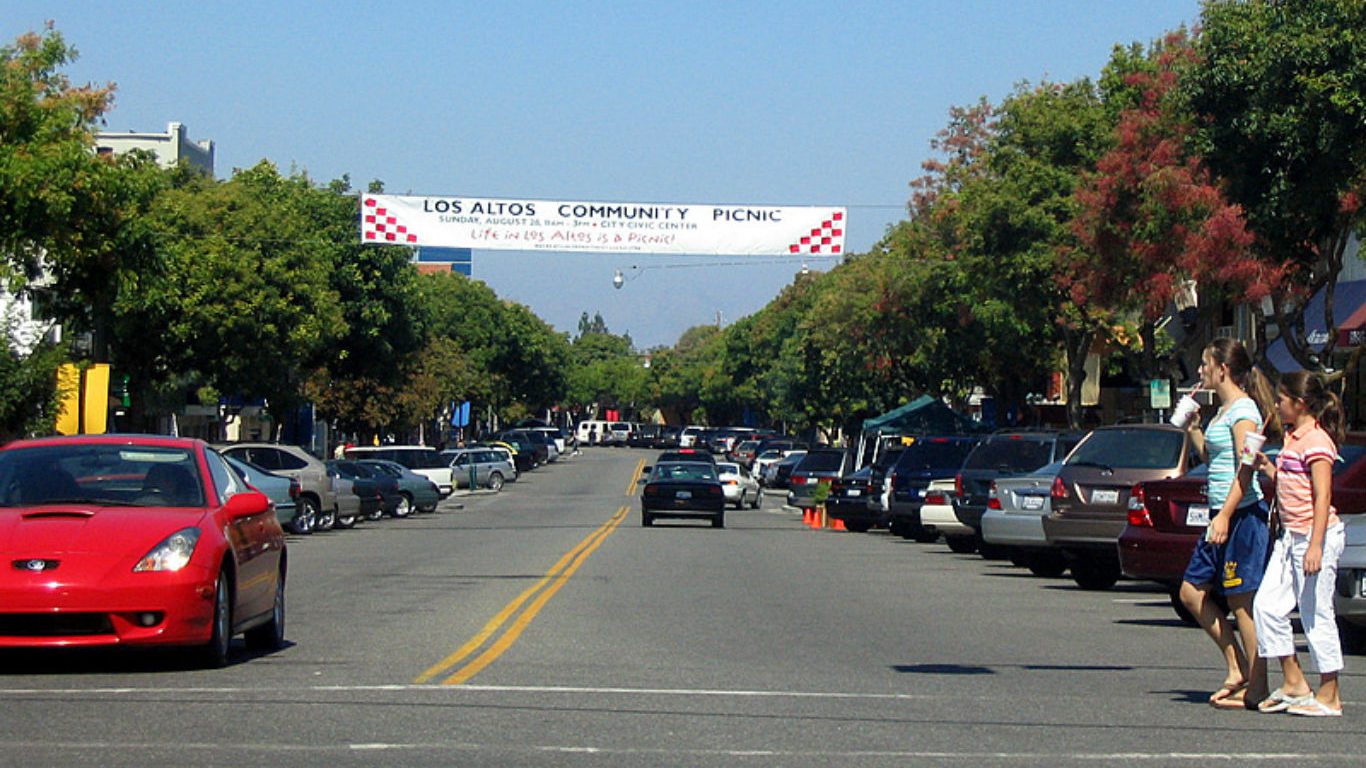
California: Los Altos
> Adults with at least a bachelor’s degree: 84.2% (California: 33.9%)
> Median household income: $235,278 (California: $75,235)
> Estimated unemployment rate 2015-2019, all workers: 3.2% (California: 5.0%)
> Estimated unemployment rate 2015-2019, adults with at least a bachelor’s degree: 3.5% (California: 3.4%)
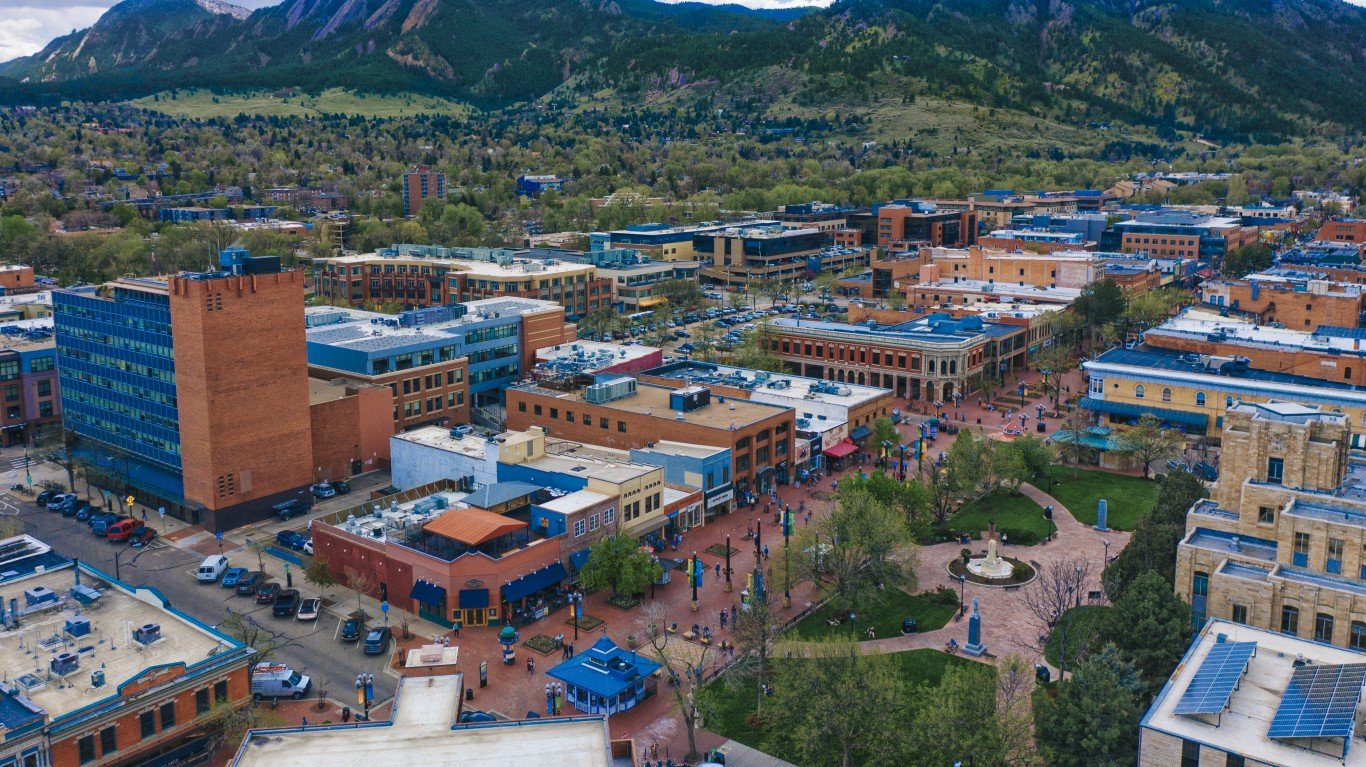
Colorado: Boulder
> Adults with at least a bachelor’s degree: 76.0% (Colorado: 40.9%)
> Median household income: $69,520 (Colorado: $72,331)
> Estimated unemployment rate 2015-2019, all workers: 3.7% (Colorado: 3.6%)
> Estimated unemployment rate 2015-2019, adults with at least a bachelor’s degree: 3.2% (Colorado: 2.5%)
[in-text-ad]
Connecticut: Westport
> Adults with at least a bachelor’s degree: 78.0% (Connecticut: 39.3%)
> Median household income: $206,466 (Connecticut: $78,444)
> Estimated unemployment rate 2015-2019, all workers: 3.3% (Connecticut: 5.0%)
> Estimated unemployment rate 2015-2019, adults with at least a bachelor’s degree: 2.5% (Connecticut: 2.9%)
[recirclink id=887395]
Delaware: Newark
> Adults with at least a bachelor’s degree: 53.2% (Delaware: 32.0%)
> Median household income: $58,434 (Delaware: $68,287)
> Estimated unemployment rate 2015-2019, all workers: 2.5% (Delaware: 4.5%)
> Estimated unemployment rate 2015-2019, adults with at least a bachelor’s degree: 3.3% (Delaware: 2.7%)

Florida: Coral Gables
> Adults with at least a bachelor’s degree: 66.7% (Florida: 29.9%)
> Median household income: $100,843 (Florida: $55,660)
> Estimated unemployment rate 2015-2019, all workers: 1.9% (Florida: 4.7%)
> Estimated unemployment rate 2015-2019, adults with at least a bachelor’s degree: 1.3% (Florida: 2.9%)
[in-text-ad-2]
Georgia: Dunwoody
> Adults with at least a bachelor’s degree: 72.2% (Georgia: 31.3%)
> Median household income: $96,057 (Georgia: $58,700)
> Estimated unemployment rate 2015-2019, all workers: 1.9% (Georgia: 4.5%)
> Estimated unemployment rate 2015-2019, adults with at least a bachelor’s degree: 1.1% (Georgia: 2.6%)
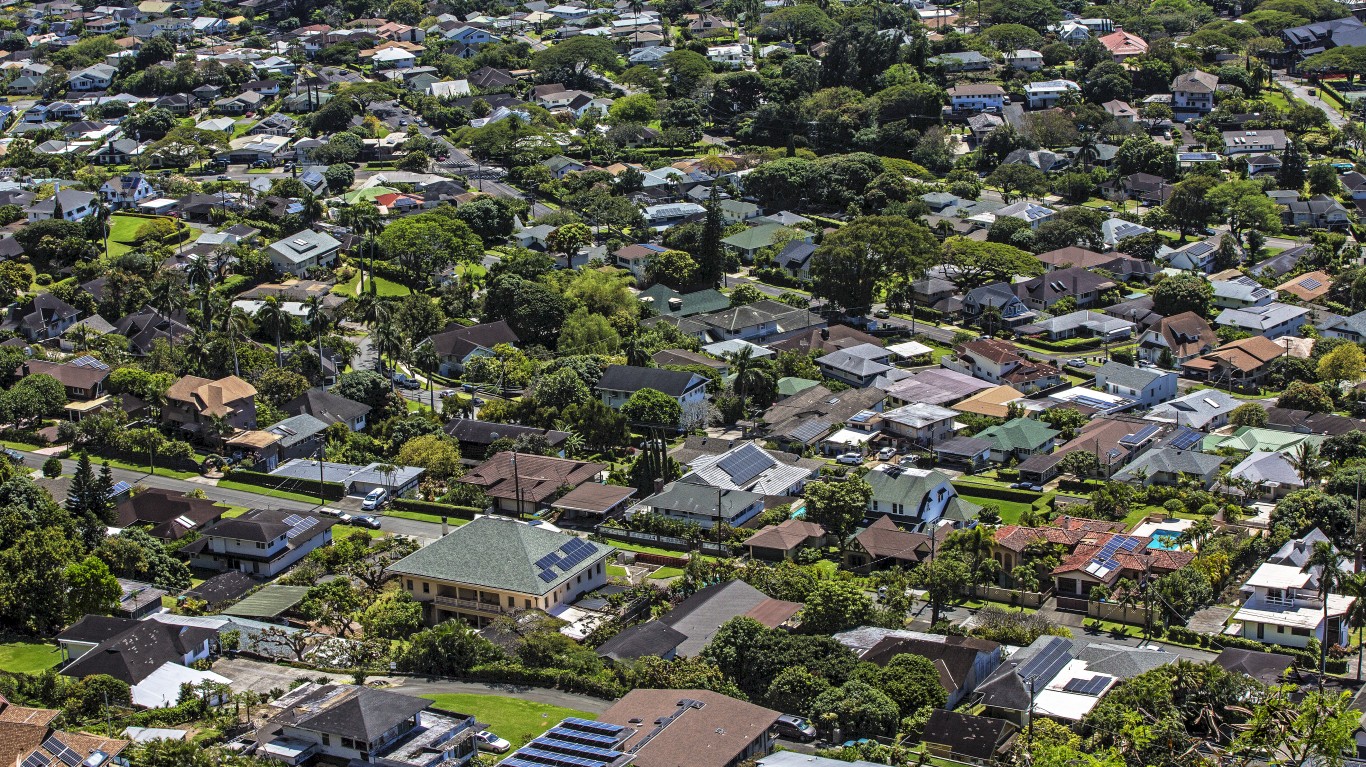
Hawaii: East Honolulu
> Adults with at least a bachelor’s degree: 58.3% (Hawaii: 33.0%)
> Median household income: $133,165 (Hawaii: $81,275)
> Estimated unemployment rate 2015-2019, all workers: 1.8% (Hawaii: 3.5%)
> Estimated unemployment rate 2015-2019, adults with at least a bachelor’s degree: 1.3% (Hawaii: 2.0%)
[in-text-ad]
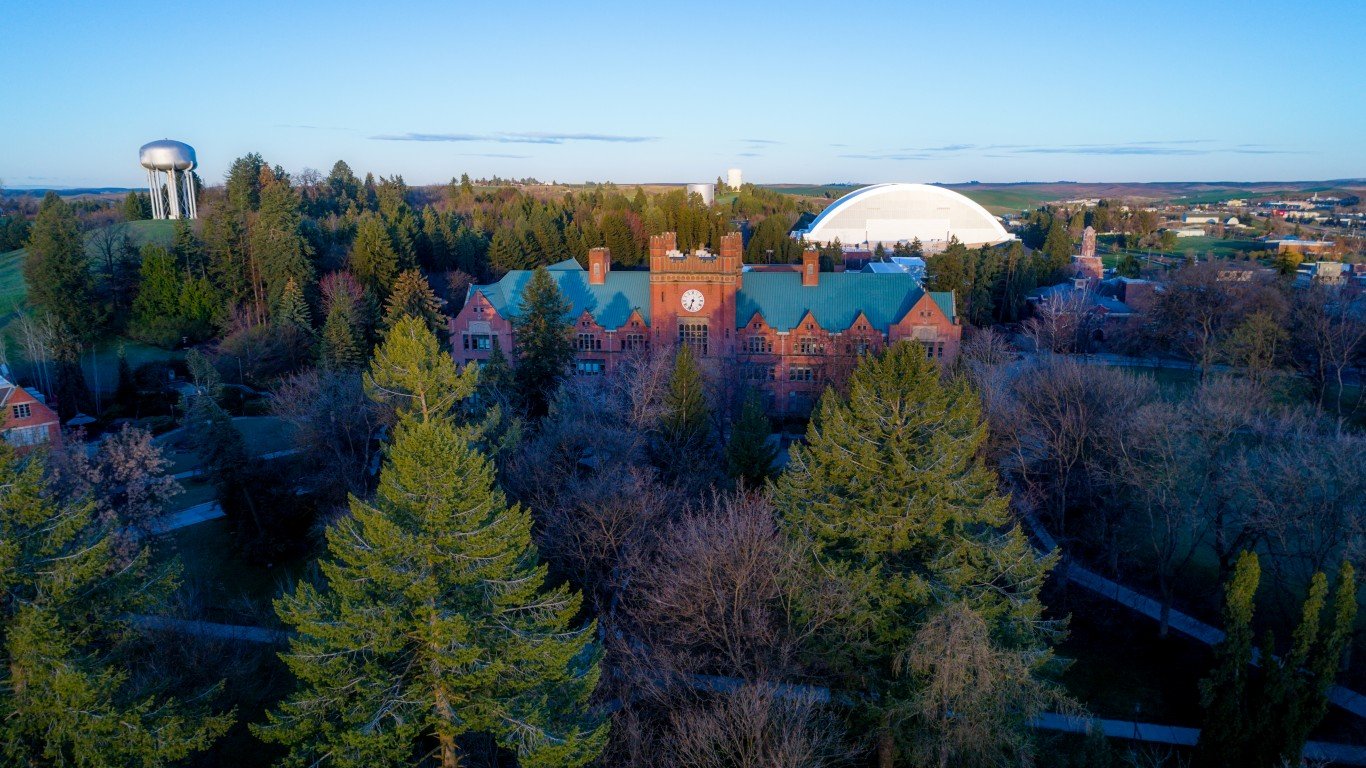
Idaho: Moscow
> Adults with at least a bachelor’s degree: 55.8% (Idaho: 27.6%)
> Median household income: $41,896 (Idaho: $55,785)
> Estimated unemployment rate 2015-2019, all workers: 1.9% (Idaho: 3.2%)
> Estimated unemployment rate 2015-2019, adults with at least a bachelor’s degree: 2.2% (Idaho: 2.1%)
[recirclink id=905326]

Illinois: Wilmette
> Adults with at least a bachelor’s degree: 83.2% (Illinois: 34.7%)
> Median household income: $164,681 (Illinois: $65,886)
> Estimated unemployment rate 2015-2019, all workers: 3.9% (Illinois: 4.9%)
> Estimated unemployment rate 2015-2019, adults with at least a bachelor’s degree: 3.8% (Illinois: 2.7%)
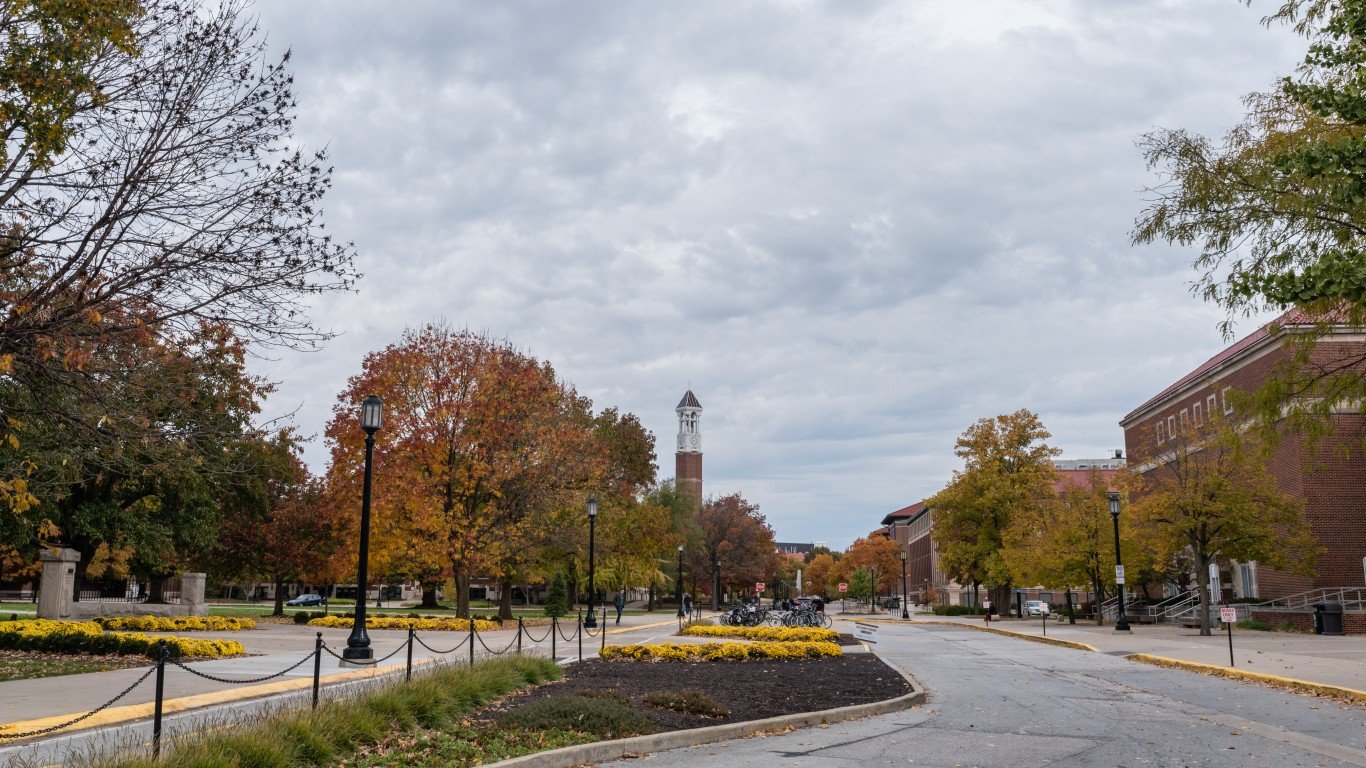
Indiana: West Lafayette
> Adults with at least a bachelor’s degree: 71.5% (Indiana: 26.5%)
> Median household income: $34,650 (Indiana: $56,303)
> Estimated unemployment rate 2015-2019, all workers: 2.4% (Indiana: 3.8%)
> Estimated unemployment rate 2015-2019, adults with at least a bachelor’s degree: 1.3% (Indiana: 1.9%)
[in-text-ad-2]
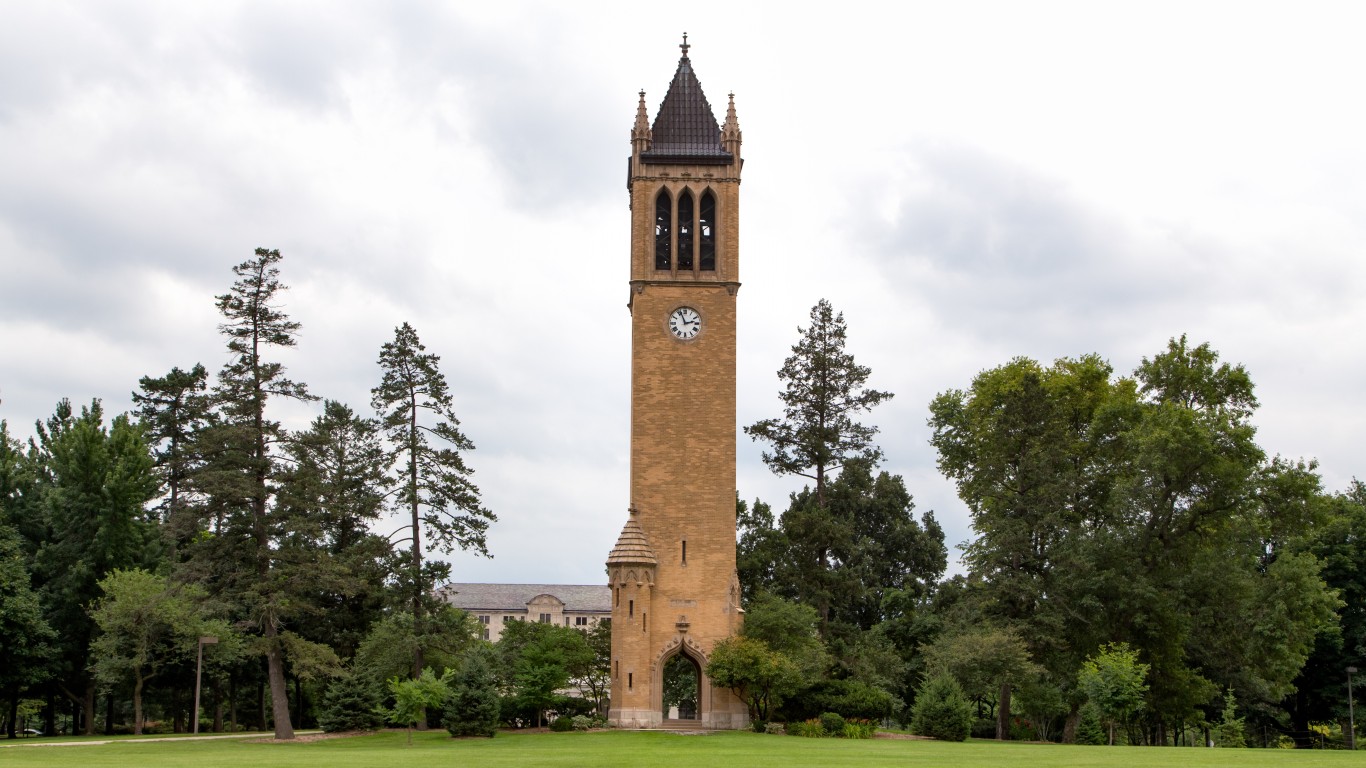
Iowa: Ames
> Adults with at least a bachelor’s degree: 62.7% (Iowa: 28.6%)
> Median household income: $48,105 (Iowa: $60,523)
> Estimated unemployment rate 2015-2019, all workers: 2.4% (Iowa: 2.9%)
> Estimated unemployment rate 2015-2019, adults with at least a bachelor’s degree: 2.7% (Iowa: 1.4%)

Kansas: Leawood
> Adults with at least a bachelor’s degree: 76.9% (Kansas: 33.4%)
> Median household income: $157,515 (Kansas: $59,597)
> Estimated unemployment rate 2015-2019, all workers: 1.8% (Kansas: 3.1%)
> Estimated unemployment rate 2015-2019, adults with at least a bachelor’s degree: 1.5% (Kansas: 1.7%)
[in-text-ad]
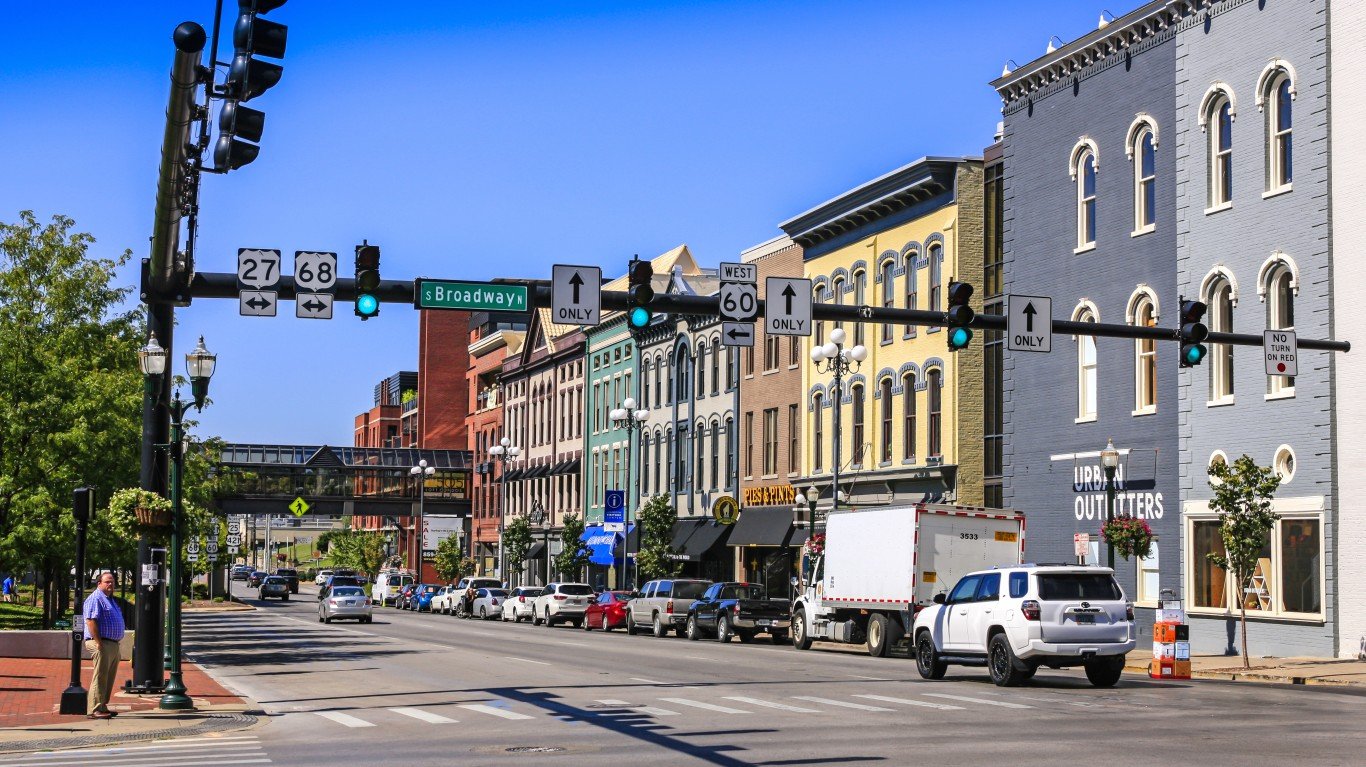
Kentucky: Lexington-Fayette
> Adults with at least a bachelor’s degree: 43.6% (Kentucky: 24.2%)
> Median household income: $57,291 (Kentucky: $50,589)
> Estimated unemployment rate 2015-2019, all workers: 4.0% (Kentucky: 4.5%)
> Estimated unemployment rate 2015-2019, adults with at least a bachelor’s degree: 2.5% (Kentucky: 2.1%)
[recirclink id=906220]

Louisiana: Lafayette
> Adults with at least a bachelor’s degree: 38.2% (Louisiana: 24.1%)
> Median household income: $51,264 (Louisiana: $49,469)
> Estimated unemployment rate 2015-2019, all workers: 4.3% (Louisiana: 5.4%)
> Estimated unemployment rate 2015-2019, adults with at least a bachelor’s degree: 1.8% (Louisiana: 2.4%)
Maine: Portland
> Adults with at least a bachelor’s degree: 52.6% (Maine: 31.8%)
> Median household income: $60,467 (Maine: $57,918)
> Estimated unemployment rate 2015-2019, all workers: 2.5% (Maine: 3.3%)
> Estimated unemployment rate 2015-2019, adults with at least a bachelor’s degree: 1.8% (Maine: 1.6%)
[in-text-ad-2]
Maryland: Bethesda
> Adults with at least a bachelor’s degree: 85.9% (Maryland: 40.2%)
> Median household income: $164,142 (Maryland: $84,805)
> Estimated unemployment rate 2015-2019, all workers: 2.7% (Maryland: 4.1%)
> Estimated unemployment rate 2015-2019, adults with at least a bachelor’s degree: 2.3% (Maryland: 2.4%)
Massachusetts: Lexington
> Adults with at least a bachelor’s degree: 84.7% (Massachusetts: 43.7%)
> Median household income: $186,201 (Massachusetts: $81,215)
> Estimated unemployment rate 2015-2019, all workers: 3.5% (Massachusetts: 4.0%)
> Estimated unemployment rate 2015-2019, adults with at least a bachelor’s degree: 3.8% (Massachusetts: 2.5%)
[in-text-ad]
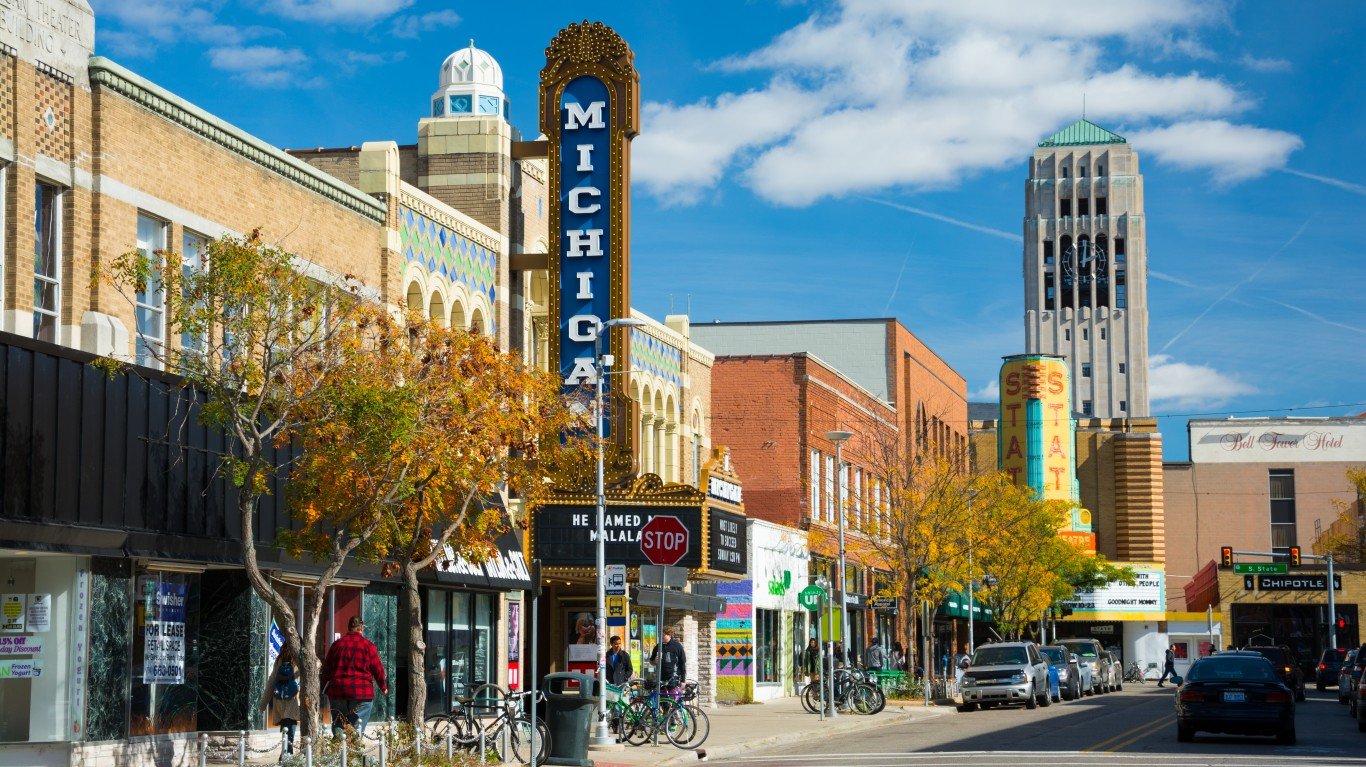
Michigan: Ann Arbor
> Adults with at least a bachelor’s degree: 76.0% (Michigan: 29.1%)
> Median household income: $65,745 (Michigan: $57,144)
> Estimated unemployment rate 2015-2019, all workers: 2.5% (Michigan: 4.8%)
> Estimated unemployment rate 2015-2019, adults with at least a bachelor’s degree: 2.0% (Michigan: 2.3%)
[recirclink id=908660]

Minnesota: Edina
> Adults with at least a bachelor’s degree: 69.8% (Minnesota: 36.1%)
> Median household income: $104,244 (Minnesota: $71,306)
> Estimated unemployment rate 2015-2019, all workers: 2.7% (Minnesota: 3.0%)
> Estimated unemployment rate 2015-2019, adults with at least a bachelor’s degree: 1.9% (Minnesota: 1.7%)
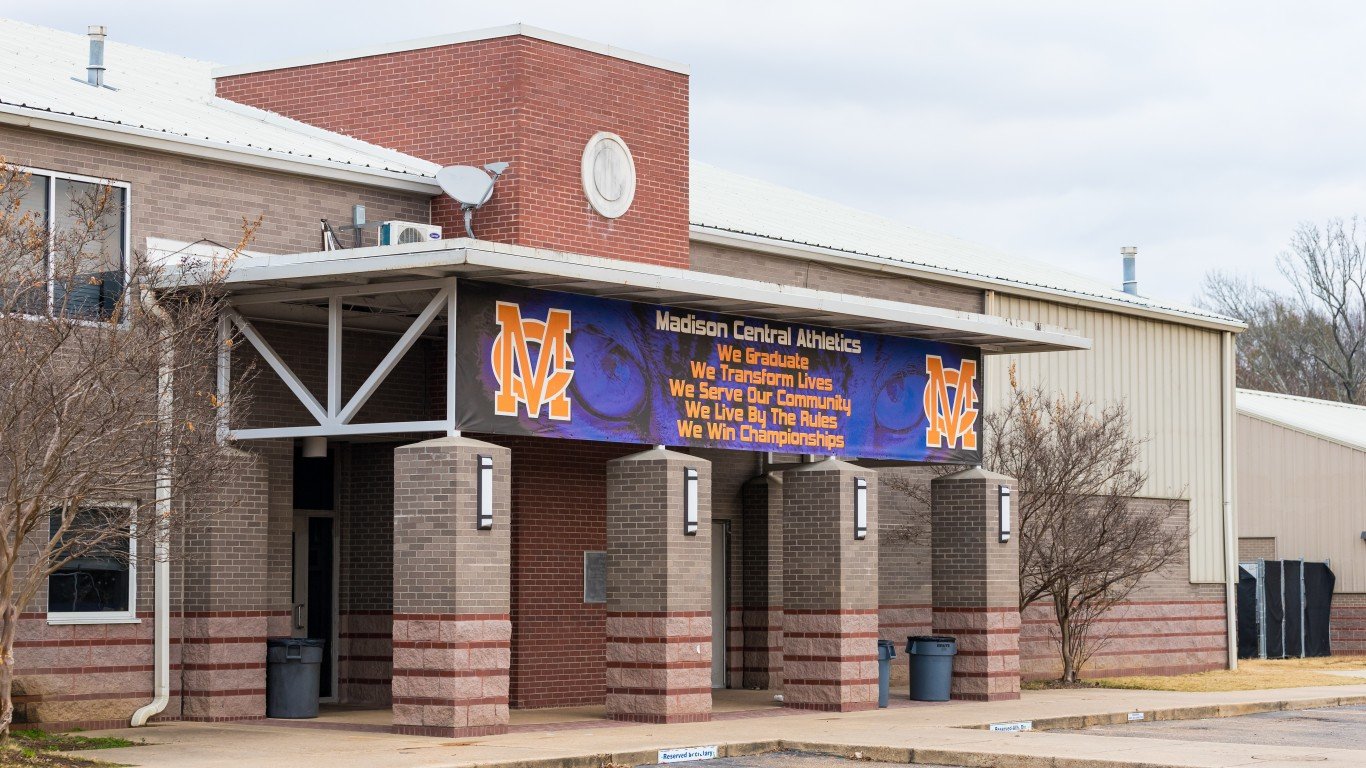
Mississippi: Madison
> Adults with at least a bachelor’s degree: 68.5% (Mississippi: 22.0%)
> Median household income: $114,521 (Mississippi: $45,081)
> Estimated unemployment rate 2015-2019, all workers: 1.6% (Mississippi: 6.1%)
> Estimated unemployment rate 2015-2019, adults with at least a bachelor’s degree: 1.5% (Mississippi: 2.8%)
[in-text-ad-2]

Missouri: Chesterfield
> Adults with at least a bachelor’s degree: 69.2% (Missouri: 29.2%)
> Median household income: $113,315 (Missouri: $55,461)
> Estimated unemployment rate 2015-2019, all workers: 2.1% (Missouri: 3.8%)
> Estimated unemployment rate 2015-2019, adults with at least a bachelor’s degree: 1.9% (Missouri: 1.9%)
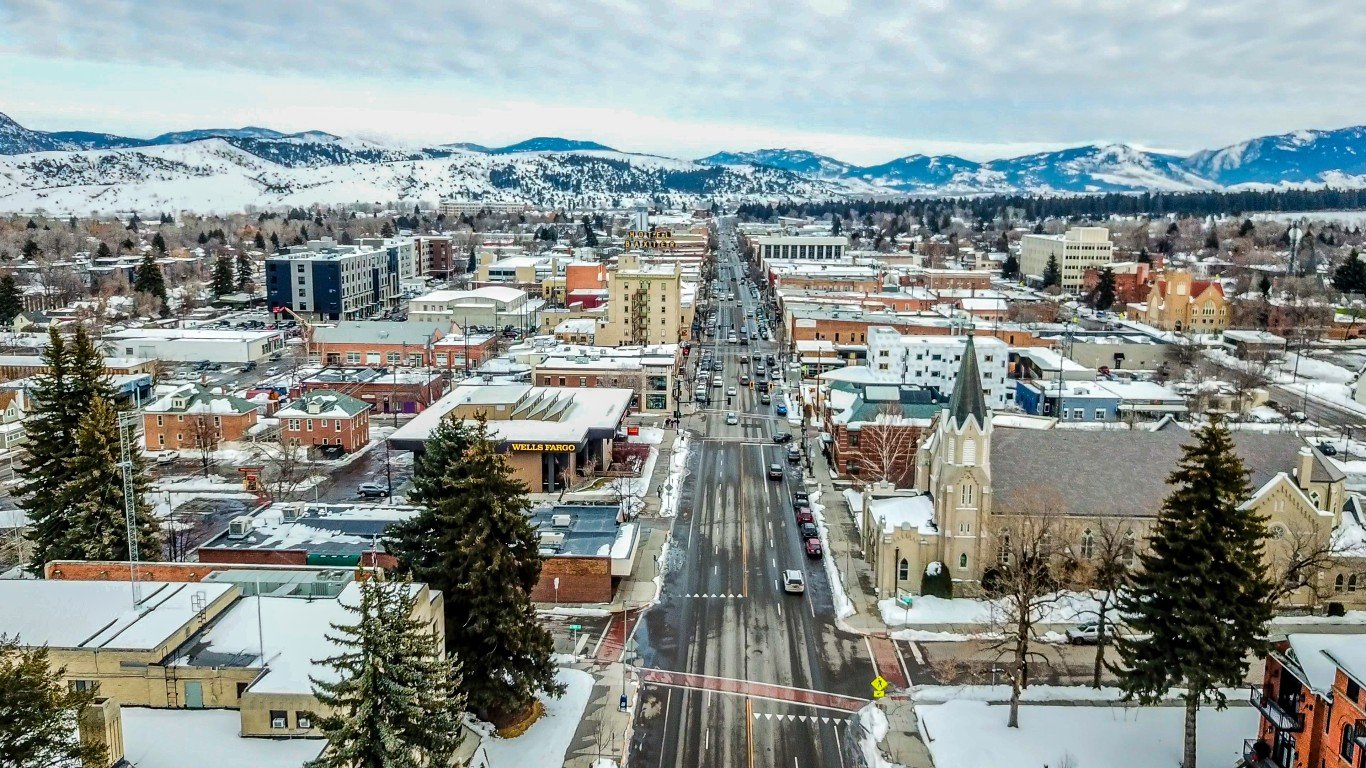
Montana: Bozeman
> Adults with at least a bachelor’s degree: 58.7% (Montana: 32.0%)
> Median household income: $55,569 (Montana: $54,970)
> Estimated unemployment rate 2015-2019, all workers: 2.0% (Montana: 3.3%)
> Estimated unemployment rate 2015-2019, adults with at least a bachelor’s degree: 1.5% (Montana: 2.0%)
[in-text-ad]
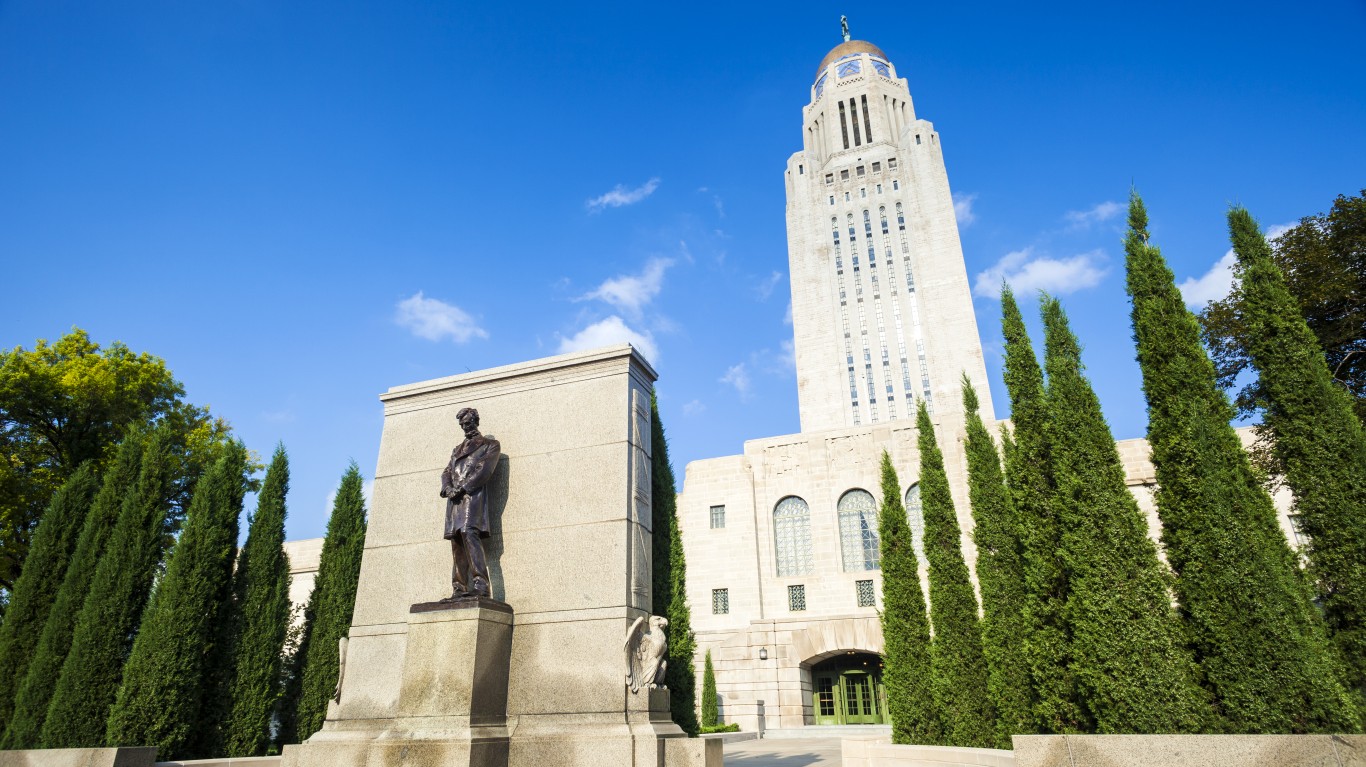
Nebraska: Lincoln
> Adults with at least a bachelor’s degree: 39.6% (Nebraska: 31.9%)
> Median household income: $57,746 (Nebraska: $61,439)
> Estimated unemployment rate 2015-2019, all workers: 2.3% (Nebraska: 2.4%)
> Estimated unemployment rate 2015-2019, adults with at least a bachelor’s degree: 1.4% (Nebraska: 1.4%)
[recirclink id=899095]

Nevada: Summerlin South
> Adults with at least a bachelor’s degree: 48.8% (Nevada: 24.7%)
> Median household income: $93,899 (Nevada: $60,365)
> Estimated unemployment rate 2015-2019, all workers: 3.3% (Nevada: 5.3%)
> Estimated unemployment rate 2015-2019, adults with at least a bachelor’s degree: 2.6% (Nevada: 3.4%)
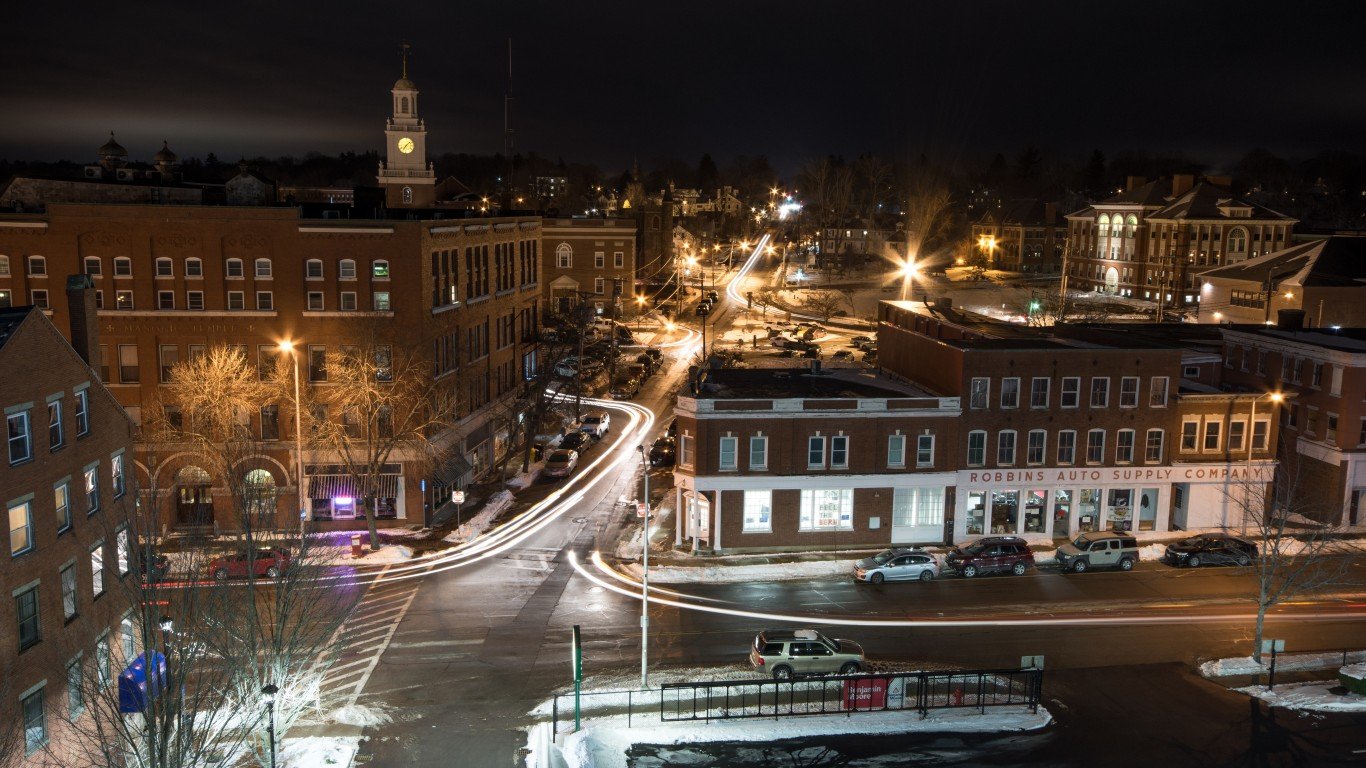
New Hampshire: Dover
> Adults with at least a bachelor’s degree: 46.5% (New Hampshire: 37.0%)
> Median household income: $71,631 (New Hampshire: $76,768)
> Estimated unemployment rate 2015-2019, all workers: 1.6% (New Hampshire: 2.9%)
> Estimated unemployment rate 2015-2019, adults with at least a bachelor’s degree: 1.8% (New Hampshire: 1.9%)
[in-text-ad-2]
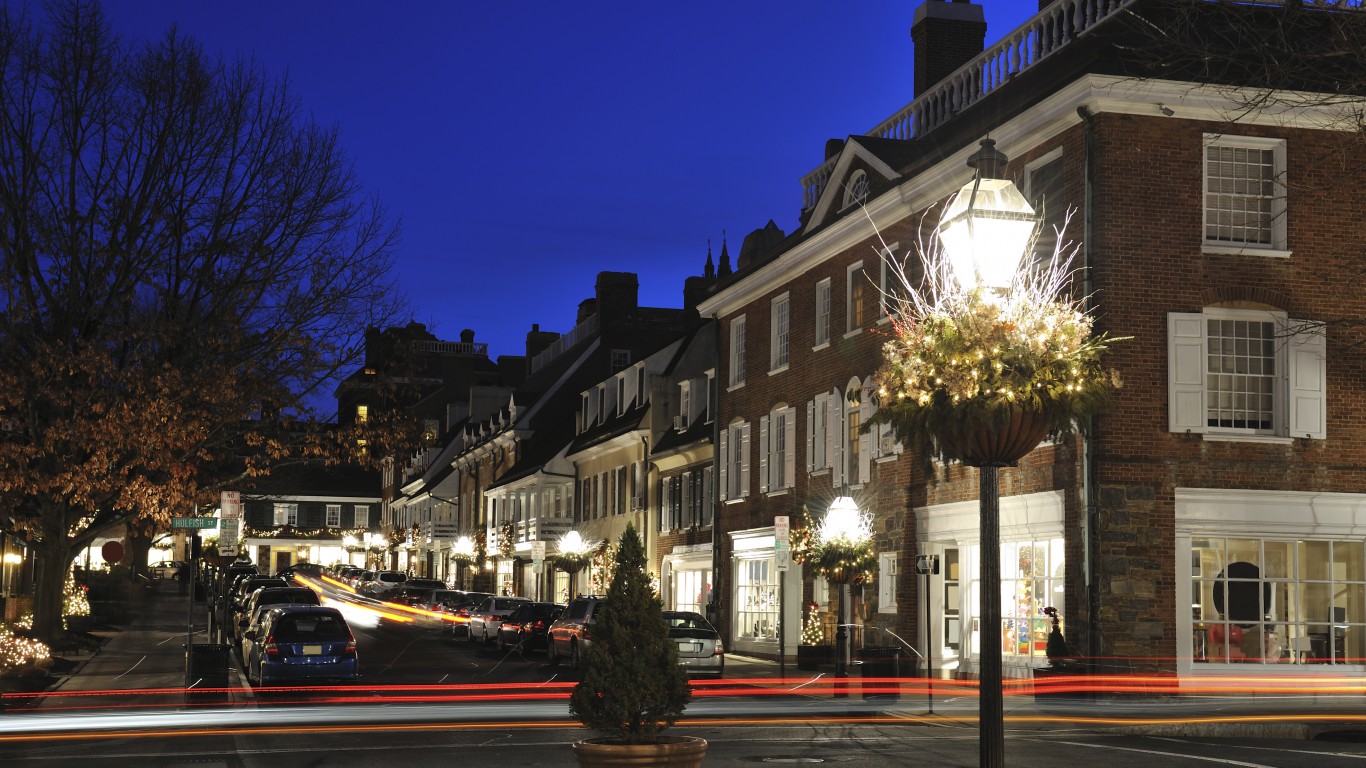
New Jersey: Princeton
> Adults with at least a bachelor’s degree: 81.0% (New Jersey: 39.7%)
> Median household income: $137,672 (New Jersey: $82,545)
> Estimated unemployment rate 2015-2019, all workers: 2.7% (New Jersey: 4.6%)
> Estimated unemployment rate 2015-2019, adults with at least a bachelor’s degree: 2.1% (New Jersey: 3.0%)
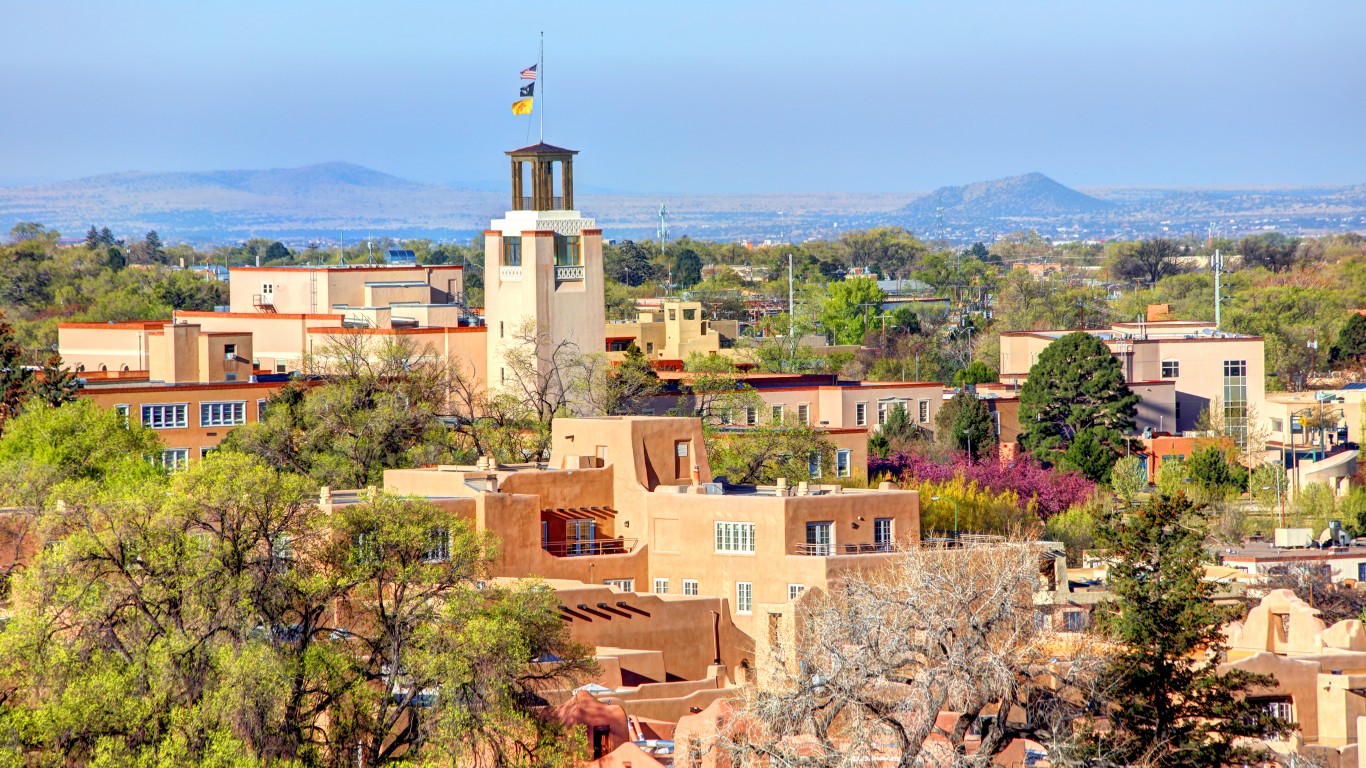
New Mexico: Santa Fe
> Adults with at least a bachelor’s degree: 41.7% (New Mexico: 27.3%)
> Median household income: $57,972 (New Mexico: $49,754)
> Estimated unemployment rate 2015-2019, all workers: 3.6% (New Mexico: 5.7%)
> Estimated unemployment rate 2015-2019, adults with at least a bachelor’s degree: 3.0% (New Mexico: 2.9%)
[in-text-ad]
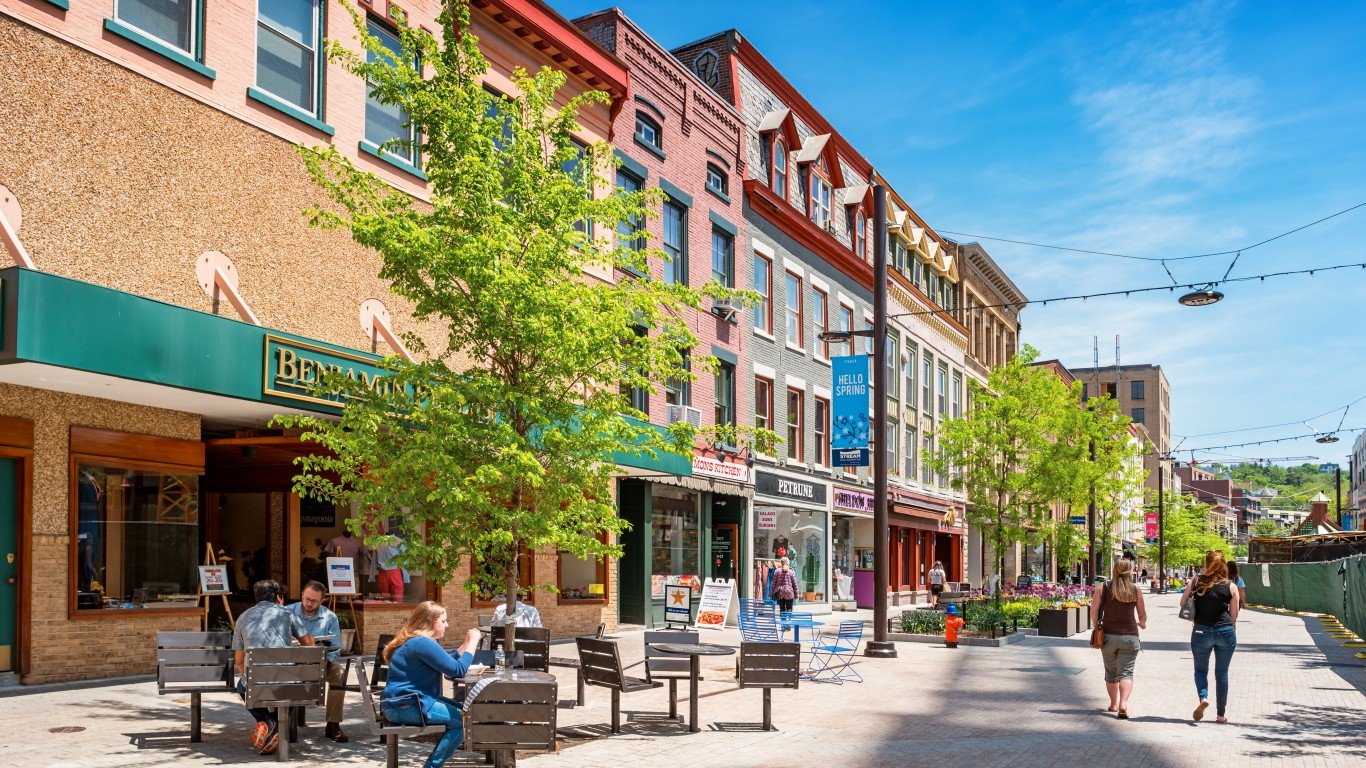
New York: Ithaca
> Adults with at least a bachelor’s degree: 66.9% (New York: 36.6%)
> Median household income: $34,424 (New York: $68,486)
> Estimated unemployment rate 2015-2019, all workers: 2.9% (New York: 4.5%)
> Estimated unemployment rate 2015-2019, adults with at least a bachelor’s degree: 1.9% (New York: 2.9%)
[recirclink id=887395]
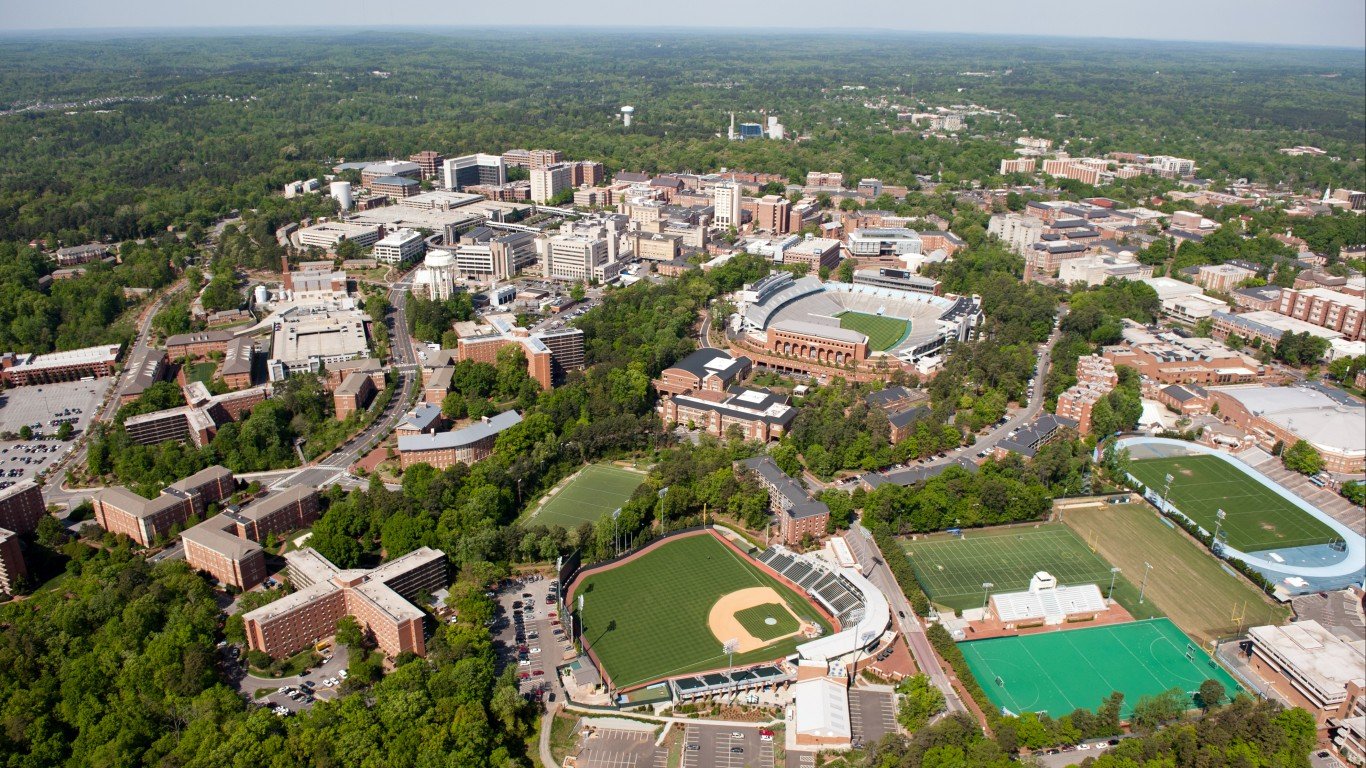
North Carolina: Chapel Hill
> Adults with at least a bachelor’s degree: 76.9% (North Carolina: 31.3%)
> Median household income: $73,614 (North Carolina: $54,602)
> Estimated unemployment rate 2015-2019, all workers: 3.5% (North Carolina: 4.4%)
> Estimated unemployment rate 2015-2019, adults with at least a bachelor’s degree: 2.2% (North Carolina: 2.4%)
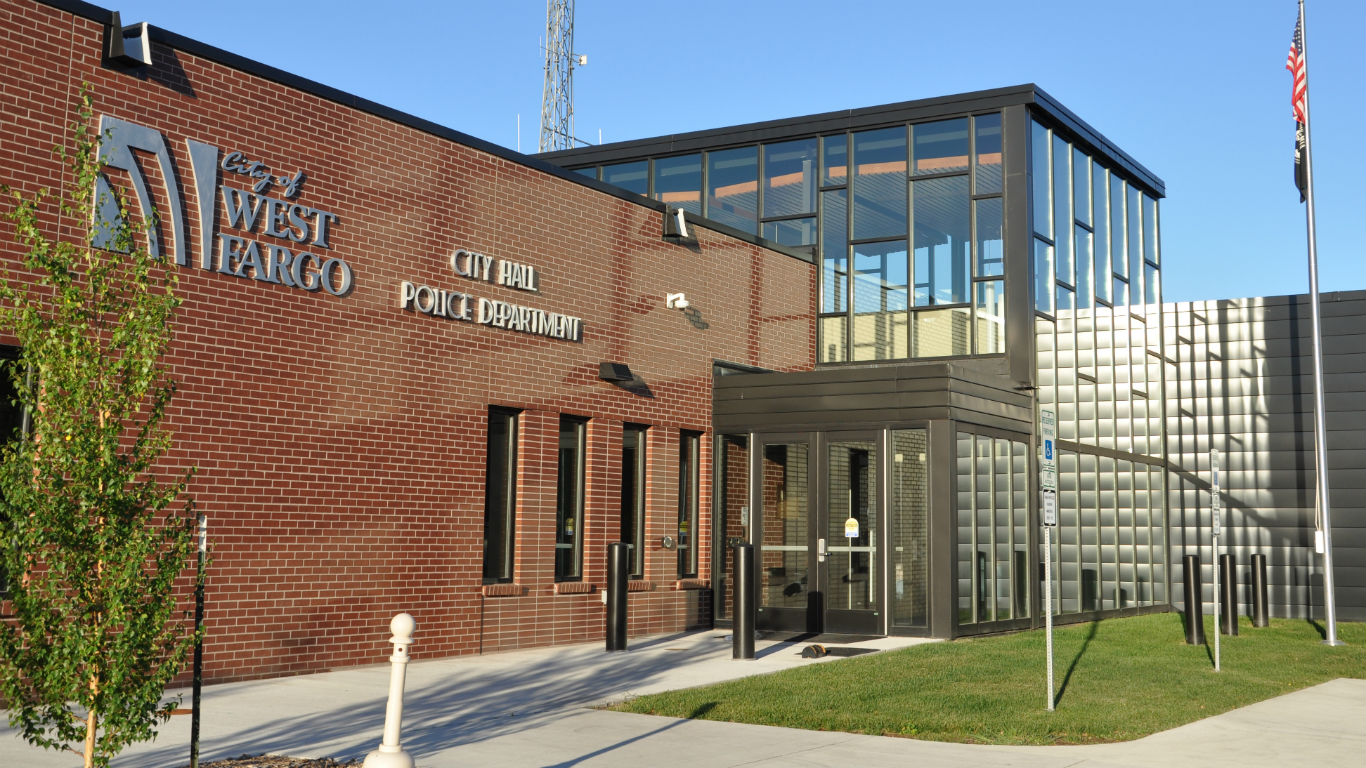
North Dakota: West Fargo
> Adults with at least a bachelor’s degree: 44.2% (North Dakota: 30.0%)
> Median household income: $85,120 (North Dakota: $64,894)
> Estimated unemployment rate 2015-2019, all workers: 1.3% (North Dakota: 2.2%)
> Estimated unemployment rate 2015-2019, adults with at least a bachelor’s degree: 0.3% (North Dakota: 0.9%)
[in-text-ad-2]
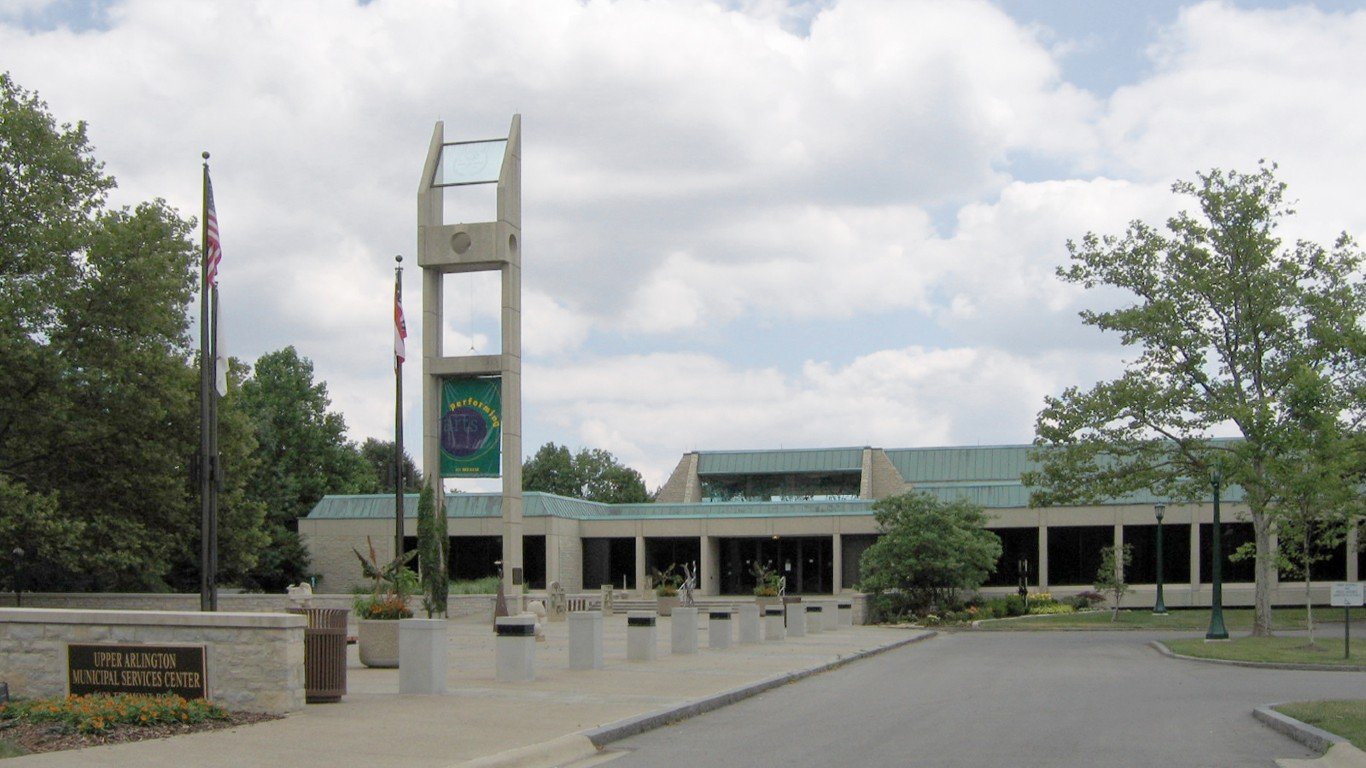
Ohio: Upper Arlington
> Adults with at least a bachelor’s degree: 77.1% (Ohio: 28.3%)
> Median household income: $123,548 (Ohio: $56,602)
> Estimated unemployment rate 2015-2019, all workers: 2.0% (Ohio: 4.3%)
> Estimated unemployment rate 2015-2019, adults with at least a bachelor’s degree: 1.5% (Ohio: 2.0%)
Oklahoma: Edmond
> Adults with at least a bachelor’s degree: 53.4% (Oklahoma: 25.5%)
> Median household income: $81,473 (Oklahoma: $52,919)
> Estimated unemployment rate 2015-2019, all workers: 2.4% (Oklahoma: 4.2%)
> Estimated unemployment rate 2015-2019, adults with at least a bachelor’s degree: 1.5% (Oklahoma: 1.9%)
[in-text-ad]

Oregon: Lake Oswego
> Adults with at least a bachelor’s degree: 71.4% (Oregon: 33.7%)
> Median household income: $108,927 (Oregon: $62,818)
> Estimated unemployment rate 2015-2019, all workers: 2.8% (Oregon: 4.5%)
> Estimated unemployment rate 2015-2019, adults with at least a bachelor’s degree: 2.3% (Oregon: 2.7%)
[recirclink id=905326]

Pennsylvania: State College
> Adults with at least a bachelor’s degree: 70.6% (Pennsylvania: 31.4%)
> Median household income: $34,005 (Pennsylvania: $61,744)
> Estimated unemployment rate 2015-2019, all workers: 3.1% (Pennsylvania: 4.3%)
> Estimated unemployment rate 2015-2019, adults with at least a bachelor’s degree: 1.9% (Pennsylvania: 2.4%)

Rhode Island: Warwick
> Adults with at least a bachelor’s degree: 33.8% (Rhode Island: 34.2%)
> Median household income: $73,757 (Rhode Island: $67,167)
> Estimated unemployment rate 2015-2019, all workers: 3.1% (Rhode Island: 4.4%)
> Estimated unemployment rate 2015-2019, adults with at least a bachelor’s degree: 2.3% (Rhode Island: 2.6%)
[in-text-ad-2]

South Carolina: Mount Pleasant
> Adults with at least a bachelor’s degree: 63.9% (South Carolina: 28.1%)
> Median household income: $103,232 (South Carolina: $53,199)
> Estimated unemployment rate 2015-2019, all workers: 2.1% (South Carolina: 4.7%)
> Estimated unemployment rate 2015-2019, adults with at least a bachelor’s degree: 1.7% (South Carolina: 2.2%)

South Dakota: Sioux Falls
> Adults with at least a bachelor’s degree: 35.2% (South Dakota: 28.8%)
> Median household income: $59,912 (South Dakota: $58,275)
> Estimated unemployment rate 2015-2019, all workers: 2.0% (South Dakota: 2.7%)
> Estimated unemployment rate 2015-2019, adults with at least a bachelor’s degree: 1.0% (South Dakota: 1.0%)
[in-text-ad]
Tennessee: Brentwood
> Adults with at least a bachelor’s degree: 76.1% (Tennessee: 27.3%)
> Median household income: $168,688 (Tennessee: $53,320)
> Estimated unemployment rate 2015-2019, all workers: 2.3% (Tennessee: 4.4%)
> Estimated unemployment rate 2015-2019, adults with at least a bachelor’s degree: 2.4% (Tennessee: 2.2%)
[recirclink id=906220]
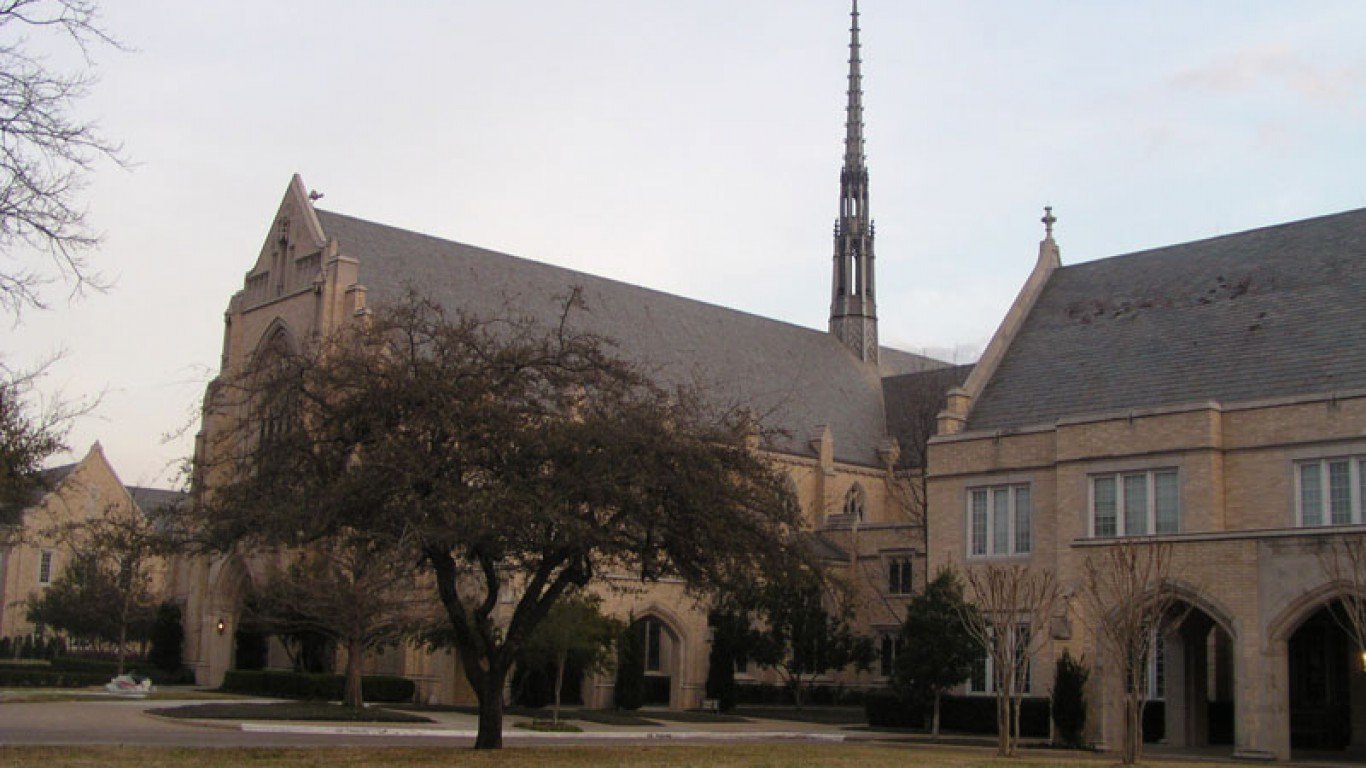
Texas: University Park
> Adults with at least a bachelor’s degree: 87.8% (Texas: 29.9%)
> Median household income: $224,485 (Texas: $61,874)
> Estimated unemployment rate 2015-2019, all workers: 2.3% (Texas: 4.1%)
> Estimated unemployment rate 2015-2019, adults with at least a bachelor’s degree: 2.4% (Texas: 2.7%)
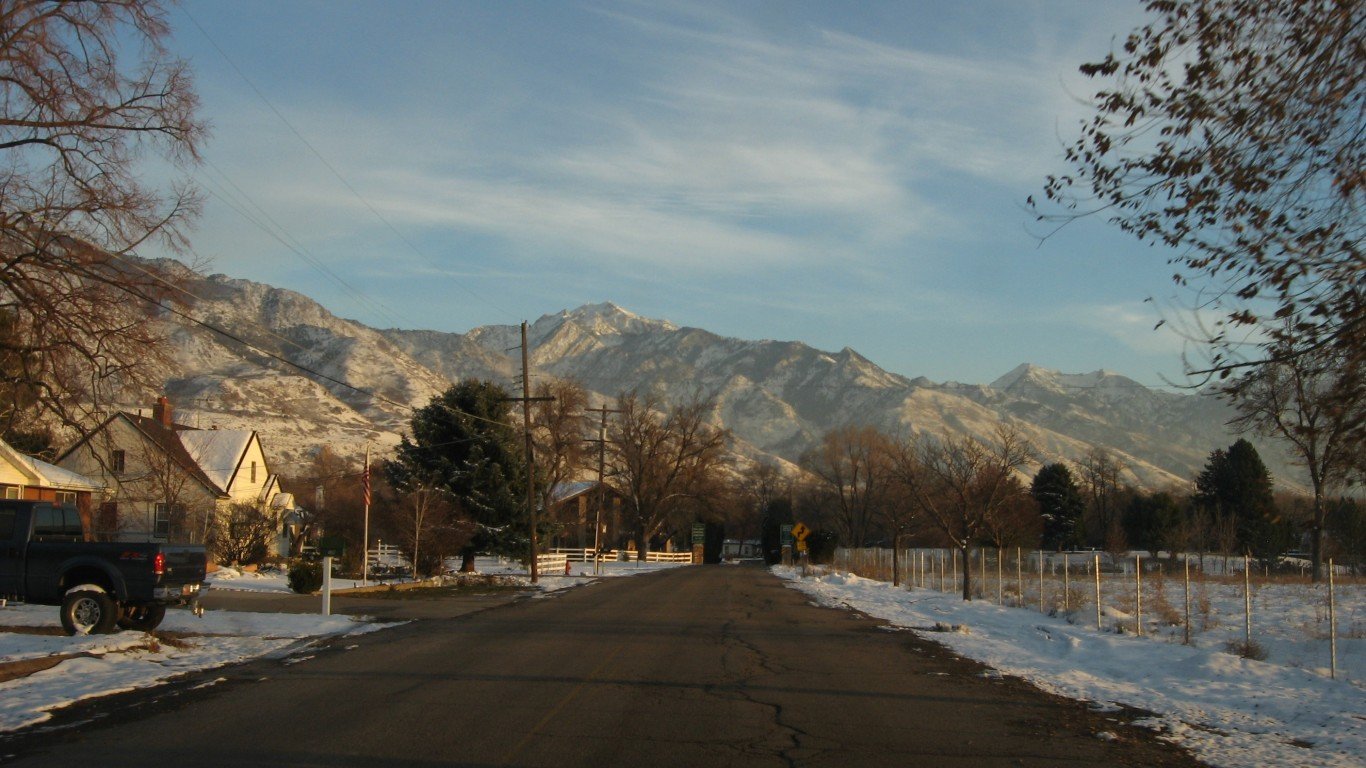
Utah: Holladay
> Adults with at least a bachelor’s degree: 55.8% (Utah: 34.0%)
> Median household income: $88,728 (Utah: $71,621)
> Estimated unemployment rate 2015-2019, all workers: 1.3% (Utah: 2.7%)
> Estimated unemployment rate 2015-2019, adults with at least a bachelor’s degree: 0.7% (Utah: 1.8%)
[in-text-ad-2]
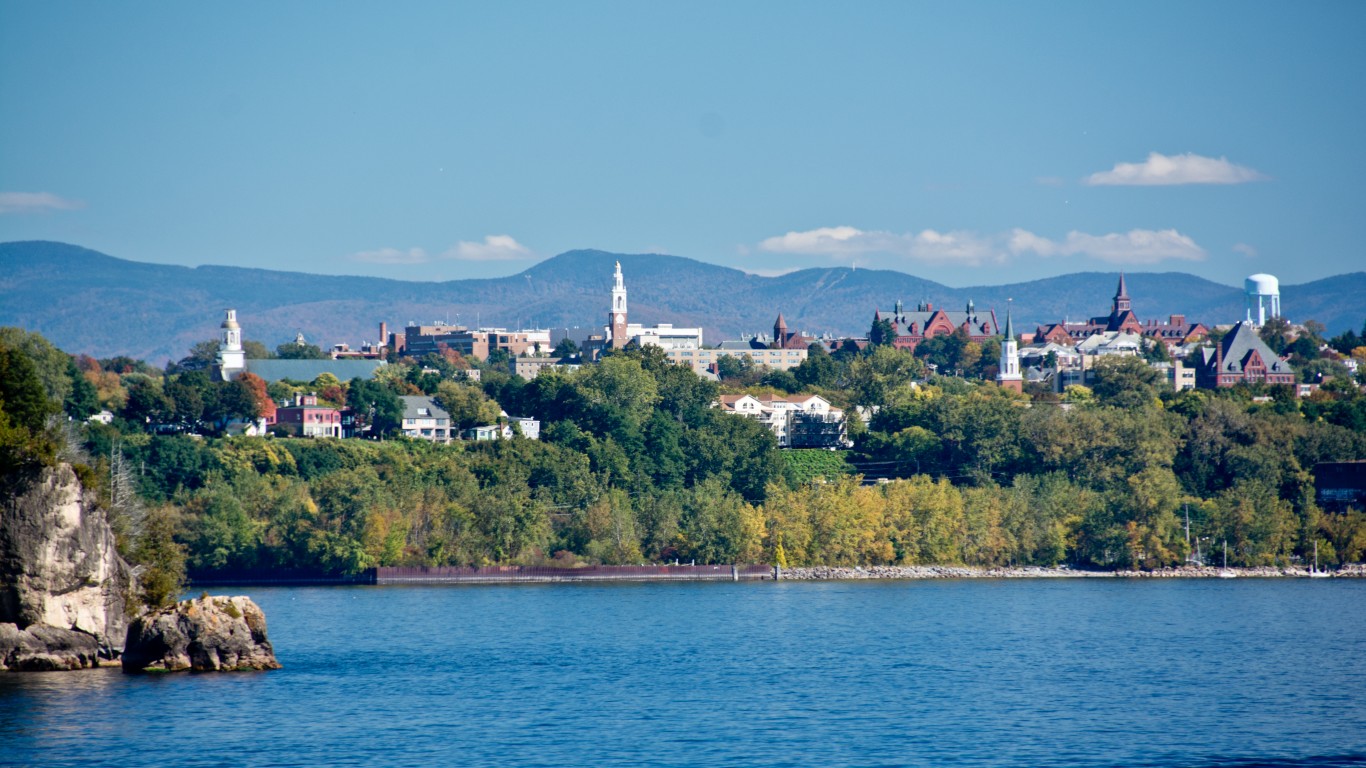
Vermont: Burlington*
> Adults with at least a bachelor’s degree: 53.3% (Vermont: 38.0%)
> Median household income: $51,394 (Vermont: $61,973)
> Estimated unemployment rate 2015-2019, all workers: 2.9% (Vermont: 2.8%)
> Estimated unemployment rate 2015-2019, adults with at least a bachelor’s degree: 2.0% (Vermont: 2.0%)
*Because Burlington is the only eligible city in Vermont, it is the most educated by default.

Virginia: McLean
> Adults with at least a bachelor’s degree: 83.5% (Virginia: 38.8%)
> Median household income: $207,184 (Virginia: $74,222)
> Estimated unemployment rate 2015-2019, all workers: 2.0% (Virginia: 3.7%)
> Estimated unemployment rate 2015-2019, adults with at least a bachelor’s degree: 2.0% (Virginia: 2.3%)
[in-text-ad]

Washington: Mercer Island
> Adults with at least a bachelor’s degree: 78.2% (Washington: 36.0%)
> Median household income: $147,566 (Washington: $73,775)
> Estimated unemployment rate 2015-2019, all workers: 3.7% (Washington: 4.0%)
> Estimated unemployment rate 2015-2019, adults with at least a bachelor’s degree: 3.2% (Washington: 2.5%)
[recirclink id=908660]
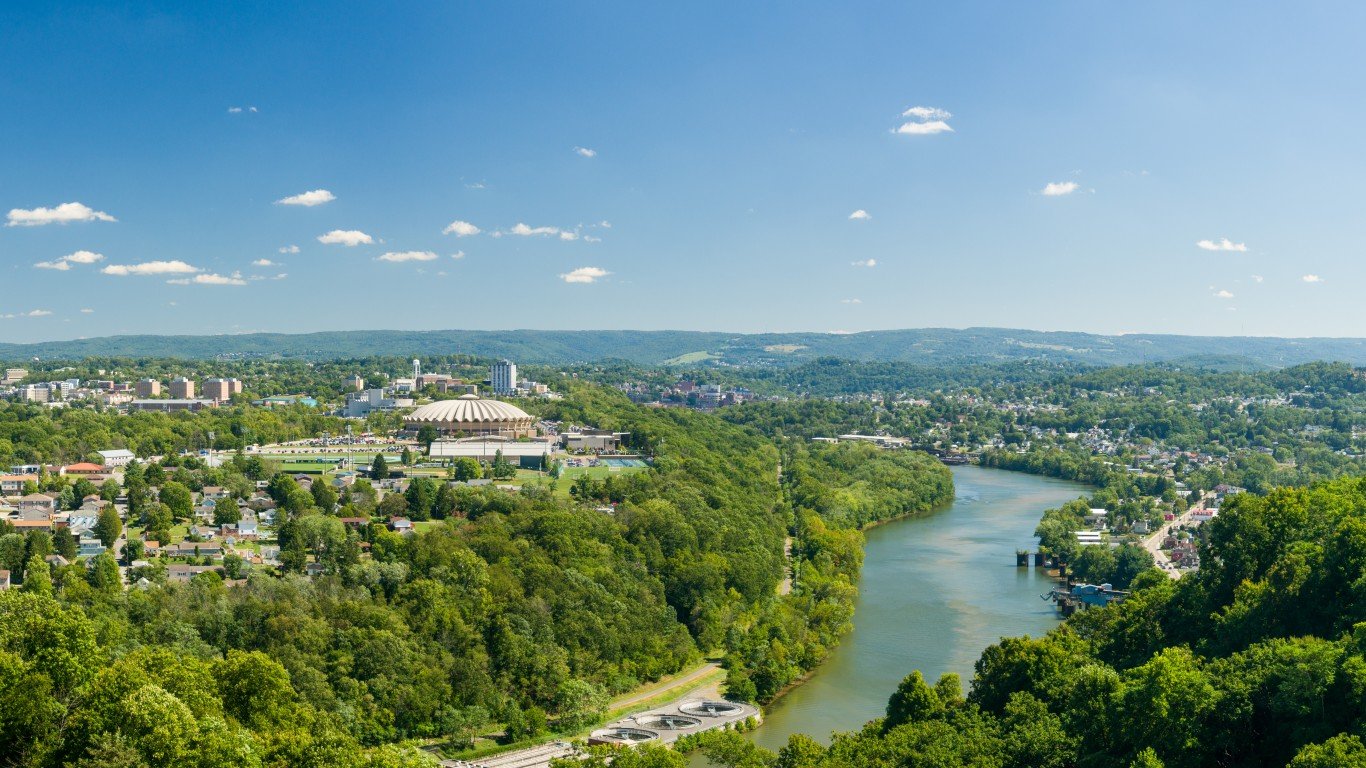
West Virginia: Morgantown
> Adults with at least a bachelor’s degree: 55.0% (West Virginia: 20.6%)
> Median household income: $42,966 (West Virginia: $46,711)
> Estimated unemployment rate 2015-2019, all workers: 3.9% (West Virginia: 5.3%)
> Estimated unemployment rate 2015-2019, adults with at least a bachelor’s degree: 2.0% (West Virginia: 2.2%)
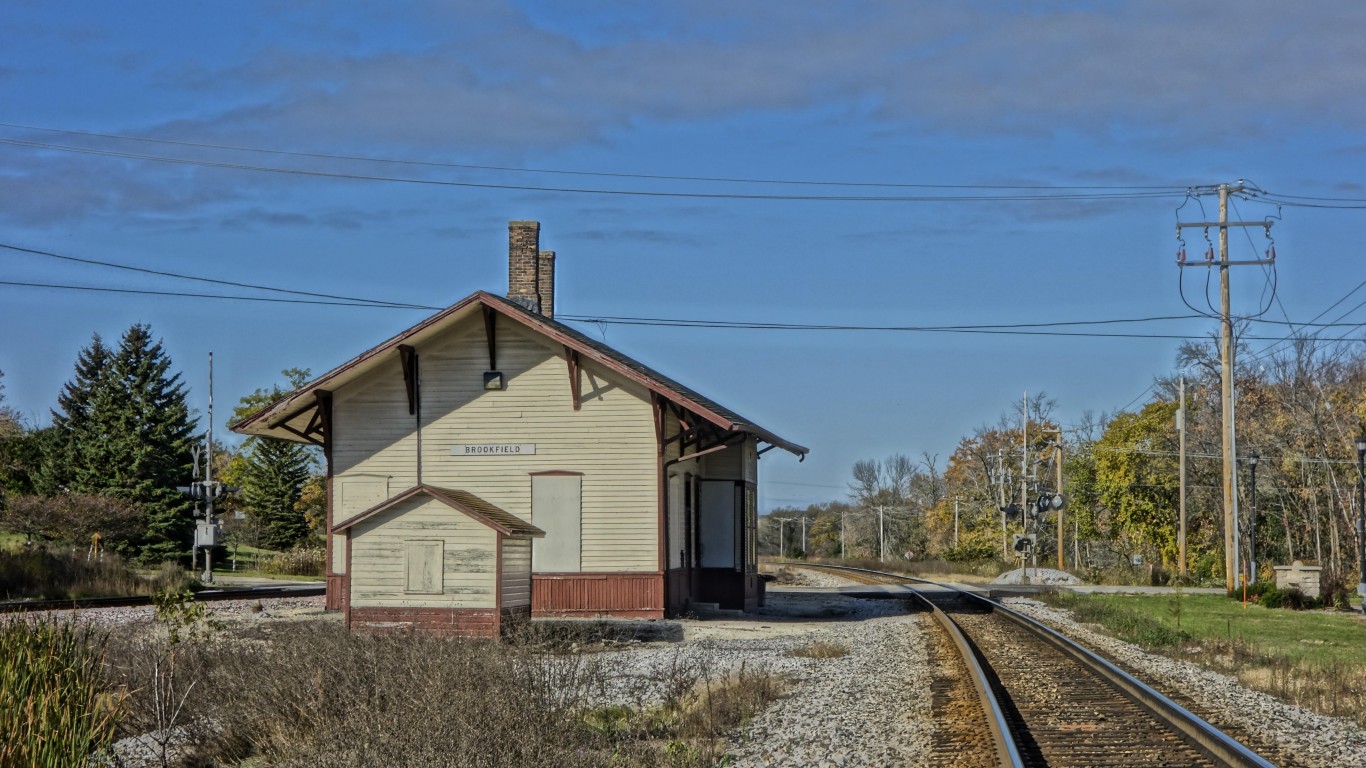
Wisconsin: Brookfield
> Adults with at least a bachelor’s degree: 60.7% (Wisconsin: 30.1%)
> Median household income: $108,198 (Wisconsin: $61,747)
> Estimated unemployment rate 2015-2019, all workers: 2.3% (Wisconsin: 2.9%)
> Estimated unemployment rate 2015-2019, adults with at least a bachelor’s degree: 1.9% (Wisconsin: 1.5%)
[in-text-ad-2]
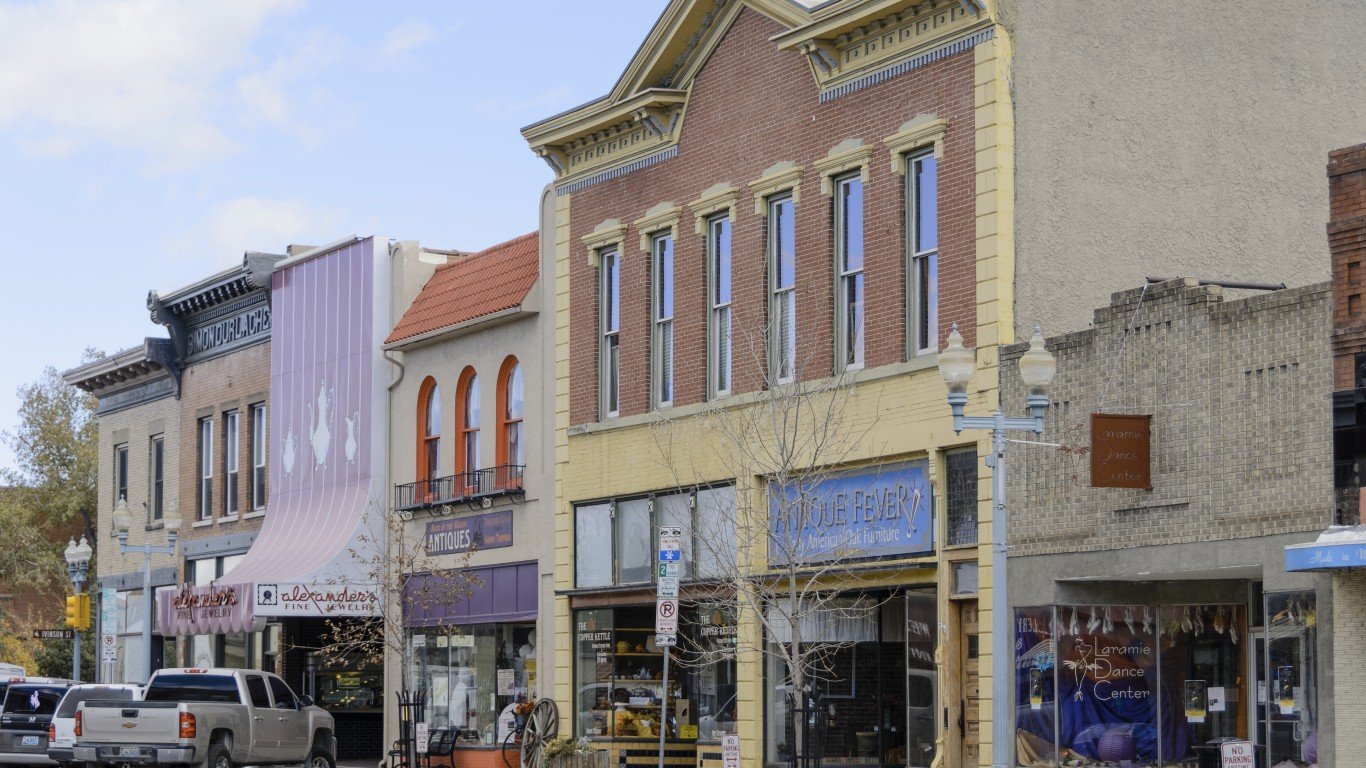
Wyoming: Laramie
> Adults with at least a bachelor’s degree: 52.7% (Wyoming: 27.4%)
> Median household income: $46,117 (Wyoming: $64,049)
> Estimated unemployment rate 2015-2019, all workers: 3.3% (Wyoming: 3.7%)
> Estimated unemployment rate 2015-2019, adults with at least a bachelor’s degree: 2.8% (Wyoming: 1.9%)
Methodology
To determine the most educated city in every state, 24/7 Wall St. reviewed five-year estimates of the percentage of adults 25 years and over with at least a bachelor’s degree from the U.S. Census Bureau’s 2019 American Community Survey.
We used census “place” geographies — a category that includes 29,573 incorporated legal entities and census-designated statistical entities. Of those, 29,319 had boundaries that fell within one of the 50 states, while the rest were in the District of Columbia or Puerto Rico.
We defined cities based on a population threshold — having more than 25,000 people — and 1,774 of the places fell within this threshold.
Cities were then excluded if bachelor’s degree or higher attainment rates were not available in the 2019 ACS, if the city’s 25 and older population was less than 1,000, or if the sampling error associated with a city’s data was deemed too high.
The sampling error was defined as too high if the coefficient of variation — a statistical assessment of how reliable an estimate is — for a city’s bachelor’s or higher attainment rate was above 15% and greater than two standard deviations above the mean CV for all cities’ bachelor’s or higher attainment rate. We similarly excluded cities that had a sampling error too high for their 25 and over population estimates, using the same definition.
The remaining 1,770 places were ranked within their state based on the share of adults 25 years and over with at least a bachelor’s degree.
Additional information on median household income, unemployment rates for the 25-64 year old population that have at least a bachelor’s degree, and unemployment rates for the 25-64 year old population with any education level are also five-year estimates from the 2019 ACS.
Contact [email protected] for any questions or corrections.