
The United States has some of the highest levels of income and wealth inequality in the world. U.S. Federal Reserve data shows that the wealthiest 10% of Americans control $93.8 trillion, more than double the $40.3 trillion in the hands of the remaining 90% of Americans.
The income and wealth divide only appears to be growing wider. A January 2020 report published by the Pew Research Center found that over the last four decades, income growth for the top 5% of families by earnings has far outpaced income growth for families in the lower income strata.
In a nation as large as the U.S., varied levels of income inequality may be expected. While some parts have wide income gaps, other parts of the country are defined, at least in part, by their relative income equality.
Using data from the U.S. Census Bureau’s 2019 American Community Survey, 24/7 Wall St. identified the metro area with the smallest income gap in each state. Metropolitan areas are ranked by their Gini coefficient, a measure of income inequality based on the distribution of income across a population on a 0 to 1 scale — 0 representing perfect equality and 1 representing the highest possible level of inequality. Four states — Delaware, New Hampshire, Rhode Island, and Vermont — have only one metro area. As a result, these areas rank as having the lowest income inequality in the state by default only.
Though each metro area on this list has the smallest degree of income inequality in its state, Gini scores vary considerably — from 0.377 to 0.469. Nationwide, the Gini coefficient stands at 0.481.
Causes behind rising inequality in the United States are complex and varied. A report published by the National Bureau of Economic Research ties the rising disparity to a range of economic factors, including globalization, technological advancement, a stagnant minimum wage, and the decline of labor unions.
Click here to see the metro with the smallest income gaps in every state
Click here to read our detailed methodology

Alabama: Florence-Muscle Shoals
> Gini index: 0.444 (Alabama: 0.474)
> Avg. household income, top 20%: $144,126 (Alabama: $180,469)
> Avg. household income, bottom 20%: $10,476 (Alabama: $10,916)
> Share of all income in Florence-Muscle Shoals that went to top 20%: 47.5% (Alabama: 50.5%)
> Share of all income in Florence-Muscle Shoals that went to bottom 20%: 3.5% (Alabama: 3.1%)
> Median household income: $45,824 (Alabama: $51,734)
[in-text-ad]

Alaska: Fairbanks
> Gini index: 0.435 (Alaska: 0.438)
> Avg. household income, top 20%: $247,440 (Alaska: $234,221)
> Avg. household income, bottom 20%: $21,222 (Alaska: $18,408)
> Share of all income in Fairbanks that went to top 20%: 47.9% (Alaska: 47.5%)
> Share of all income in Fairbanks that went to bottom 20%: 4.1% (Alaska: 3.7%)
> Median household income: $72,065 (Alaska: $75,463)
[recirclink id=887395]

Arizona: Lake Havasu City-Kingman
> Gini index: 0.421 (Arizona: 0.459)
> Avg. household income, top 20%: $148,248 (Arizona: $209,819)
> Avg. household income, bottom 20%: $14,124 (Arizona: $14,754)
> Share of all income in Lake Havasu City-Kingman that went to top 20%: 46.7% (Arizona: 49.7%)
> Share of all income in Lake Havasu City-Kingman that went to bottom 20%: 4.4% (Arizona: 3.5%)
> Median household income: $50,179 (Arizona: $62,055)
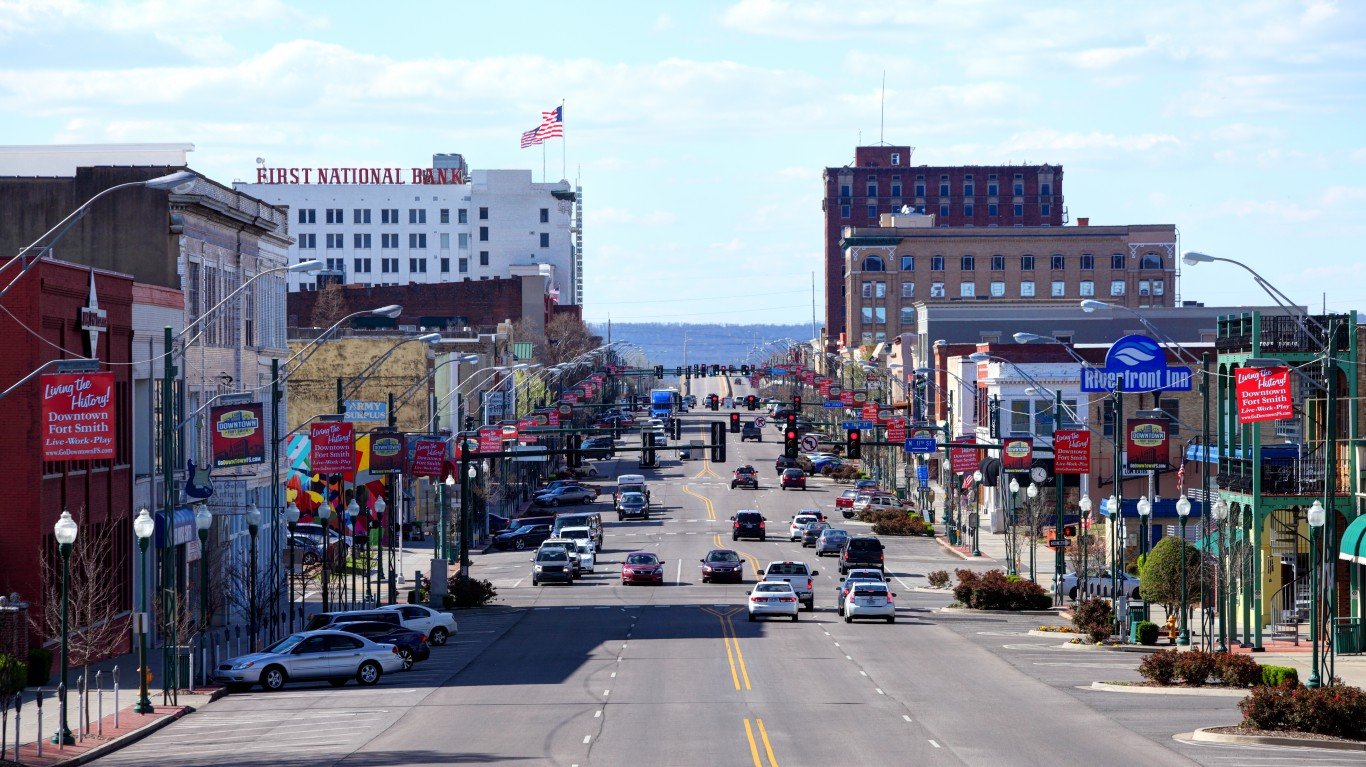
Arkansas: Fort Smith
> Gini index: 0.449 (Arkansas: 0.475)
> Avg. household income, top 20%: $146,895 (Arkansas: $173,941)
> Avg. household income, bottom 20%: $11,461 (Arkansas: $11,555)
> Share of all income in Fort Smith that went to top 20%: 48.9% (Arkansas: 51.0%)
> Share of all income in Fort Smith that went to bottom 20%: 3.8% (Arkansas: 3.4%)
> Median household income: $45,157 (Arkansas: $48,952)
[in-text-ad-2]

California: Vallejo
> Gini index: 0.414 (California: 0.487)
> Avg. household income, top 20%: $239,436 (California: $295,369)
> Avg. household income, bottom 20%: $20,892 (California: $16,981)
> Share of all income in Vallejo that went to top 20%: 45.4% (California: 52.0%)
> Share of all income in Vallejo that went to bottom 20%: 4.0% (California: 3.0%)
> Median household income: $86,652 (California: $80,440)

Colorado: Greeley
> Gini index: 0.409 (Colorado: 0.455)
> Avg. household income, top 20%: $213,357 (Colorado: $255,114)
> Avg. household income, bottom 20%: $19,839 (Colorado: $18,417)
> Share of all income in Greeley that went to top 20%: 44.7% (Colorado: 49.3%)
> Share of all income in Greeley that went to bottom 20%: 4.2% (Colorado: 3.6%)
> Median household income: $78,615 (Colorado: $77,127)
[in-text-ad]

Connecticut: Norwich-New London
> Gini index: 0.437 (Connecticut: 0.502)
> Avg. household income, top 20%: $234,912 (Connecticut: $306,153)
> Avg. household income, bottom 20%: $19,471 (Connecticut: $16,037)
> Share of all income in Norwich-New London that went to top 20%: 47.9% (Connecticut: 53.4%)
> Share of all income in Norwich-New London that went to bottom 20%: 4.0% (Connecticut: 2.8%)
> Median household income: $75,633 (Connecticut: $78,833)
[recirclink id=848904]

Delaware: Dover*
> Gini index: 0.416 (Delaware: 0.451)
> Avg. household income, top 20%: $162,096 (Delaware: $224,894)
> Avg. household income, bottom 20%: $13,115 (Delaware: $15,945)
> Share of all income in Dover that went to top 20%: 45.2% (Delaware: 48.7%)
> Share of all income in Dover that went to bottom 20%: 3.7% (Delaware: 3.5%)
> Median household income: $58,001 (Delaware: $70,176)
*Because Dover is the only eligible metro in Delaware, it is the metro with the smallest income gaps by default.

Florida: Panama City
> Gini index: 0.423 (Florida: 0.481)
> Avg. household income, top 20%: $178,373 (Florida: $217,456)
> Avg. household income, bottom 20%: $14,640 (Florida: $14,026)
> Share of all income in Panama City that went to top 20%: 46.9% (Florida: 51.8%)
> Share of all income in Panama City that went to bottom 20%: 3.8% (Florida: 3.3%)
> Median household income: $59,450 (Florida: $59,227)
[in-text-ad-2]

Georgia: Hinesville
> Gini index: 0.377 (Georgia: 0.479)
> Avg. household income, top 20%: $131,588 (Georgia: $222,399)
> Avg. household income, bottom 20%: $15,363 (Georgia: $13,668)
> Share of all income in Hinesville that went to top 20%: 43.0% (Georgia: 51.4%)
> Share of all income in Hinesville that went to bottom 20%: 5.0% (Georgia: 3.2%)
> Median household income: $53,060 (Georgia: $61,980)

Hawaii: Kahului-Wailuku-Lahaina
> Gini index: 0.433 (Hawaii: 0.440)
> Avg. household income, top 20%: $235,529 (Hawaii: $252,492)
> Avg. household income, bottom 20%: $17,688 (Hawaii: $18,445)
> Share of all income in Kahului-Wailuku-Lahaina that went to top 20%: 47.2% (Hawaii: 47.5%)
> Share of all income in Kahului-Wailuku-Lahaina that went to bottom 20%: 3.5% (Hawaii: 3.5%)
> Median household income: $80,754 (Hawaii: $83,102)
[in-text-ad]

Idaho: Coeur d’Alene
> Gini index: 0.390 (Idaho: 0.434)
> Avg. household income, top 20%: $163,508 (Idaho: $188,036)
> Avg. household income, bottom 20%: $18,870 (Idaho: $16,199)
> Share of all income in Coeur d’Alene that went to top 20%: 43.8% (Idaho: 47.6%)
> Share of all income in Coeur d’Alene that went to bottom 20%: 5.1% (Idaho: 4.1%)
> Median household income: $62,579 (Idaho: $60,999)
[recirclink id=850383]

Illinois: Kankakee
> Gini index: 0.400 (Illinois: 0.480)
> Avg. household income, top 20%: $160,426 (Illinois: $245,173)
> Avg. household income, bottom 20%: $14,915 (Illinois: $14,667)
> Share of all income in Kankakee that went to top 20%: 43.5% (Illinois: 51.2%)
> Share of all income in Kankakee that went to bottom 20%: 4.1% (Illinois: 3.1%)
> Median household income: $60,923 (Illinois: $69,187)

Indiana: Kokomo
> Gini index: 0.388 (Indiana: 0.458)
> Avg. household income, top 20%: $138,765 (Indiana: $193,279)
> Avg. household income, bottom 20%: $14,999 (Indiana: $13,987)
> Share of all income in Kokomo that went to top 20%: 43.1% (Indiana: 49.5%)
> Share of all income in Kokomo that went to bottom 20%: 4.7% (Indiana: 3.6%)
> Median household income: $53,440 (Indiana: $57,603)
[in-text-ad-2]

Iowa: Sioux City
> Gini index: 0.414 (Iowa: 0.442)
> Avg. household income, top 20%: $165,881 (Iowa: $192,979)
> Avg. household income, bottom 20%: $15,482 (Iowa: $15,270)
> Share of all income in Sioux City that went to top 20%: 44.8% (Iowa: 48.1%)
> Share of all income in Sioux City that went to bottom 20%: 4.2% (Iowa: 3.8%)
> Median household income: $60,132 (Iowa: $61,691)

Kansas: Topeka
> Gini index: 0.429 (Kansas: 0.450)
> Avg. household income, top 20%: $179,473 (Kansas: $200,932)
> Avg. household income, bottom 20%: $16,116 (Kansas: $15,090)
> Share of all income in Topeka that went to top 20%: 47.2% (Kansas: 48.8%)
> Share of all income in Topeka that went to bottom 20%: 4.2% (Kansas: 3.7%)
> Median household income: $59,567 (Kansas: $62,087)
[in-text-ad]
Kentucky: Elizabethtown-Fort Knox
> Gini index: 0.431 (Kentucky: 0.476)
> Avg. household income, top 20%: $171,512 (Kentucky: $183,549)
> Avg. household income, bottom 20%: $14,575 (Kentucky: $11,367)
> Share of all income in Elizabethtown-Fort Knox that went to top 20%: 47.1% (Kentucky: 50.8%)
> Share of all income in Elizabethtown-Fort Knox that went to bottom 20%: 4.0% (Kentucky: 3.2%)
> Median household income: $55,246 (Kentucky: $52,295)
[recirclink id=920281]
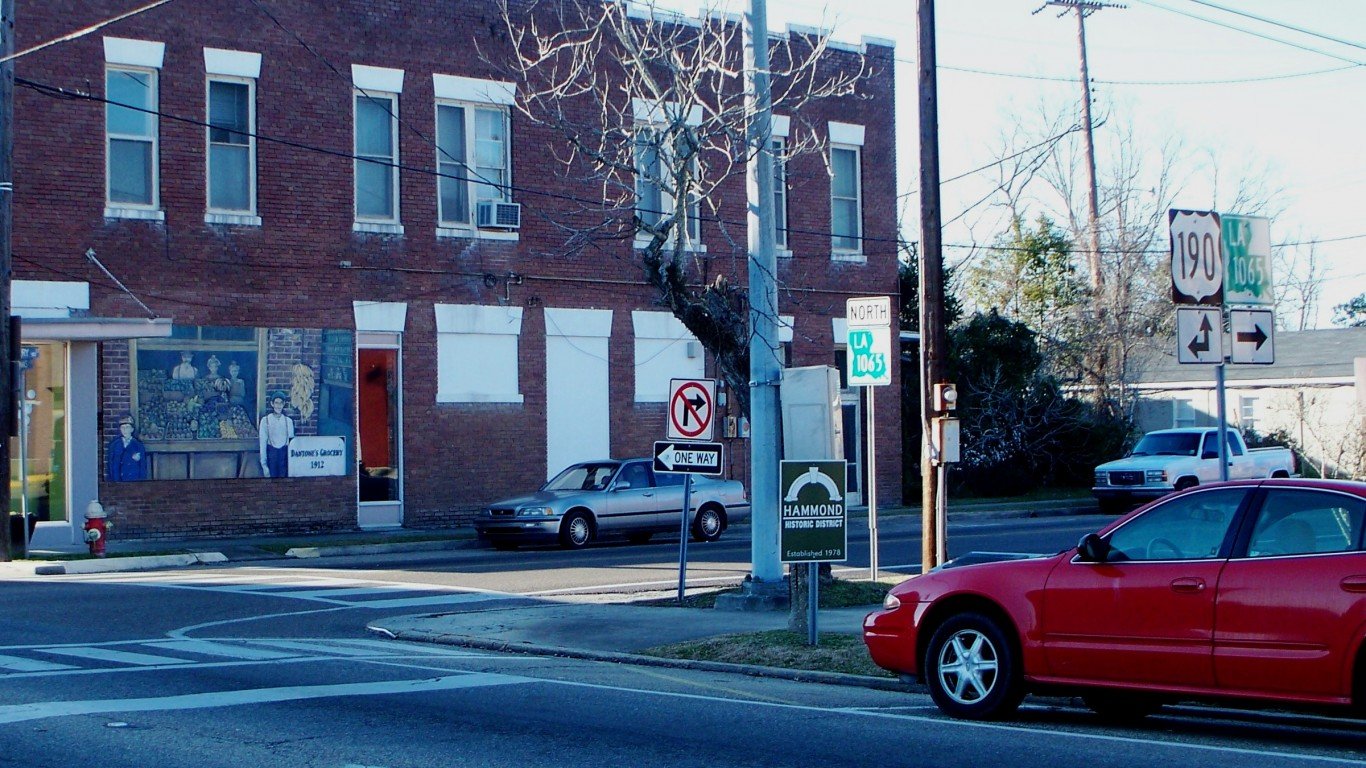
Louisiana: Hammond
> Gini index: 0.463 (Louisiana: 0.498)
> Avg. household income, top 20%: $160,071 (Louisiana: $190,038)
> Avg. household income, bottom 20%: $10,726 (Louisiana: $9,426)
> Share of all income in Hammond that went to top 20%: 48.7% (Louisiana: 52.3%)
> Share of all income in Hammond that went to bottom 20%: 3.3% (Louisiana: 2.6%)
> Median household income: $47,825 (Louisiana: $51,073)

Maine: Lewiston-Auburn
> Gini index: 0.409 (Maine: 0.449)
> Avg. household income, top 20%: $174,869 (Maine: $190,606)
> Avg. household income, bottom 20%: $17,783 (Maine: $14,674)
> Share of all income in Lewiston-Auburn that went to top 20%: 45.2% (Maine: 48.7%)
> Share of all income in Lewiston-Auburn that went to bottom 20%: 4.6% (Maine: 3.8%)
> Median household income: $63,813 (Maine: $58,924)
[in-text-ad-2]

Maryland: Hagerstown-Martinsburg
> Gini index: 0.428 (Maryland: 0.456)
> Avg. household income, top 20%: $181,444 (Maryland: $280,115)
> Avg. household income, bottom 20%: $15,320 (Maryland: $18,902)
> Share of all income in Hagerstown-Martinsburg that went to top 20%: 46.8% (Maryland: 49.1%)
> Share of all income in Hagerstown-Martinsburg that went to bottom 20%: 4.0% (Maryland: 3.3%)
> Median household income: $60,095 (Maryland: $86,738)

Massachusetts: Barnstable Town
> Gini index: 0.437 (Massachusetts: 0.480)
> Avg. household income, top 20%: $267,300 (Massachusetts: $299,188)
> Avg. household income, bottom 20%: $23,047 (Massachusetts: $16,450)
> Share of all income in Barnstable Town that went to top 20%: 47.8% (Massachusetts: 50.9%)
> Share of all income in Barnstable Town that went to bottom 20%: 4.1% (Massachusetts: 2.8%)
> Median household income: $85,042 (Massachusetts: $85,843)
[in-text-ad]

Michigan: Bay City
> Gini index: 0.433 (Michigan: 0.463)
> Avg. household income, top 20%: $160,484 (Michigan: $201,676)
> Avg. household income, bottom 20%: $13,444 (Michigan: $13,976)
> Share of all income in Bay City that went to top 20%: 47.7% (Michigan: 50.0%)
> Share of all income in Bay City that went to bottom 20%: 4.0% (Michigan: 3.5%)
> Median household income: $49,610 (Michigan: $59,584)
[recirclink id=970377]

Minnesota: St. Cloud
> Gini index: 0.414 (Minnesota: 0.443)
> Avg. household income, top 20%: $183,258 (Minnesota: $233,949)
> Avg. household income, bottom 20%: $17,336 (Minnesota: $18,156)
> Share of all income in St. Cloud that went to top 20%: 45.7% (Minnesota: 48.2%)
> Share of all income in St. Cloud that went to bottom 20%: 4.3% (Minnesota: 3.7%)
> Median household income: $66,076 (Minnesota: $74,593)

Mississippi: Gulfport-Biloxi
> Gini index: 0.464 (Mississippi: 0.490)
> Avg. household income, top 20%: $173,655 (Mississippi: $169,318)
> Avg. household income, bottom 20%: $12,817 (Mississippi: $9,715)
> Share of all income in Gulfport-Biloxi that went to top 20%: 50.0% (Mississippi: 52.0%)
> Share of all income in Gulfport-Biloxi that went to bottom 20%: 3.7% (Mississippi: 3.0%)
> Median household income: $50,642 (Mississippi: $45,792)
[in-text-ad-2]

Missouri: Jefferson City
> Gini index: 0.421 (Missouri: 0.463)
> Avg. household income, top 20%: $172,302 (Missouri: $194,185)
> Avg. household income, bottom 20%: $14,985 (Missouri: $13,294)
> Share of all income in Jefferson City that went to top 20%: 46.1% (Missouri: 49.9%)
> Share of all income in Jefferson City that went to bottom 20%: 4.0% (Missouri: 3.4%)
> Median household income: $60,786 (Missouri: $57,409)

Montana: Great Falls
> Gini index: 0.434 (Montana: 0.460)
> Avg. household income, top 20%: $150,395 (Montana: $191,819)
> Avg. household income, bottom 20%: $11,625 (Montana: $13,899)
> Share of all income in Great Falls that went to top 20%: 46.7% (Montana: 49.6%)
> Share of all income in Great Falls that went to bottom 20%: 3.6% (Montana: 3.6%)
> Median household income: $51,227 (Montana: $57,153)
[in-text-ad]

Nebraska: Omaha-Council Bluffs
> Gini index: 0.436 (Nebraska: 0.440)
> Avg. household income, top 20%: $212,521 (Nebraska: $197,997)
> Avg. household income, bottom 20%: $17,115 (Nebraska: $15,965)
> Share of all income in Omaha-Council Bluffs that went to top 20%: 47.4% (Nebraska: 48.0%)
> Share of all income in Omaha-Council Bluffs that went to bottom 20%: 3.8% (Nebraska: 3.9%)
> Median household income: $70,373 (Nebraska: $63,229)
[recirclink id=887395]

Nevada: Carson City
> Gini index: 0.444 (Nevada: 0.471)
> Avg. household income, top 20%: $177,090 (Nevada: $220,208)
> Avg. household income, bottom 20%: $13,776 (Nevada: $14,425)
> Share of all income in Carson City that went to top 20%: 47.9% (Nevada: 50.7%)
> Share of all income in Carson City that went to bottom 20%: 3.7% (Nevada: 3.3%)
> Median household income: $57,270 (Nevada: $63,276)

New Hampshire: Manchester-Nashua*
> Gini index: 0.421 (New Hampshire: 0.441)
> Avg. household income, top 20%: $241,381 (New Hampshire: $241,891)
> Avg. household income, bottom 20%: $20,976 (New Hampshire: $19,002)
> Share of all income in Manchester-Nashua that went to top 20%: 46.0% (New Hampshire: 48.0%)
> Share of all income in Manchester-Nashua that went to bottom 20%: 4.0% (New Hampshire: 3.8%)
> Median household income: $83,626 (New Hampshire: $77,933)
*Because Manchester-Nashua is the only eligible metro in New Hampshire, it is the metro with the smallest income gaps by default.
[in-text-ad-2]
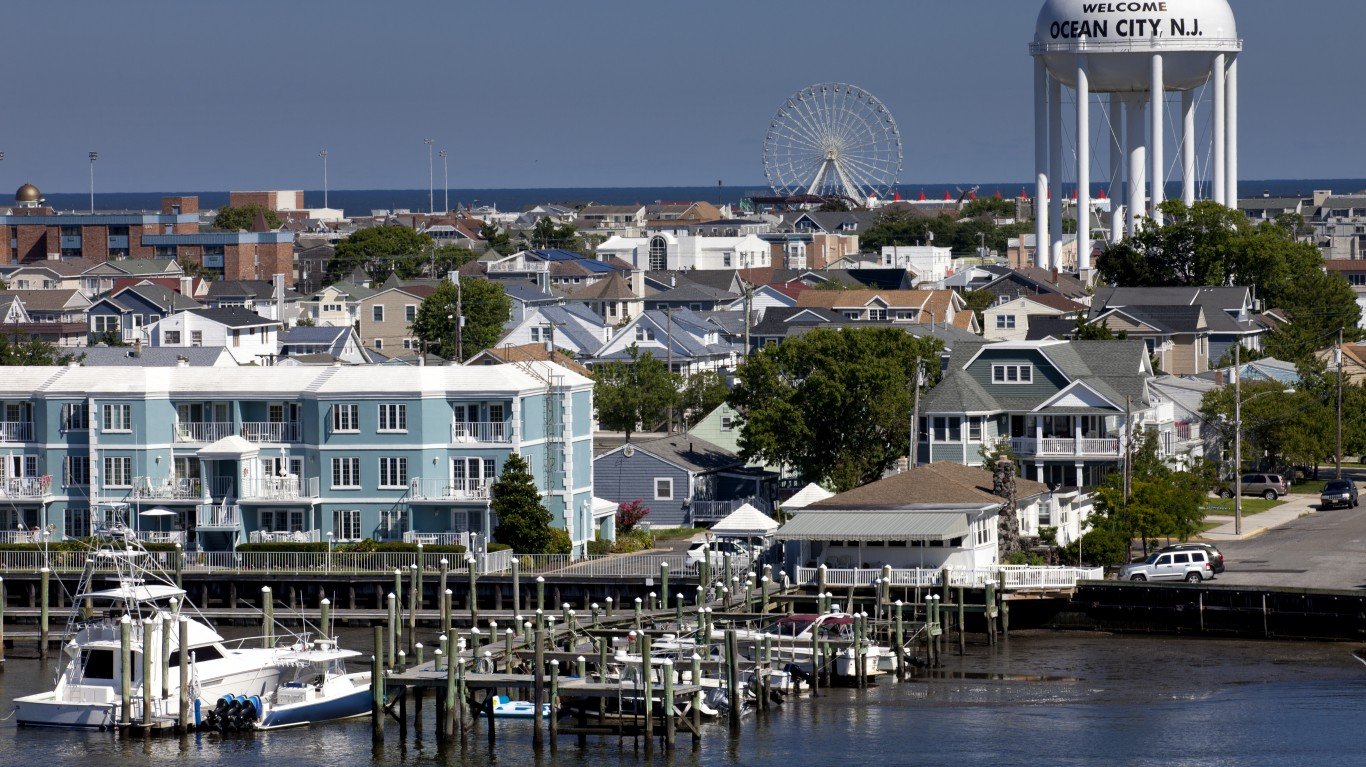
New Jersey: Ocean City
> Gini index: 0.462 (New Jersey: 0.478)
> Avg. household income, top 20%: $245,545 (New Jersey: $305,190)
> Avg. household income, bottom 20%: $17,966 (New Jersey: $18,249)
> Share of all income in Ocean City that went to top 20%: 49.6% (New Jersey: 51.2%)
> Share of all income in Ocean City that went to bottom 20%: 3.6% (New Jersey: 3.1%)
> Median household income: $69,980 (New Jersey: $85,751)

New Mexico: Farmington
> Gini index: 0.469 (New Mexico: 0.477)
> Avg. household income, top 20%: $153,975 (New Mexico: $181,940)
> Avg. household income, bottom 20%: $10,562 (New Mexico: $10,976)
> Share of all income in Farmington that went to top 20%: 51.0% (New Mexico: 50.8%)
> Share of all income in Farmington that went to bottom 20%: 3.5% (New Mexico: 3.1%)
> Median household income: $44,321 (New Mexico: $51,945)
[in-text-ad]
New York: Watertown-Fort Drum
> Gini index: 0.417 (New York: 0.515)
> Avg. household income, top 20%: $153,015 (New York: $291,906)
> Avg. household income, bottom 20%: $13,332 (New York: $13,372)
> Share of all income in Watertown-Fort Drum that went to top 20%: 45.4% (New York: 54.4%)
> Share of all income in Watertown-Fort Drum that went to bottom 20%: 4.0% (New York: 2.5%)
> Median household income: $53,917 (New York: $72,108)
[recirclink id=848904]

North Carolina: Burlington
> Gini index: 0.437 (North Carolina: 0.474)
> Avg. household income, top 20%: $168,924 (North Carolina: $204,129)
> Avg. household income, bottom 20%: $12,751 (North Carolina: $13,301)
> Share of all income in Burlington that went to top 20%: 47.2% (North Carolina: 51.0%)
> Share of all income in Burlington that went to bottom 20%: 3.6% (North Carolina: 3.3%)
> Median household income: $58,490 (North Carolina: $57,341)

North Dakota: Bismarck
> Gini index: 0.441 (North Dakota: 0.456)
> Avg. household income, top 20%: $219,721 (North Dakota: $209,985)
> Avg. household income, bottom 20%: $17,806 (North Dakota: $15,064)
> Share of all income in Bismarck that went to top 20%: 47.8% (North Dakota: 49.1%)
> Share of all income in Bismarck that went to bottom 20%: 3.9% (North Dakota: 3.5%)
> Median household income: $70,979 (North Dakota: $64,577)
[in-text-ad-2]

Ohio: Lima
> Gini index: 0.388 (Ohio: 0.465)
> Avg. household income, top 20%: $145,342 (Ohio: $199,074)
> Avg. household income, bottom 20%: $15,250 (Ohio: $13,601)
> Share of all income in Lima that went to top 20%: 43.1% (Ohio: 50.1%)
> Share of all income in Lima that went to bottom 20%: 4.5% (Ohio: 3.4%)
> Median household income: $60,429 (Ohio: $58,642)

Oklahoma: Lawton
> Gini index: 0.437 (Oklahoma: 0.474)
> Avg. household income, top 20%: $154,792 (Oklahoma: $192,061)
> Avg. household income, bottom 20%: $11,673 (Oklahoma: $12,507)
> Share of all income in Lawton that went to top 20%: 47.0% (Oklahoma: 50.8%)
> Share of all income in Lawton that went to bottom 20%: 3.5% (Oklahoma: 3.3%)
> Median household income: $51,332 (Oklahoma: $54,449)
[in-text-ad]

Oregon: Albany-Lebanon
> Gini index: 0.398 (Oregon: 0.450)
> Avg. household income, top 20%: $163,497 (Oregon: $215,026)
> Avg. household income, bottom 20%: $17,312 (Oregon: $15,597)
> Share of all income in Albany-Lebanon that went to top 20%: 43.8% (Oregon: 48.6%)
> Share of all income in Albany-Lebanon that went to bottom 20%: 4.6% (Oregon: 3.5%)
> Median household income: $61,488 (Oregon: $67,058)
[recirclink id=850383]

Pennsylvania: Chambersburg-Waynesboro
> Gini index: 0.397 (Pennsylvania: 0.475)
> Avg. household income, top 20%: $170,899 (Pennsylvania: $223,499)
> Avg. household income, bottom 20%: $19,443 (Pennsylvania: $14,295)
> Share of all income in Chambersburg-Waynesboro that went to top 20%: 44.5% (Pennsylvania: 50.9%)
> Share of all income in Chambersburg-Waynesboro that went to bottom 20%: 5.1% (Pennsylvania: 3.3%)
> Median household income: $62,484 (Pennsylvania: $63,463)

Rhode Island: Providence-Warwick*
> Gini index: 0.463 (Rhode Island: 0.463)
> Avg. household income, top 20%: $227,003 (Rhode Island: $228,951)
> Avg. household income, bottom 20%: $14,162 (Rhode Island: $14,829)
> Share of all income in Providence-Warwick that went to top 20%: 49.3% (Rhode Island: 49.5%)
> Share of all income in Providence-Warwick that went to bottom 20%: 3.1% (Rhode Island: 3.2%)
> Median household income: $70,967 (Rhode Island: $71,169)
*Because Providence-Warwick is the only eligible metro in Rhode Island, it is the metro with the smallest income gaps by default.
[in-text-ad-2]

South Carolina: Myrtle Beach-Conway-North Myrtle Beach
> Gini index: 0.434 (South Carolina: 0.475)
> Avg. household income, top 20%: $178,813 (South Carolina: $198,951)
> Avg. household income, bottom 20%: $15,757 (South Carolina: $12,334)
> Share of all income in Myrtle Beach-Conway-North Myrtle Beach that went to top 20%: 47.9% (South Carolina: 50.9%)
> Share of all income in Myrtle Beach-Conway-North Myrtle Beach that went to bottom 20%: 4.2% (South Carolina: 3.2%)
> Median household income: $56,977 (South Carolina: $56,227)

South Dakota: Sioux Falls
> Gini index: 0.434 (South Dakota: 0.436)
> Avg. household income, top 20%: $207,557 (South Dakota: $184,714)
> Avg. household income, bottom 20%: $18,681 (South Dakota: $15,519)
> Share of all income in Sioux Falls that went to top 20%: 48.0% (South Dakota: 47.6%)
> Share of all income in Sioux Falls that went to bottom 20%: 4.3% (South Dakota: 4.0%)
> Median household income: $65,566 (South Dakota: $59,533)
[in-text-ad]

Tennessee: Clarksville
> Gini index: 0.430 (Tennessee: 0.475)
> Avg. household income, top 20%: $161,506 (Tennessee: $199,456)
> Avg. household income, bottom 20%: $12,901 (Tennessee: $13,144)
> Share of all income in Clarksville that went to top 20%: 46.9% (Tennessee: 51.1%)
> Share of all income in Clarksville that went to bottom 20%: 3.8% (Tennessee: 3.4%)
> Median household income: $53,547 (Tennessee: $56,071)
[recirclink id=920281]

Texas: Odessa
> Gini index: 0.421 (Texas: 0.475)
> Avg. household income, top 20%: $192,448 (Texas: $228,924)
> Avg. household income, bottom 20%: $15,881 (Texas: $14,556)
> Share of all income in Odessa that went to top 20%: 45.5% (Texas: 51.0%)
> Share of all income in Odessa that went to bottom 20%: 3.8% (Texas: 3.3%)
> Median household income: $67,205 (Texas: $64,034)

Utah: Ogden-Clearfield
> Gini index: 0.392 (Utah: 0.427)
> Avg. household income, top 20%: $213,300 (Utah: $227,022)
> Avg. household income, bottom 20%: $23,759 (Utah: $20,124)
> Share of all income in Ogden-Clearfield that went to top 20%: 44.4% (Utah: 47.1%)
> Share of all income in Ogden-Clearfield that went to bottom 20%: 4.9% (Utah: 4.2%)
> Median household income: $79,251 (Utah: $75,780)
[in-text-ad-2]

Vermont: Burlington-South Burlington*
> Gini index: 0.431 (Vermont: 0.447)
> Avg. household income, top 20%: $218,013 (Vermont: $200,816)
> Avg. household income, bottom 20%: $16,508 (Vermont: $15,054)
> Share of all income in Burlington-South Burlington that went to top 20%: 46.8% (Vermont: 48.4%)
> Share of all income in Burlington-South Burlington that went to bottom 20%: 3.5% (Vermont: 3.6%)
> Median household income: $74,909 (Vermont: $63,001)
*Because Burlington-South Burlington is the only eligible metro in Vermont, it is the metro with the smallest income gaps by default.

Virginia: Staunton
> Gini index: 0.393 (Virginia: 0.469)
> Avg. household income, top 20%: $155,594 (Virginia: $265,171)
> Avg. household income, bottom 20%: $16,485 (Virginia: $17,138)
> Share of all income in Staunton that went to top 20%: 43.6% (Virginia: 50.5%)
> Share of all income in Staunton that went to bottom 20%: 4.6% (Virginia: 3.3%)
> Median household income: $57,844 (Virginia: $76,456)
[in-text-ad]

Washington: Bremerton-Silverdale-Port Orchard
> Gini index: 0.399 (Washington: 0.458)
> Avg. household income, top 20%: $217,164 (Washington: $262,118)
> Avg. household income, bottom 20%: $21,783 (Washington: $18,576)
> Share of all income in Bremerton-Silverdale-Port Orchard that went to top 20%: 44.6% (Washington: 49.6%)
> Share of all income in Bremerton-Silverdale-Port Orchard that went to bottom 20%: 4.5% (Washington: 3.5%)
> Median household income: $79,624 (Washington: $78,687)
[recirclink id=970377]

West Virginia: Weirton-Steubenville
> Gini index: 0.423 (West Virginia: 0.464)
> Avg. household income, top 20%: $142,026 (West Virginia: $163,240)
> Avg. household income, bottom 20%: $11,279 (West Virginia: $10,649)
> Share of all income in Weirton-Steubenville that went to top 20%: 45.5% (West Virginia: 49.6%)
> Share of all income in Weirton-Steubenville that went to bottom 20%: 3.6% (West Virginia: 3.2%)
> Median household income: $49,510 (West Virginia: $48,850)

Wisconsin: Fond du Lac
> Gini index: 0.395 (Wisconsin: 0.439)
> Avg. household income, top 20%: $175,980 (Wisconsin: $197,977)
> Avg. household income, bottom 20%: $18,975 (Wisconsin: $16,034)
> Share of all income in Fond du Lac that went to top 20%: 43.9% (Wisconsin: 47.8%)
> Share of all income in Fond du Lac that went to bottom 20%: 4.7% (Wisconsin: 3.9%)
> Median household income: $65,329 (Wisconsin: $64,168)
[in-text-ad-2]

Wyoming: Casper
> Gini index: 0.411 (Wyoming: 0.435)
> Avg. household income, top 20%: $179,231 (Wyoming: $196,029)
> Avg. household income, bottom 20%: $16,809 (Wyoming: $15,528)
> Share of all income in Casper that went to top 20%: 45.3% (Wyoming: 47.2%)
> Share of all income in Casper that went to bottom 20%: 4.3% (Wyoming: 3.7%)
> Median household income: $65,034 (Wyoming: $65,003)
Methodology
To determine the metro with the smallest income gaps in every state, 24/7 Wall St. reviewed one-year estimates of the Gini Index of income inequality from the U.S. Census Bureau’s 2019 American Community Survey.
The Gini Index of income inequality summarizes income dispersion in an area on a scale from 0 to 1. A value of 0 indicates perfect equality — everyone in the area receives an equal share of income. A value of 1 indicates perfect inequality — only one recipient receives all the income.
We used the 384 metropolitan statistical areas as delineated by the United States Office of Management and Budget and used by the Census Bureau as our definition of metros.
Metros were ranked within their state based on their Gini Index. To break ties, we used the share of aggregate household income earned by the top 20% of households. Since many metros cross state lines, the metro was assigned to the state of its first-listed principal city. Thus, the Washington-Arlington-Alexandria, DC-VA-MD-WV metro area was excluded as it is principally in the District of Columbia.
Additional information on average household income by quintile, share of aggregate household income by quintile, and median household income are also one-year estimates from the 2019 ACS.
Contact [email protected] for any questions or corrections.