Violent crime inched up by about 5% in the United States in 2020. The increase was led by a 29% surge in homicides — the largest such increase on record. Not all forms of criminal violence increased in frequency last year, however. Continuing a multi-decade downward trend, the robbery rate declined in the U.S. in 2020 and is now at its lowest level since at least the mid-1980s.
According to the FBI, robbery is a crime in which force or the threat of force or violence is used to take, or attempt to take, anything of value from another person. The largest share of robberies in the United States are committed on streets or sidewalks. Handguns are the most commonly used weapon in robberies, and more often than not, among the cases where a suspect can be identified, the offender and victim are strangers to one another.
There were nearly a quarter of a million robbery cases reported in the U.S. in 2020, or 74 for every 100,000 people. In most states, there is at least one major metropolitan area where robberies are far less common than they are nationwide.
Using data from the FBI’s 2020 Uniform Crime Report, 24/7 Wall St. identified the metro area with the fewest robberies in each state. Metropolitan areas are ranked by their robbery rate — specifically, the number of reported robberies for every 100,000 residents.
It is important to note that in eight states, there is only one eligible metro area with available data. In each of these cases, which are noted, the metro area listed ranks as having the fewest robberies per capita by default only. In two states — Alabama and Pennsylvania — there are no qualifying metro areas with available crime data.
Though each of the metro areas on this list ranks as having the lowest robbery rate in its respective state, robbery rates in these places vary considerably, from 127.6 for every 100,000 down to 1.2 per 100,000. In the majority of the metro areas on this list, robbery rates are below the statewide rate.
There are four classifications of violent crime in the U.S. — rаpe, robbery, aggravated assault, and homicide — and robbery accounted for about 19% of the 1.3 million violent offenses reported in 2020. In most metro areas on this list, the overall violent crime rate is below the overall statewide rate.
Click here to see the metro with the fewest robberies in every state
Click here to read our detailed methodology

Alabama: No eligible metros
> Robberies per 100k people: N/A (Alabama: 54.2)
> Number of robberies: N/A (Alabama: 2,666)
> Violent crimes per 100k people: N/A (Alabama: 453.6)
> Poverty rate: N/A (Alabama: 15.5%)
> Population within reporting jurisdiction: N/A (Alabama: 4,921,532)
[in-text-ad]

Alaska: Fairbanks
> Robberies per 100k people: 127.6 (Alaska: 97.4)
> Number of robberies: 42 (Alaska: 712)
> Violent crimes per 100k people: 841.4 (Alaska: 837.8)
> Poverty rate: 5.9% (Alaska: 10.1%)
> Population within reporting jurisdiction: 32,922 (Alaska: 731,158)
[recirclink id=968539]

Arizona: Prescott Valley-Prescott
> Robberies per 100k people: 10.0 (Arizona: 83.7)
> Number of robberies: 24 (Arizona: 6,211)
> Violent crimes per 100k people: 242.9 (Arizona: 484.8)
> Poverty rate: 12.0% (Arizona: 13.5%)
> Population within reporting jurisdiction: 239,151 (Arizona: 7,421,401)

Arkansas: Fort Smith
> Robberies per 100k people: 45.9 (Arkansas: 52.0)
> Number of robberies: 115 (Arkansas: 1,577)
> Violent crimes per 100k people: 614.9 (Arkansas: 671.9)
> Poverty rate: 19.4% (Arkansas: 16.2%)
> Population within reporting jurisdiction: 250,603 (Arkansas: 3,030,522)
[in-text-ad-2]

California: San Luis Obispo-Paso Robles
> Robberies per 100k people: 28.0 (California: 113.6)
> Number of robberies: 79 (California: 44,728)
> Violent crimes per 100k people: 289.6 (California: 442.0)
> Poverty rate: 11.9% (California: 11.8%)
> Population within reporting jurisdiction: 281,778 (California: 39,368,078)

Colorado: Grand Junction
> Robberies per 100k people: 36.3 (Colorado: 68.3)
> Number of robberies: 56 (Colorado: 3,964)
> Violent crimes per 100k people: 366.6 (Colorado: 423.1)
> Poverty rate: 10.7% (Colorado: 9.3%)
> Population within reporting jurisdiction: 154,127 (Colorado: 5,807,719)
[in-text-ad]

Connecticut: Norwich-New London
> Robberies per 100k people: 38.0 (Connecticut: 57.2)
> Number of robberies: 66 (Connecticut: 2,033)
> Violent crimes per 100k people: 180.1 (Connecticut: 181.6)
> Poverty rate: 7.2% (Connecticut: 10.0%)
> Population within reporting jurisdiction: 173,802 (Connecticut: 3,557,006)
[recirclink id=966311]

Delaware: Dover*
> Robberies per 100k people: 31.6 (Delaware: 70.9)
> Number of robberies: 58 (Delaware: 700)
> Violent crimes per 100k people: 442.6 (Delaware: 431.9)
> Poverty rate: 13.0% (Delaware: 11.3%)
> Population within reporting jurisdiction: 183,675 (Delaware: 986,809)
*Because Dover is the only eligible metro in Delaware, it is the metro with the fewest robberies by default.
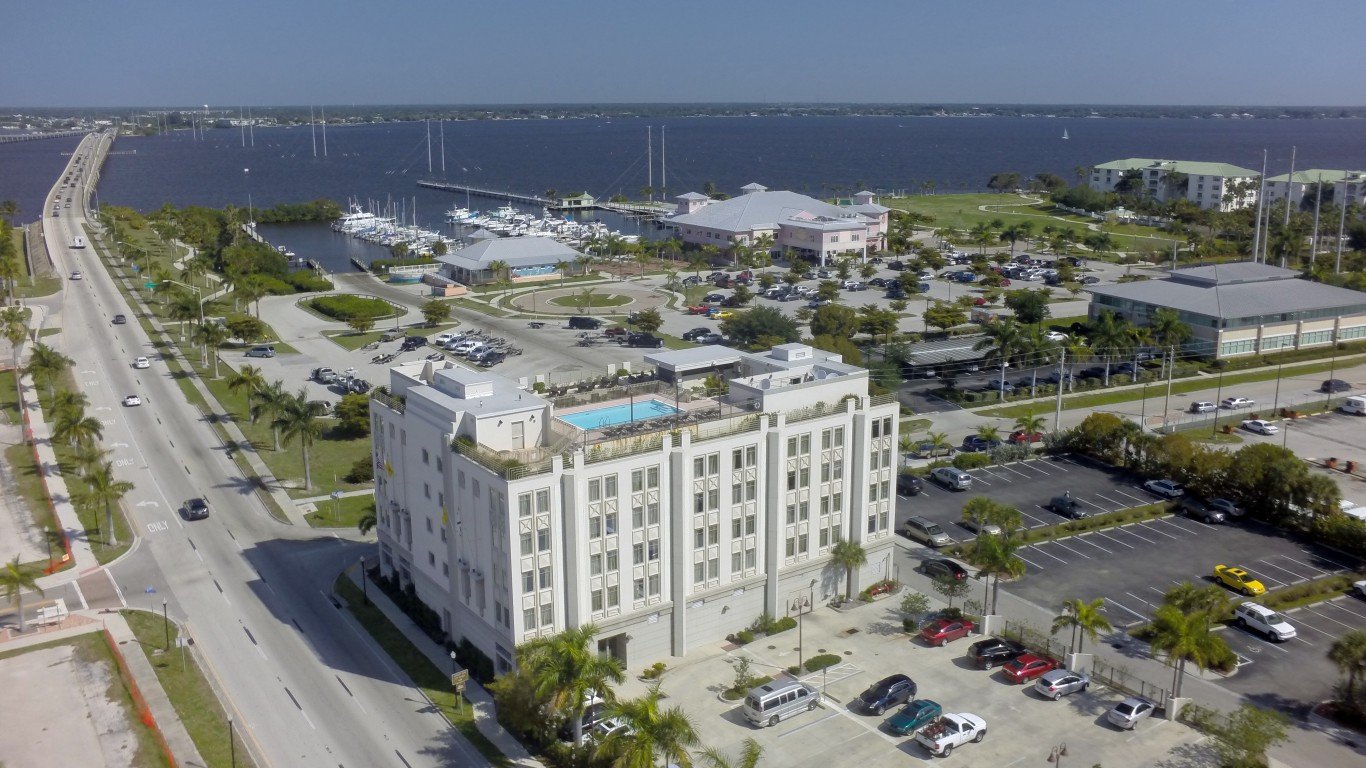
Florida: Punta Gorda
> Robberies per 100k people: 10.9 (Florida: 62.2)
> Number of robberies: 21 (Florida: 13,521)
> Violent crimes per 100k people: 152.2 (Florida: 383.6)
> Poverty rate: 12.0% (Florida: 12.7%)
> Population within reporting jurisdiction: 191,879 (Florida: 21,733,312)
[in-text-ad-2]

Georgia: Gainesville
> Robberies per 100k people: 29.0 (Georgia: 65.5)
> Number of robberies: 60 (Georgia: 7,016)
> Violent crimes per 100k people: 231.4 (Georgia: 400.1)
> Poverty rate: 14.5% (Georgia: 13.3%)
> Population within reporting jurisdiction: 207,015 (Georgia: 10,710,017)

Hawaii: Kahului-Wailuku-Lahaina*
> Robberies per 100k people: 35.3 (Hawaii: 61.6)
> Number of robberies: 59 (Hawaii: 867)
> Violent crimes per 100k people: 226.7 (Hawaii: 254.2)
> Poverty rate: 11.9% (Hawaii: 9.3%)
> Population within reporting jurisdiction: 167,178 (Hawaii: 1,407,006)
*Because Kahului-Wailuku-Lahaina is the only eligible metro in Hawaii, it is the metro with the fewest robberies by default.
[in-text-ad]

Idaho: Coeur d’Alene
> Robberies per 100k people: 9.4 (Idaho: 9.5)
> Number of robberies: 16 (Idaho: 174)
> Violent crimes per 100k people: 201.5 (Idaho: 242.6)
> Poverty rate: 10.0% (Idaho: 11.2%)
> Population within reporting jurisdiction: 170,237 (Idaho: 1,826,913)
[recirclink id=954316]

Illinois: Bloomington
> Robberies per 100k people: 26.3 (Illinois: 97.4)
> Number of robberies: 45 (Illinois: 12,261)
> Violent crimes per 100k people: 282.8 (Illinois: 425.9)
> Poverty rate: 15.7% (Illinois: 11.5%)
> Population within reporting jurisdiction: 170,810 (Illinois: 12,587,530)

Indiana: Evansville
> Robberies per 100k people: 45.4 (Indiana: 62.4)
> Number of robberies: 143 (Indiana: 4,215)
> Violent crimes per 100k people: 508.0 (Indiana: 357.7)
> Poverty rate: 12.9% (Indiana: 11.9%)
> Population within reporting jurisdiction: 315,160 (Indiana: 6,754,953)
[in-text-ad-2]

Iowa: Ames
> Robberies per 100k people: 15.3 (Iowa: 29.8)
> Number of robberies: 19 (Iowa: 943)
> Violent crimes per 100k people: 183.8 (Iowa: 303.5)
> Poverty rate: 15.6% (Iowa: 11.2%)
> Population within reporting jurisdiction: 124,033 (Iowa: 3,163,561)

Kansas: Manhattan*
> Robberies per 100k people: 16.1 (Kansas: 31.8)
> Number of robberies: 21 (Kansas: 928)
> Violent crimes per 100k people: 376.1 (Kansas: 425.0)
> Poverty rate: 18.6% (Kansas: 11.4%)
> Population within reporting jurisdiction: 130,281 (Kansas: 2,913,805)
*Because Manhattan is the only eligible metro in Kansas, it is the metro with the fewest robberies by default.
[in-text-ad]

Kentucky: Elizabethtown-Fort Knox
> Robberies per 100k people: 16.2 (Kentucky: 52.9)
> Number of robberies: 25 (Kentucky: 2,369)
> Violent crimes per 100k people: 100.5 (Kentucky: 259.1)
> Poverty rate: 11.1% (Kentucky: 16.3%)
> Population within reporting jurisdiction: 154,232 (Kentucky: 4,477,251)
[recirclink id=950673]

Louisiana: Lake Charles
> Robberies per 100k people: 44.6 (Louisiana: 80.7)
> Number of robberies: 94 (Louisiana: 3,747)
> Violent crimes per 100k people: 788.7 (Louisiana: 639.4)
> Poverty rate: 20.4% (Louisiana: 19.0%)
> Population within reporting jurisdiction: 210,851 (Louisiana: 4,645,318)

Maine: Bangor
> Robberies per 100k people: 10.5 (Maine: 12.6)
> Number of robberies: 16 (Maine: 170)
> Violent crimes per 100k people: 57.7 (Maine: 108.6)
> Poverty rate: 12.1% (Maine: 10.9%)
> Population within reporting jurisdiction: 152,409 (Maine: 1,350,141)
[in-text-ad-2]

Maryland: California-Lexington Park*
> Robberies per 100k people: 33.3 (Maryland: 118.5)
> Number of robberies: 38 (Maryland: 7,174)
> Violent crimes per 100k people: 196.4 (Maryland: 399.9)
> Poverty rate: 7.3% (Maryland: 9.0%)
> Population within reporting jurisdiction: 114,031 (Maryland: 6,055,802)
*Because California-Lexington Park is the only eligible metro in Maryland, it is the metro with the fewest robberies by default.

Massachusetts: Barnstable Town
> Robberies per 100k people: 13.2 (Massachusetts: 43.7)
> Number of robberies: 28 (Massachusetts: 3,015)
> Violent crimes per 100k people: 300.2 (Massachusetts: 308.8)
> Poverty rate: 5.2% (Massachusetts: 9.4%)
> Population within reporting jurisdiction: 211,545 (Massachusetts: 6,893,574)
[in-text-ad]

Michigan: Midland
> Robberies per 100k people: 1.2 (Michigan: 44.5)
> Number of robberies: 1 (Michigan: 4,438)
> Violent crimes per 100k people: 144.9 (Michigan: 478.0)
> Poverty rate: 9.3% (Michigan: 13.0%)
> Population within reporting jurisdiction: 82,820 (Michigan: 9,966,555)
[recirclink id=948659]

Minnesota: Mankato
> Robberies per 100k people: 14.7 (Minnesota: 68.5)
> Number of robberies: 15 (Minnesota: 3,877)
> Violent crimes per 100k people: 187.0 (Minnesota: 277.5)
> Poverty rate: 16.1% (Minnesota: 9.0%)
> Population within reporting jurisdiction: 102,134 (Minnesota: 5,657,342)

Mississippi: Hattiesburg*
> Robberies per 100k people: 25.5 (Mississippi: 47.8)
> Number of robberies: 43 (Mississippi: 1,419)
> Violent crimes per 100k people: 249.8 (Mississippi: 291.2)
> Poverty rate: 22.5% (Mississippi: 19.6%)
> Population within reporting jurisdiction: 168,941 (Mississippi: 2,966,786)
*Because Hattiesburg is the only eligible metro in Mississippi, it is the metro with the fewest robberies by default.
[in-text-ad-2]

Missouri: Jefferson City
> Robberies per 100k people: 13.2 (Missouri: 74.4)
> Number of robberies: 20 (Missouri: 4,575)
> Violent crimes per 100k people: 165.9 (Missouri: 542.7)
> Poverty rate: 10.8% (Missouri: 12.9%)
> Population within reporting jurisdiction: 151,302 (Missouri: 6,151,548)

Montana: Missoula
> Robberies per 100k people: 27.3 (Montana: 25.8)
> Number of robberies: 33 (Montana: 279)
> Violent crimes per 100k people: 404.0 (Montana: 469.8)
> Poverty rate: 11.5% (Montana: 12.6%)
> Population within reporting jurisdiction: 121,047 (Montana: 1,080,577)
[in-text-ad]

Nebraska: Grand Island
> Robberies per 100k people: 22.5 (Nebraska: 41.2)
> Number of robberies: 17 (Nebraska: 799)
> Violent crimes per 100k people: 340.5 (Nebraska: 334.1)
> Poverty rate: 10.3% (Nebraska: 9.9%)
> Population within reporting jurisdiction: 75,484 (Nebraska: 1,937,552)
[recirclink id=968539]

Nevada: Carson City
> Robberies per 100k people: 23.1 (Nevada: 88.7)
> Number of robberies: 13 (Nevada: 2,785)
> Violent crimes per 100k people: 400.0 (Nevada: 460.3)
> Poverty rate: 12.5% (Nevada: 12.5%)
> Population within reporting jurisdiction: 56,250 (Nevada: 3,138,259)

New Hampshire: Manchester-Nashua*
> Robberies per 100k people: 32.7 (New Hampshire: 20.5)
> Number of robberies: 137 (New Hampshire: 280)
> Violent crimes per 100k people: 217.7 (New Hampshire: 146.4)
> Poverty rate: 7.3% (New Hampshire: 7.3%)
> Population within reporting jurisdiction: 419,347 (New Hampshire: 1,366,275)
*Because Manchester-Nashua is the only eligible metro in New Hampshire, it is the metro with the fewest robberies by default.
[in-text-ad-2]
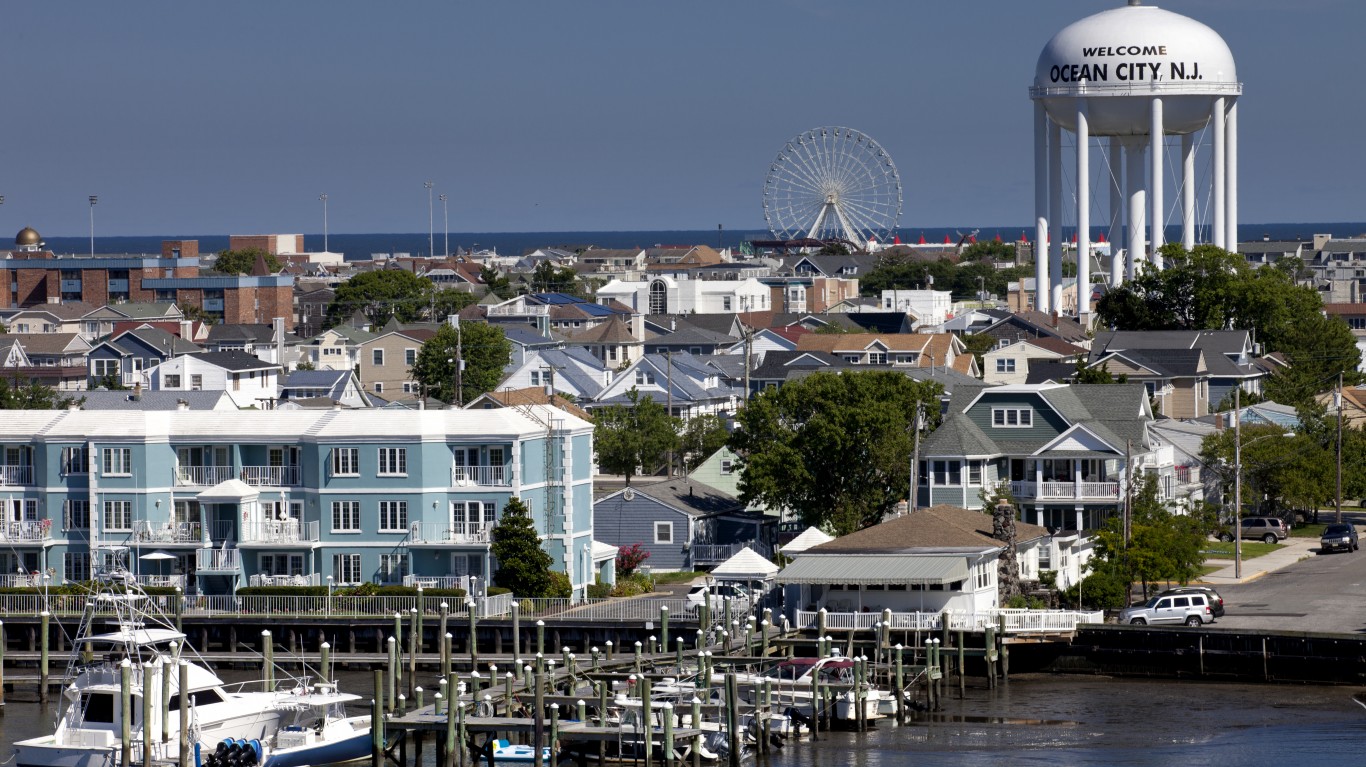
New Jersey: Ocean City
> Robberies per 100k people: 27.4 (New Jersey: 49.4)
> Number of robberies: 25 (New Jersey: 4,384)
> Violent crimes per 100k people: 168.5 (New Jersey: 195.4)
> Poverty rate: 8.8% (New Jersey: 9.2%)
> Population within reporting jurisdiction: 91,384 (New Jersey: 8,882,371)

New Mexico: Farmington
> Robberies per 100k people: 41.3 (New Mexico: 99.0)
> Number of robberies: 51 (New Mexico: 2,086)
> Violent crimes per 100k people: 661.0 (New Mexico: 778.3)
> Poverty rate: 21.2% (New Mexico: 18.2%)
> Population within reporting jurisdiction: 123,608 (New Mexico: 2,106,319)
[in-text-ad]
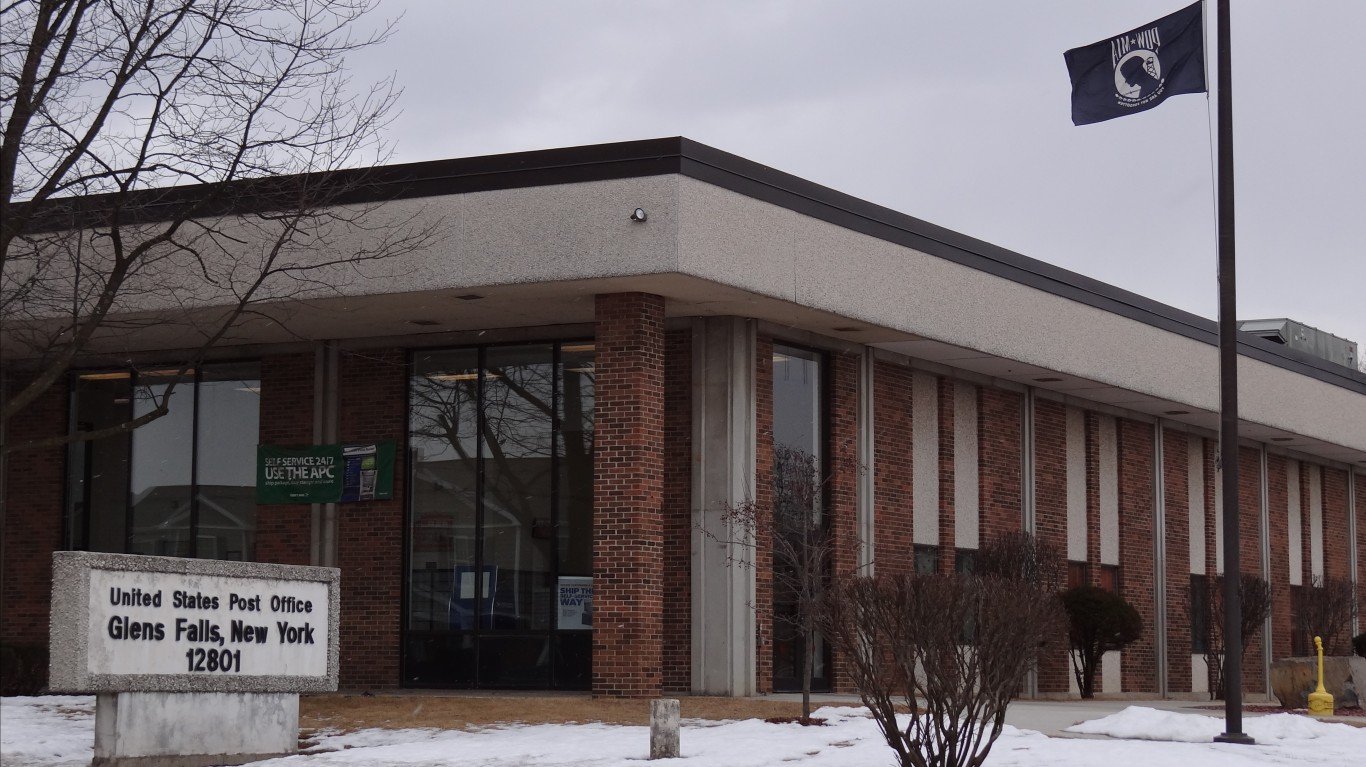
New York: Glens Falls
> Robberies per 100k people: 6.5 (New York: 90.6)
> Number of robberies: 8 (New York: 17,525)
> Violent crimes per 100k people: 125.9 (New York: 363.8)
> Poverty rate: 10.8% (New York: 13.0%)
> Population within reporting jurisdiction: 123,934 (New York: 19,336,776)
[recirclink id=966311]

North Carolina: Jacksonville
> Robberies per 100k people: 20.1 (North Carolina: 69.2)
> Number of robberies: 40 (North Carolina: 7,340)
> Violent crimes per 100k people: 210.3 (North Carolina: 419.3)
> Poverty rate: 11.1% (North Carolina: 13.6%)
> Population within reporting jurisdiction: 199,234 (North Carolina: 10,600,823)

North Dakota: Grand Forks
> Robberies per 100k people: 15.0 (North Dakota: 19.7)
> Number of robberies: 15 (North Dakota: 151)
> Violent crimes per 100k people: 232.6 (North Dakota: 329.0)
> Poverty rate: 13.9% (North Dakota: 10.6%)
> Population within reporting jurisdiction: 100,189 (North Dakota: 765,309)
[in-text-ad-2]

Ohio: Akron
> Robberies per 100k people: 50.4 (Ohio: 66.9)
> Number of robberies: 354 (Ohio: 7,826)
> Violent crimes per 100k people: 378.4 (Ohio: 308.8)
> Poverty rate: 13.9% (Ohio: 13.1%)
> Population within reporting jurisdiction: 702,634 (Ohio: 11,693,217)

Oklahoma: Enid
> Robberies per 100k people: 24.6 (Oklahoma: 59.1)
> Number of robberies: 15 (Oklahoma: 2,351)
> Violent crimes per 100k people: 415.8 (Oklahoma: 458.6)
> Poverty rate: 10.1% (Oklahoma: 15.2%)
> Population within reporting jurisdiction: 61,092 (Oklahoma: 3,980,783)
[in-text-ad]

Oregon: Albany-Lebanon
> Robberies per 100k people: 23.7 (Oregon: 51.4)
> Number of robberies: 31 (Oregon: 2,180)
> Violent crimes per 100k people: 149.3 (Oregon: 291.9)
> Poverty rate: 13.3% (Oregon: 11.4%)
> Population within reporting jurisdiction: 130,611 (Oregon: 4,241,507)
[recirclink id=954316]

Pennsylvania: No eligible metros
> Robberies per 100k people: N/A (Pennsylvania: 83.9)
> Number of robberies: N/A (Pennsylvania: 10,728)
> Violent crimes per 100k people: N/A (Pennsylvania: 389.5)
> Poverty rate: N/A (Pennsylvania: 12.0%)
> Population within reporting jurisdiction: N/A (Pennsylvania: 12,783,254)

Rhode Island: Providence-Warwick*
> Robberies per 100k people: 37.7 (Rhode Island: 31.8)
> Number of robberies: 611 (Rhode Island: 336)
> Violent crimes per 100k people: 285.6 (Rhode Island: 230.8)
> Poverty rate: 11.0% (Rhode Island: 10.8%)
> Population within reporting jurisdiction: 1,621,159 (Rhode Island: 1,057,125)
*Because Providence-Warwick is the only eligible metro in Rhode Island, it is the metro with the fewest robberies by default.
[in-text-ad-2]

South Carolina: Hilton Head Island-Bluffton
> Robberies per 100k people: 29.6 (South Carolina: 59.8)
> Number of robberies: 67 (South Carolina: 3,122)
> Violent crimes per 100k people: 326.9 (South Carolina: 530.7)
> Poverty rate: 10.8% (South Carolina: 13.8%)
> Population within reporting jurisdiction: 226,652 (South Carolina: 5,218,040)

South Dakota: Sioux Falls
> Robberies per 100k people: 39.9 (South Dakota: 30.7)
> Number of robberies: 109 (South Dakota: 274)
> Violent crimes per 100k people: 477.7 (South Dakota: 501.4)
> Poverty rate: 7.7% (South Dakota: 11.9%)
> Population within reporting jurisdiction: 273,001 (South Dakota: 892,717)
[in-text-ad]

Tennessee: Kingsport-Bristol
> Robberies per 100k people: 19.2 (Tennessee: 81.0)
> Number of robberies: 59 (Tennessee: 5,575)
> Violent crimes per 100k people: 363.6 (Tennessee: 672.7)
> Poverty rate: 15.5% (Tennessee: 13.9%)
> Population within reporting jurisdiction: 306,891 (Tennessee: 6,886,834)

Texas: Sherman-Denison
> Robberies per 100k people: 29.1 (Texas: 91.4)
> Number of robberies: 40 (Texas: 26,834)
> Violent crimes per 100k people: 285.0 (Texas: 446.5)
> Poverty rate: 11.2% (Texas: 13.6%)
> Population within reporting jurisdiction: 137,545 (Texas: 29,360,759)

Utah: Logan
> Robberies per 100k people: 4.9 (Utah: 41.9)
> Number of robberies: 7 (Utah: 1,362)
> Violent crimes per 100k people: 118.2 (Utah: 260.7)
> Poverty rate: 14.7% (Utah: 8.9%)
> Population within reporting jurisdiction: 143,828 (Utah: 3,249,879)
[in-text-ad-2]

Vermont: Burlington-South Burlington*
> Robberies per 100k people: 14.5 (Vermont: 10.3)
> Number of robberies: 32 (Vermont: 64)
> Violent crimes per 100k people: 198.4 (Vermont: 173.4)
> Poverty rate: 11.4% (Vermont: 10.2%)
> Population within reporting jurisdiction: 221,248 (Vermont: 623,347)
*Because Burlington-South Burlington is the only eligible metro in Vermont, it is the metro with the fewest robberies by default.

Virginia: Winchester
> Robberies per 100k people: 11.3 (Virginia: 34.3)
> Number of robberies: 16 (Virginia: 2,947)
> Violent crimes per 100k people: 150.8 (Virginia: 208.7)
> Poverty rate: 8.6% (Virginia: 9.9%)
> Population within reporting jurisdiction: 141,877 (Virginia: 8,590,563)
[in-text-ad]

Washington: Wenatchee
> Robberies per 100k people: 13.2 (Washington: 67.4)
> Number of robberies: 16 (Washington: 5,183)
> Violent crimes per 100k people: 116.2 (Washington: 293.7)
> Poverty rate: 13.0% (Washington: 9.8%)
> Population within reporting jurisdiction: 121,320 (Washington: 7,693,612)
[recirclink id=950673]
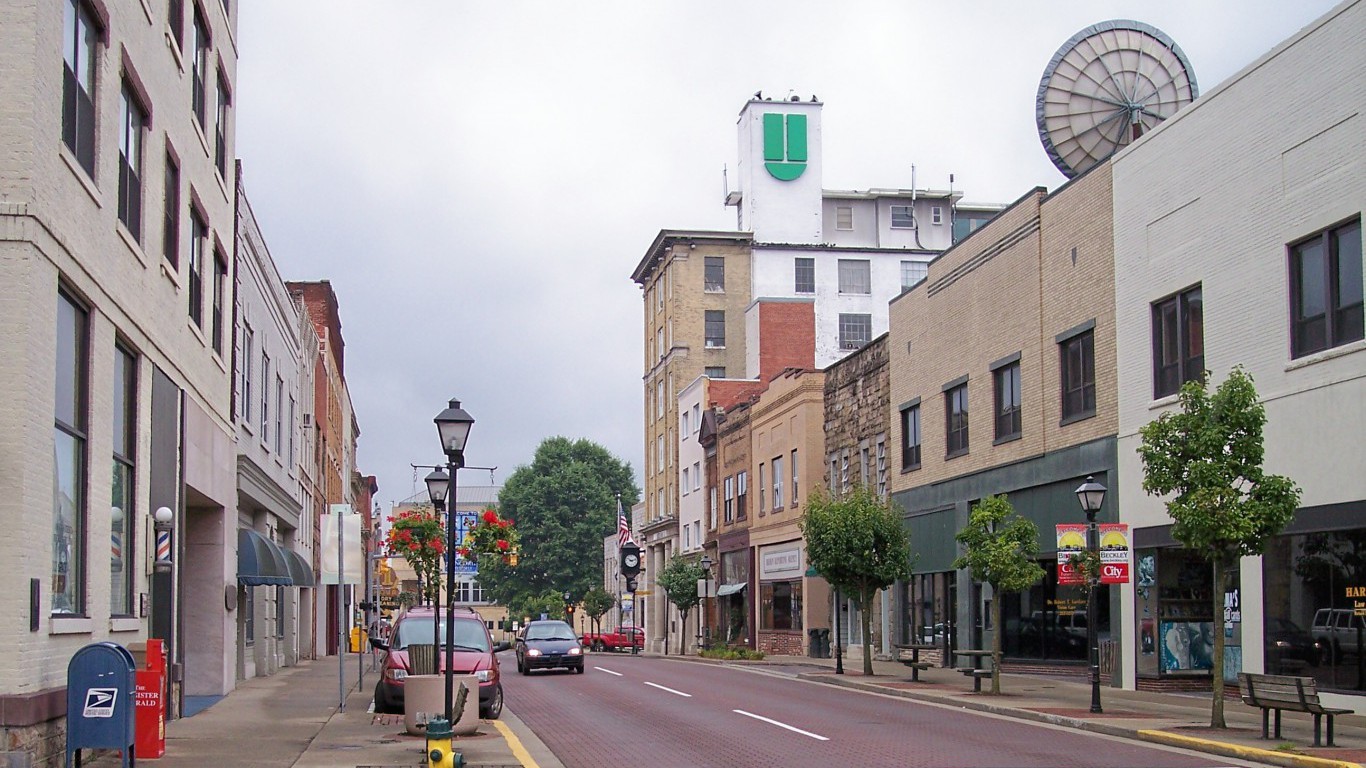
West Virginia: Beckley
> Robberies per 100k people: 19.2 (West Virginia: 20.7)
> Number of robberies: 22 (West Virginia: 369)
> Violent crimes per 100k people: 377.4 (West Virginia: 355.9)
> Poverty rate: 17.9% (West Virginia: 16.0%)
> Population within reporting jurisdiction: 114,718 (West Virginia: 1,784,787)

Wisconsin: Fond du Lac
> Robberies per 100k people: 9.7 (Wisconsin: 52.8)
> Number of robberies: 10 (Wisconsin: 3,081)
> Violent crimes per 100k people: 174.9 (Wisconsin: 323.4)
> Poverty rate: 6.2% (Wisconsin: 10.4%)
> Population within reporting jurisdiction: 103,517 (Wisconsin: 5,832,655)
[in-text-ad-2]

Wyoming: Casper
> Robberies per 100k people: 19.8 (Wyoming: 11.3)
> Number of robberies: 16 (Wyoming: 66)
> Violent crimes per 100k people: 227.0 (Wyoming: 234.2)
> Poverty rate: 8.6% (Wyoming: 10.1%)
> Population within reporting jurisdiction: 80,625 (Wyoming: 582,328)
Methodology
To determine the metro area with the fewest robberies in each state, 24/7 Wall St. reviewed robbery figures from the FBI’s 2020 Uniform Crime Report. The rate of robberies per 100,000 people was calculated using population data from the FBI.
Limited data were available in the 2020 UCR for areas in Alabama, Maryland, Pennsylvania, and Illinois, though these states were not excluded from analysis. Only metro areas for which the boundaries defined by the FBI match the boundaries as defined by the U.S. Census Bureau were considered.
Additional information on the violent crime rate and the population within the jurisdictions reporting figures to the FBI are also from the 2020 FBI UCR. Poverty rates are one-year estimates from the 2019 ACS.
Contact [email protected] for any questions or corrections.