SCHD Has a Little-Known International Twin That Pays More, and Almost Nobody Owns It
SCHD devotees have obsessed over its domestic dividend formula for years, but a sibling fund using the same screening playbook on international markets quietly pays more and holds less than a fraction of the attention.


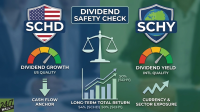
The Schwab U.S. Dividend Equity ETF (NYSEARCA:SCHD) has become the default income sleeve for millions of American portfolios, but its international sibling barely registers with the same audience. The Schwab International Dividend Equity ETF (NYSEARCA:SCHY) applies the same Dow Jones dividend-screening playbook to developed markets outside the United States, and it currently distributes at a higher rate than its domestic cousin.
For investors willing to look past the home-country tilt, two other funds round out a credible international income shelf: the iShares International Select Dividend ETF (BATS:IDV) for concentrated high-yield exposure, and the Vanguard International High Dividend Yield ETF (NASDAQ:VYMI) for the broadest reach across developed and emerging markets. Each fund answers a different question about how much yield, concentration, and geographic breadth an income investor actually wants.
Why International Dividends Look Different Right Now
Payout ratios in Europe, Japan, and Australia have historically run higher than in the U.S., where buybacks absorb a larger share of shareholder returns. That gap widened after several years of dollar weakness and rising profitability at European banks. Non-U.S. dividend funds have also outperformed their American peers over the past year: SCHY is up 25%, IDV has gained 29%, and VYMI has advanced 31%.
SCHY: The Overlooked Twin
The current portfolio reads like a global blue-chip roster. Top positions include BHP Group, TotalEnergies, and Eni at roughly 5% each, with Allianz, Deutsche Post, British American Tobacco, and Roche also carrying weightings above 3.5%. Geographic exposure runs across France, Germany, the UK, Australia, Switzerland, and Italy, with smaller sleeves in Japan, Singapore, and select emerging markets.
Income is the reason to hold it. The ETF carries an annual yield of roughly 6.3% with an expense ratio of 0.09%, matching SCHD’s fee line. The most recent quarterly payment was $0.36, the largest single distribution in the fund’s history, and the trailing twelve-month payout continues a steady climb from prior years.
The tradeoff sits in the methodology. Screening for dividend stability produces a portfolio tilted toward mature European and Australian names, so SCHY carries meaningful sector concentration in energy, financials, and consumer staples. Investors looking for growth-oriented exposure will find little of it here.
IDV: The Concentrated Yield Play
The fund carries an expense ratio of 0.50%, higher than the Schwab and Vanguard alternatives, and its concentration is a feature rather than a bug. Around 100 names, dominated by European financials, UK integrated oils, Australian miners, and utility operators. That composition drives both yield and volatility.
Distributions swing sharply from quarter to quarter, rising from $0.20 in March 2026 to $1.10 in June 2026, so IDV suits investors who care more about annual income totals than a smooth monthly paycheck. The fund has returned 166% on a total-return basis over ten years, benefiting recently from a rerating in European bank stocks.
VYMI: The Broad Diversifier
The diversification changes the return profile. VYMI has gained 31% over the past year, tracking closer to the broad international market than to any single country or sector bet. The trailing distribution of $3.60 against a share price near $104 produces a yield of around 3.5%, lower than the other two but backed by a portfolio in which no single holding dominates.
The emerging-markets sleeve, roughly a fifth of assets, includes Taiwanese semiconductors, Chinese banks, and Brazilian energy names. That adds currency and political risk to the return stream, and it also captures dividend payers that appear in almost no other broad-based US-listed ETF.
Choosing Between the Three
The closest international companion to SCHD’s methodology is SCHY’s methodology. The screening approach is familiar, the fee is identical, and the current payout profile addresses the one gap that SCHD holders often cite.
For an income investor whose primary metric is annual dividend dollars per share and who can tolerate lumpy quarterly payments, IDV will be harder to beat, provided the higher expense ratio and concentration in European financials are acceptable.
The investor building a single international sleeve within a total market portfolio is the one for whom VYMI fits. The broader diversification and emerging markets exposure trade some current yield for a portfolio that behaves more like a global dividend index than a targeted bet on any one region.
Contact [email protected] for any questions or corrections.
David Beren has been a Flywheel Publishing contributor since 2022. Writing for 24/7 Wall St. since 2023, David loves to write about topics of all shapes and sizes. As a technology expert, David focuses heavily on consumer electronics brands, automobiles, and general technology. He has previously written for LifeWire, formerly About.com. As a part-time freelance writer, David’s “day job” has been working on and leading social media for multiple Fortune 100 brands. David loves the flexibility of this field and its ability to reach customers exactly where they like to spend their time. Additionally, David previously published his own blog, TmoNews.com, which reached 3 million readers in its first year. In addition to freelance and social media work, David loves to spend time with his family and children and relive the glory days of video game consoles by playing any retro game console he can get his hands on.