
The average cost of a college education in the United States is $35,720 a year — three times higher than it was two decades ago. While rising tuition costs are discouraging many Americans from enrolling, a college education is an investment that can increase access to career opportunities, improve job security, and increase earning potential.
Nationwide, an estimated 32.1% of American adults 25 and older have a bachelor’s degree or higher. Educational attainment rates vary considerably across the country, however, and in every state, there is at least one ZIP code where the share of adults with a bachelor’s degree is well below the national average.
Using education data from the U.S. Census Bureau, 24/7 Wall St. identified the least educated ZIP code in every state.
According to the Bureau of Labor Statistics, the unemployment rate among adults with a four-year college education was 5.5% 2020. Meanwhile, the jobless rate among those with no more than a high school diploma was 9.0%. In all but eight ZIP codes on this list, the five-year average unemployment rate among the 25 to 64 year population is higher than the comparable jobless rate across the state as a whole.
In addition to being better protected from unemployment, Americans with a bachelor’s degree also tend to have higher salaries. The average weekly wage for a college-educated worker in the United States is about 67% higher than it is for those with no more than a high school diploma — and in places with lower educational attainment, incomes also tend to be lower than average. In nearly every ZIP code on this list, the typical household earns less in a year than the statewide median household income.
Click here to see every state’s least educated ZIP code
Click here to see our detailed methodology
Alabama: 36048
> Location: Louisville
> Adults with at least a bachelor’s degree: 5.3% (Alabama: 25.5%)
> Adults with at least a high school diploma or equivalent: 62.3% (Alabama: 86.2%)
> Median household income: $31,250 (Alabama: $50,536)
> Estimated unemployment rate 2015-2019: 6.3% (Alabama: 5.9%)
> Population: 1,513
[in-text-ad]

Alaska: 99926
> Location: Metlakatla
> Adults with at least a bachelor’s degree: 10.4% (Alaska: 29.6%)
> Adults with at least a high school diploma or equivalent: 92.0% (Alaska: 92.8%)
> Median household income: $56,188 (Alaska: $77,640)
> Estimated unemployment rate 2015-2019: 17.7% (Alaska: 7.2%)
> Population: 1,654
[recirclink id=878400]

Arizona: 86020
> Location: Cameron
> Adults with at least a bachelor’s degree: 2.9% (Arizona: 29.5%)
> Adults with at least a high school diploma or equivalent: 69.9% (Arizona: 87.1%)
> Median household income: $33,958 (Arizona: $58,945)
> Estimated unemployment rate 2015-2019: 10.9% (Arizona: 5.9%)
> Population: 1,955
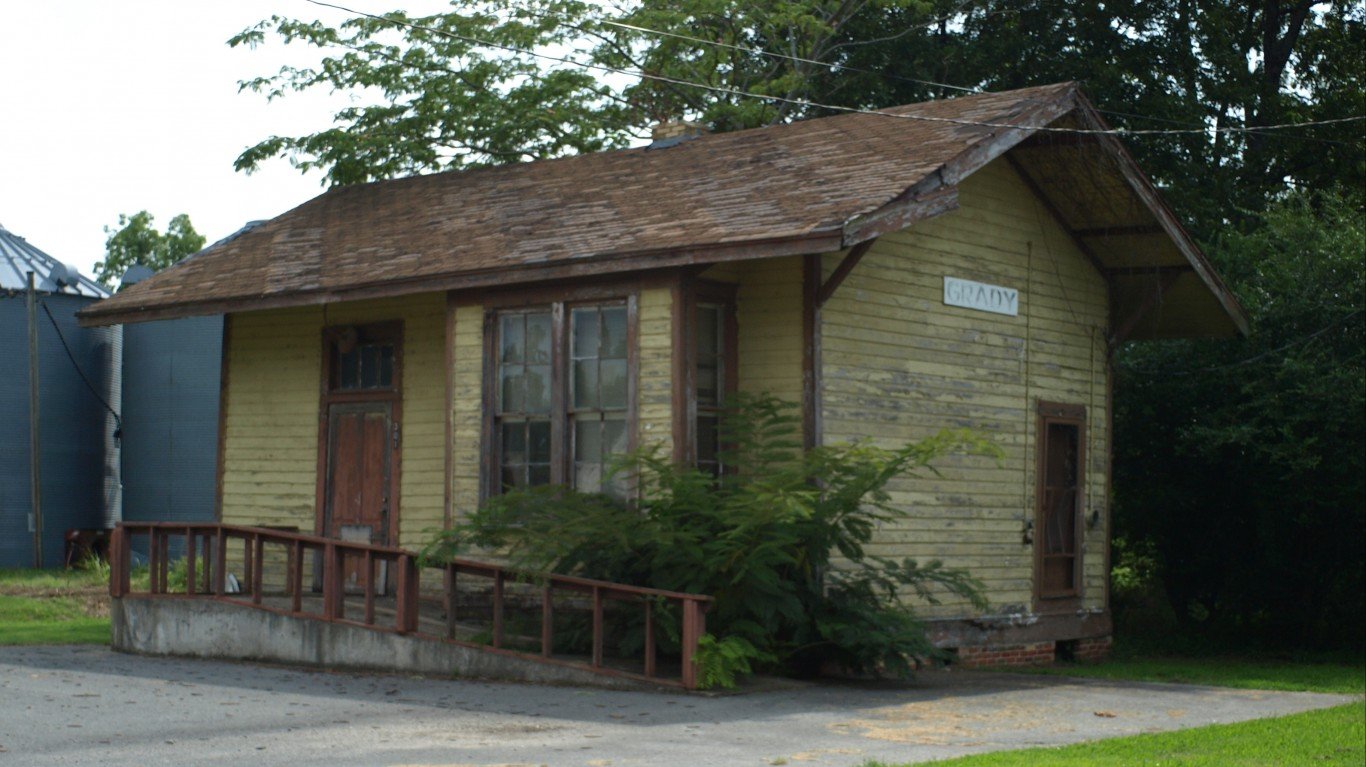
Arkansas: 71644
> Location: Grady
> Adults with at least a bachelor’s degree: 2.2% (Arkansas: 23.0%)
> Adults with at least a high school diploma or equivalent: 77.8% (Arkansas: 86.6%)
> Median household income: $32,723 (Arkansas: $47,597)
> Estimated unemployment rate 2015-2019: 2.0% (Arkansas: 5.1%)
> Population: 5,503
[in-text-ad-2]

California: 92233
> Location: Calipatria
> Adults with at least a bachelor’s degree: 1.6% (California: 33.9%)
> Adults with at least a high school diploma or equivalent: 61.3% (California: 83.3%)
> Median household income: $37,009 (California: $75,235)
> Estimated unemployment rate 2015-2019: 20.3% (California: 6.1%)
> Population: 7,509
Colorado: 80828
> Location: Limon
> Adults with at least a bachelor’s degree: 8.6% (Colorado: 40.9%)
> Adults with at least a high school diploma or equivalent: 90.8% (Colorado: 91.7%)
> Median household income: $48,219 (Colorado: $72,331)
> Estimated unemployment rate 2015-2019: 3.6% (Colorado: 4.3%)
> Population: 3,605
[in-text-ad]

Connecticut: 06608
> Location: Bridgeport
> Adults with at least a bachelor’s degree: 6.8% (Connecticut: 39.3%)
> Adults with at least a high school diploma or equivalent: 64.0% (Connecticut: 90.6%)
> Median household income: $34,743 (Connecticut: $78,444)
> Estimated unemployment rate 2015-2019: 16.6% (Connecticut: 6.0%)
> Population: 14,263
[recirclink id=912448]
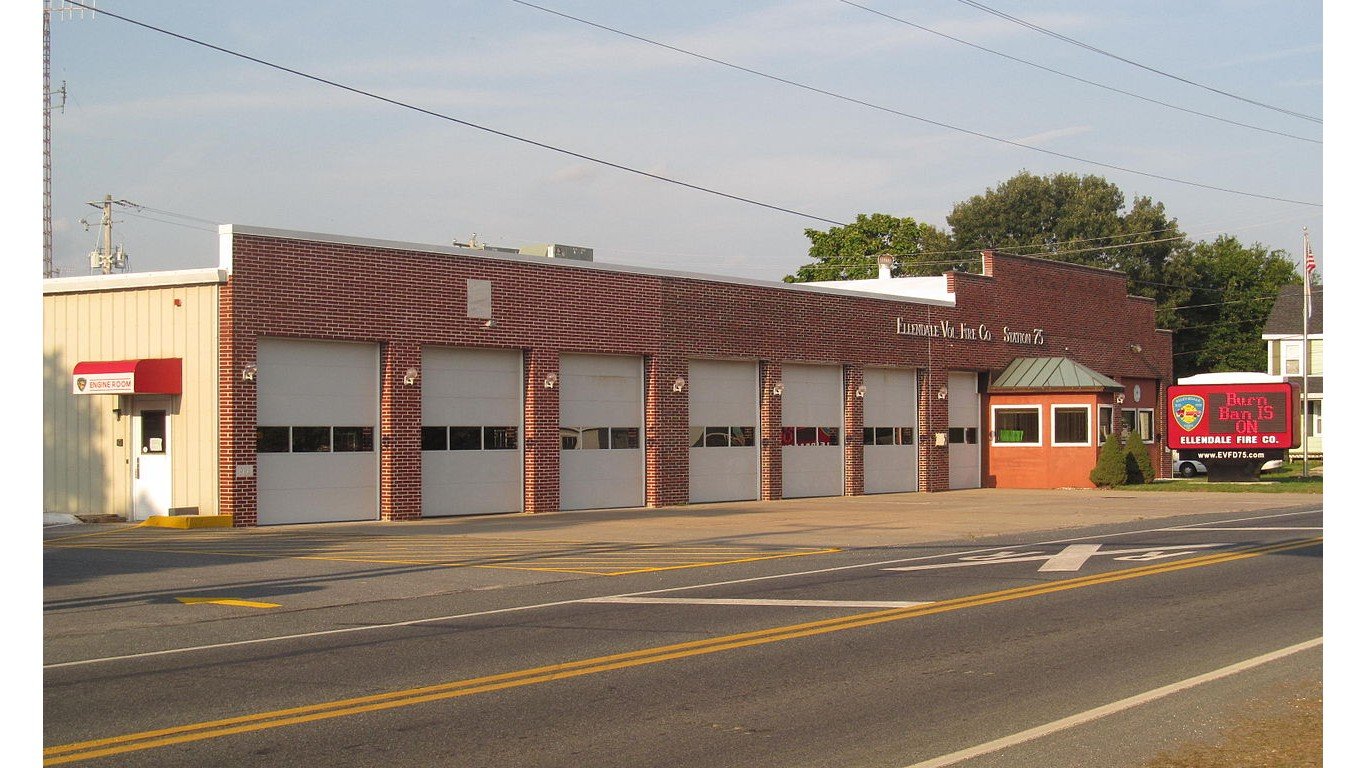
Delaware: 19941
> Location: Ellendale
> Adults with at least a bachelor’s degree: 8.3% (Delaware: 32.0%)
> Adults with at least a high school diploma or equivalent: 80.3% (Delaware: 90.0%)
> Median household income: $55,547 (Delaware: $68,287)
> Estimated unemployment rate 2015-2019: 6.4% (Delaware: 5.5%)
> Population: 3,270
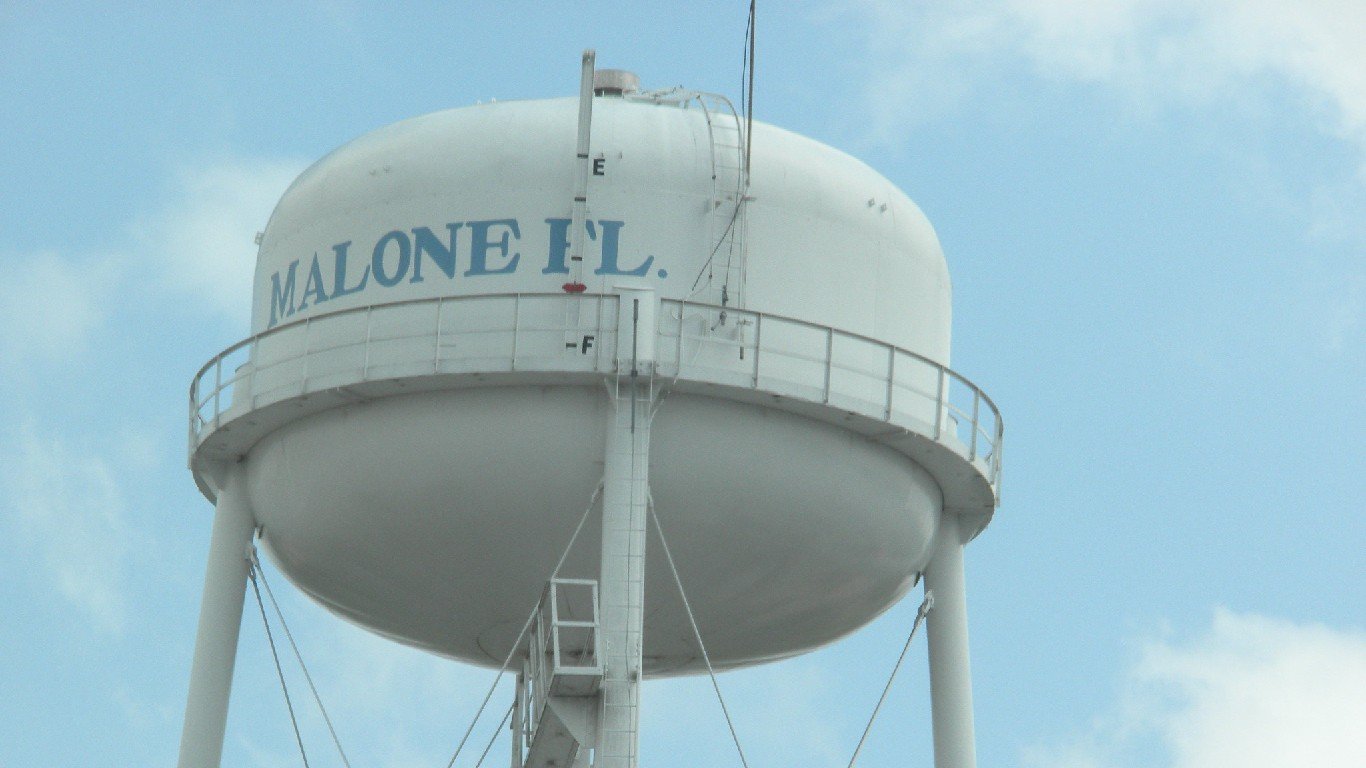
Florida: 32445
> Location: Malone
> Adults with at least a bachelor’s degree: 4.9% (Florida: 29.9%)
> Adults with at least a high school diploma or equivalent: 66.9% (Florida: 88.2%)
> Median household income: $34,638 (Florida: $55,660)
> Estimated unemployment rate 2015-2019: 2.5% (Florida: 5.6%)
> Population: 2,497
[in-text-ad-2]

Georgia: 30428
> Location: Glenwood
> Adults with at least a bachelor’s degree: 3.1% (Georgia: 31.3%)
> Adults with at least a high school diploma or equivalent: 79.9% (Georgia: 87.1%)
> Median household income: $32,409 (Georgia: $58,700)
> Estimated unemployment rate 2015-2019: 7.2% (Georgia: 5.7%)
> Population: 2,815

Hawaii: 96783
> Location: Pepeekeo
> Adults with at least a bachelor’s degree: 13.4% (Hawaii: 33.0%)
> Adults with at least a high school diploma or equivalent: 90.0% (Hawaii: 92.0%)
> Median household income: $42,375 (Hawaii: $81,275)
> Estimated unemployment rate 2015-2019: 1.5% (Hawaii: 4.3%)
> Population: 1,568
[in-text-ad]
Idaho: 83849
> Location: Osburn
> Adults with at least a bachelor’s degree: 6.4% (Idaho: 27.6%)
> Adults with at least a high school diploma or equivalent: 89.6% (Idaho: 90.8%)
> Median household income: $43,548 (Idaho: $55,785)
> Estimated unemployment rate 2015-2019: 15.5% (Idaho: 4.3%)
> Population: 2,065
[recirclink id=876190]
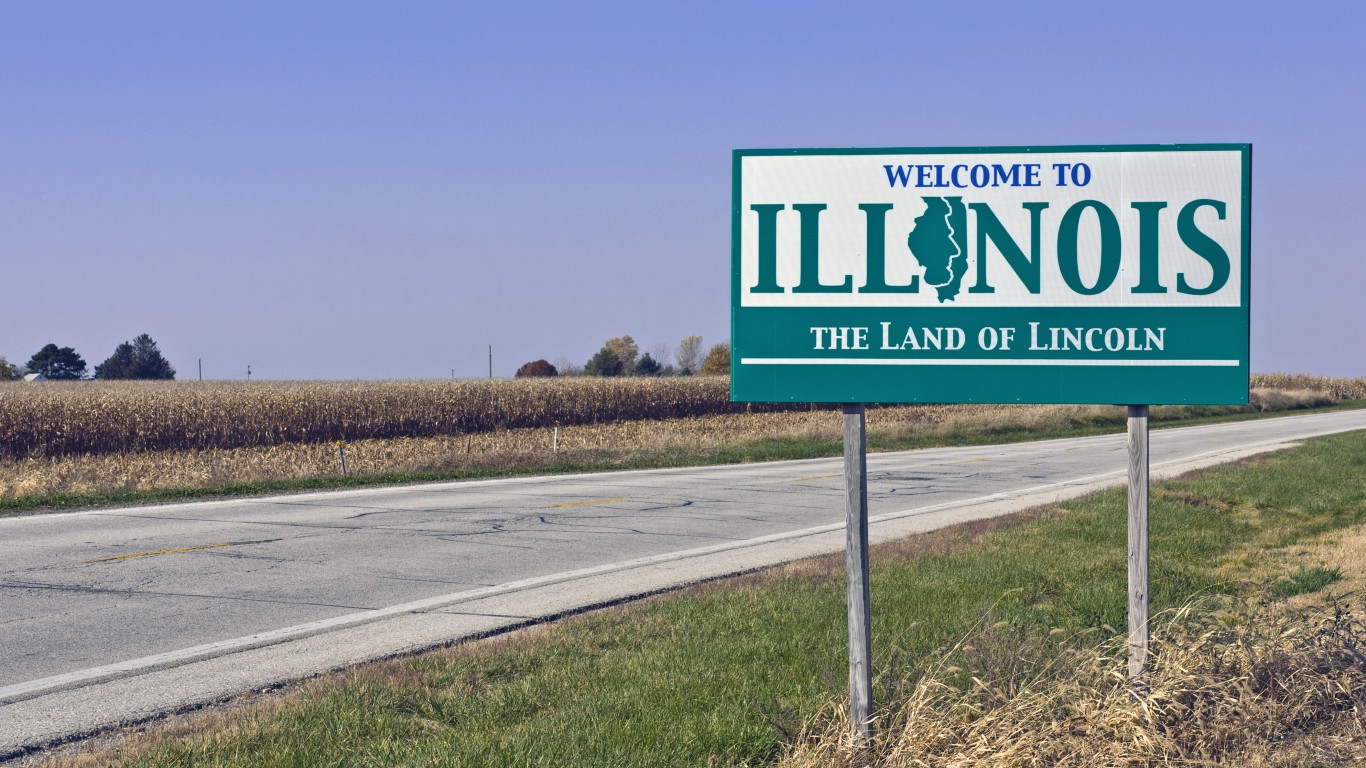
Illinois: 62846
> Location: Ina
> Adults with at least a bachelor’s degree: 2.4% (Illinois: 34.7%)
> Adults with at least a high school diploma or equivalent: 62.4% (Illinois: 89.2%)
> Median household income: $37,321 (Illinois: $65,886)
> Estimated unemployment rate 2015-2019: 5.4% (Illinois: 5.9%)
> Population: 2,613
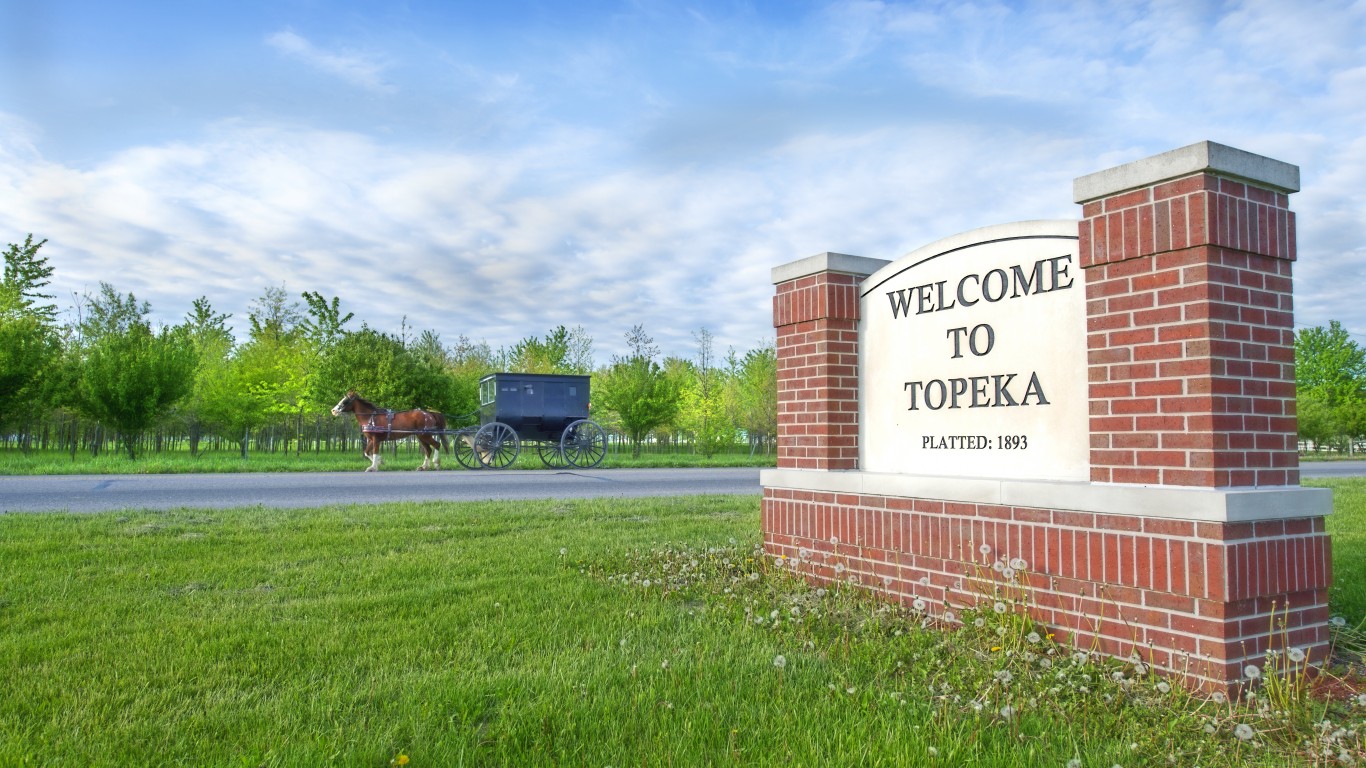
Indiana: 46571
> Location: Topeka
> Adults with at least a bachelor’s degree: 4.5% (Indiana: 26.5%)
> Adults with at least a high school diploma or equivalent: 35.6% (Indiana: 88.8%)
> Median household income: $69,896 (Indiana: $56,303)
> Estimated unemployment rate 2015-2019: 0.9% (Indiana: 4.8%)
> Population: 5,682
[in-text-ad-2]

Iowa: 51105
> Location: Sioux City
> Adults with at least a bachelor’s degree: 8.3% (Iowa: 28.6%)
> Adults with at least a high school diploma or equivalent: 70.5% (Iowa: 92.1%)
> Median household income: $48,250 (Iowa: $60,523)
> Estimated unemployment rate 2015-2019: 4.8% (Iowa: 3.7%)
> Population: 10,531
Kansas: 66607
> Location: Topeka
> Adults with at least a bachelor’s degree: 4.5% (Kansas: 33.4%)
> Adults with at least a high school diploma or equivalent: 76.5% (Kansas: 91.0%)
> Median household income: $33,610 (Kansas: $59,597)
> Estimated unemployment rate 2015-2019: 5.9% (Kansas: 4.1%)
> Population: 9,567
[in-text-ad]

Kentucky: 40828
> Location: Evarts
> Adults with at least a bachelor’s degree: 5.8% (Kentucky: 24.2%)
> Adults with at least a high school diploma or equivalent: 67.5% (Kentucky: 86.3%)
> Median household income: $27,468 (Kentucky: $50,589)
> Estimated unemployment rate 2015-2019: 15.6% (Kentucky: 5.6%)
> Population: 3,988
[recirclink id=846882]
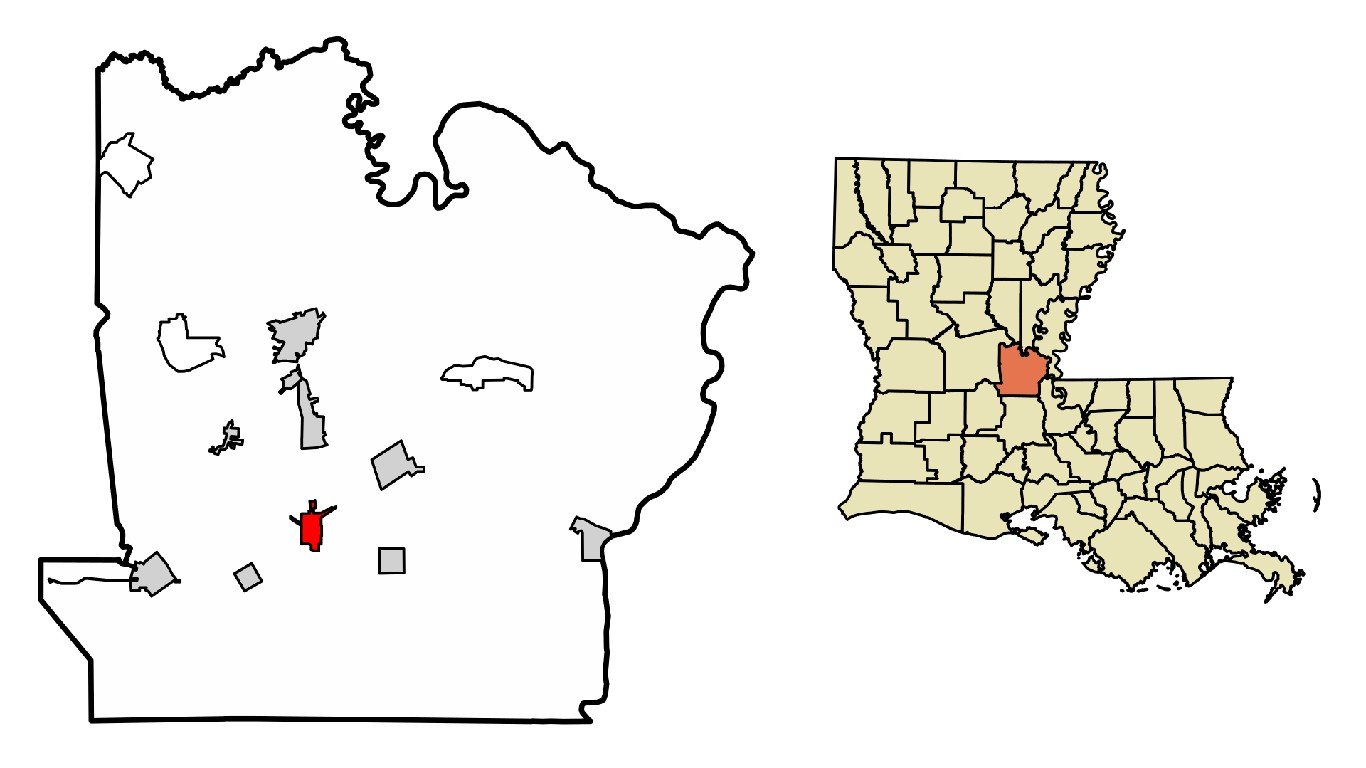
Louisiana: 71327
> Location: Cottonport
> Adults with at least a bachelor’s degree: 4.3% (Louisiana: 24.1%)
> Adults with at least a high school diploma or equivalent: 62.7% (Louisiana: 85.2%)
> Median household income: $48,047 (Louisiana: $49,469)
> Estimated unemployment rate 2015-2019: 4.2% (Louisiana: 6.5%)
> Population: 5,891
Maine: 04289
> Location: West Paris
> Adults with at least a bachelor’s degree: 8.5% (Maine: 31.8%)
> Adults with at least a high school diploma or equivalent: 90.1% (Maine: 92.6%)
> Median household income: $46,196 (Maine: $57,918)
> Estimated unemployment rate 2015-2019: 10.3% (Maine: 4.1%)
> Population: 2,339
[in-text-ad-2]

Maryland: 21746
> Location: Hagerstown
> Adults with at least a bachelor’s degree: 4.9% (Maryland: 40.2%)
> Adults with at least a high school diploma or equivalent: 73.6% (Maryland: 90.2%)
> Median household income: N/A (Maryland: $84,805)
> Estimated unemployment rate 2015-2019: N/A (Maryland: 5.1%)
> Population: 3,008

Massachusetts: 01841
> Location: Lawrence
> Adults with at least a bachelor’s degree: 8.1% (Massachusetts: 43.7%)
> Adults with at least a high school diploma or equivalent: 63.2% (Massachusetts: 90.8%)
> Median household income: $43,411 (Massachusetts: $81,215)
> Estimated unemployment rate 2015-2019: 9.8% (Massachusetts: 4.8%)
> Population: 49,367
[in-text-ad]

Michigan: 48210
> Location: Detroit
> Adults with at least a bachelor’s degree: 5.1% (Michigan: 29.1%)
> Adults with at least a high school diploma or equivalent: 49.4% (Michigan: 90.8%)
> Median household income: $30,142 (Michigan: $57,144)
> Estimated unemployment rate 2015-2019: 13.0% (Michigan: 5.9%)
> Population: 30,046
[recirclink id=878400]
Minnesota: 56446
> Location: Eagle Bend
> Adults with at least a bachelor’s degree: 8.4% (Minnesota: 36.1%)
> Adults with at least a high school diploma or equivalent: 86.8% (Minnesota: 93.1%)
> Median household income: $45,121 (Minnesota: $71,306)
> Estimated unemployment rate 2015-2019: 5.1% (Minnesota: 3.6%)
> Population: 1,532
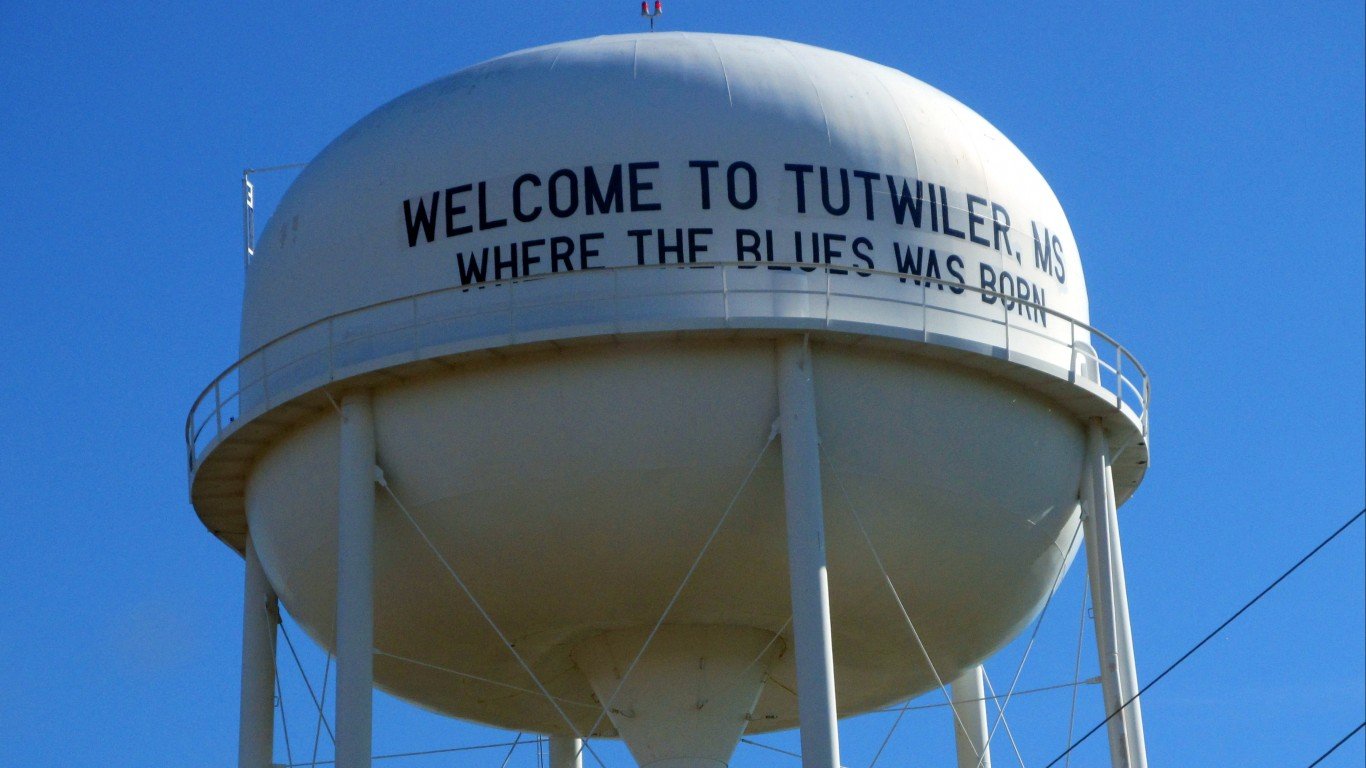
Mississippi: 38963
> Location: Tutwiler
> Adults with at least a bachelor’s degree: 4.2% (Mississippi: 22.0%)
> Adults with at least a high school diploma or equivalent: 51.2% (Mississippi: 84.5%)
> Median household income: $41,250 (Mississippi: $45,081)
> Estimated unemployment rate 2015-2019: 15.4% (Mississippi: 7.5%)
> Population: 3,910
[in-text-ad-2]
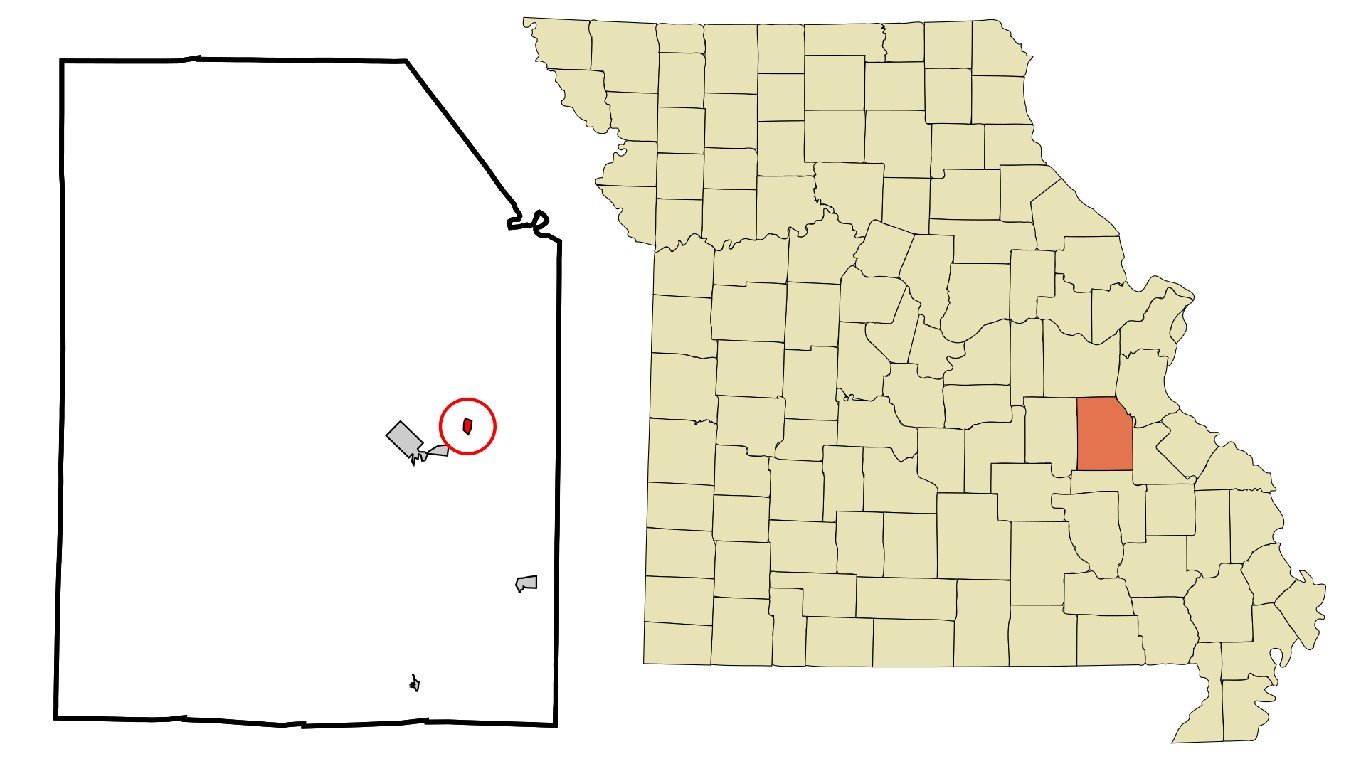
Missouri: 63660
> Location: Mineral Point
> Adults with at least a bachelor’s degree: 4.3% (Missouri: 29.2%)
> Adults with at least a high school diploma or equivalent: 74.6% (Missouri: 89.9%)
> Median household income: $41,068 (Missouri: $55,461)
> Estimated unemployment rate 2015-2019: 6.9% (Missouri: 4.6%)
> Population: 4,022

Montana: 59022
> Location: Crow Agency
> Adults with at least a bachelor’s degree: 10.0% (Montana: 32.0%)
> Adults with at least a high school diploma or equivalent: 90.0% (Montana: 93.6%)
> Median household income: $39,886 (Montana: $54,970)
> Estimated unemployment rate 2015-2019: 19.1% (Montana: 4.0%)
> Population: 2,411
[in-text-ad]
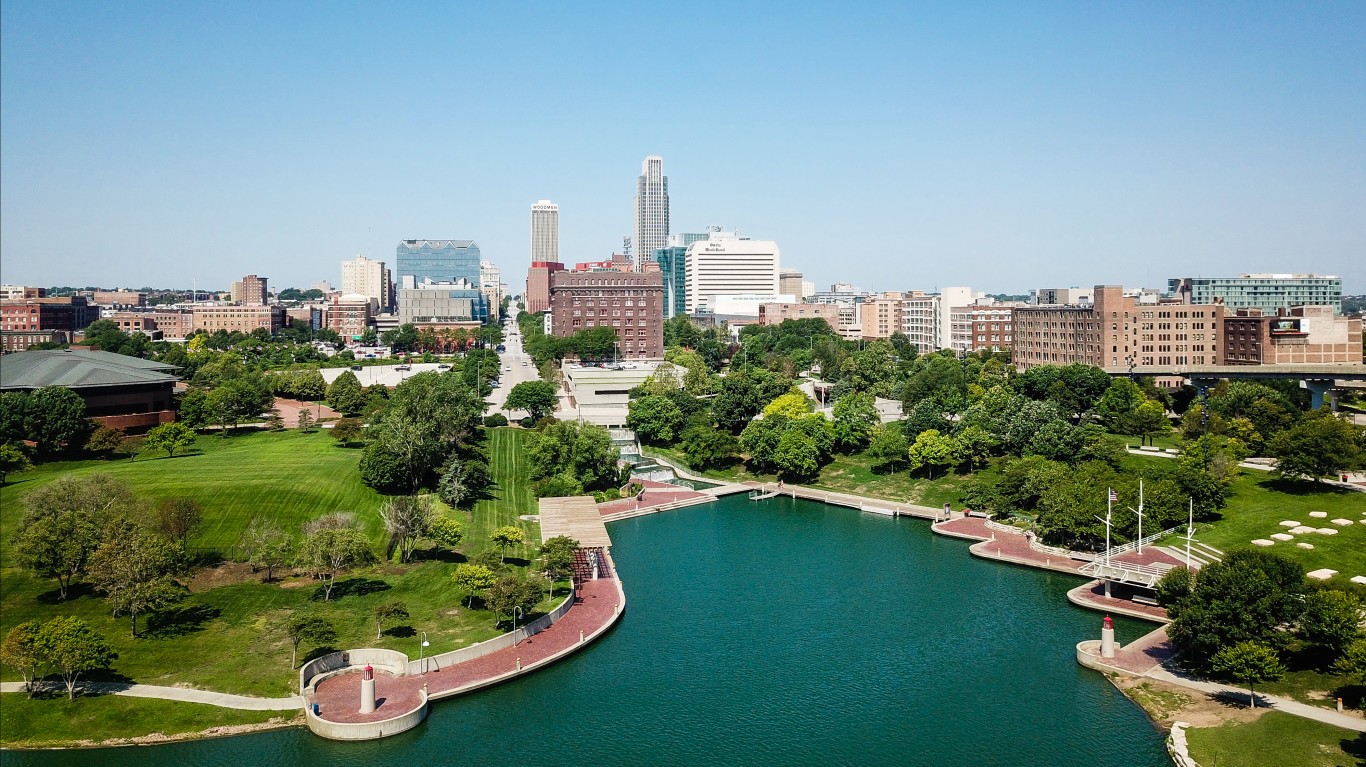
Nebraska: 68107
> Location: Omaha
> Adults with at least a bachelor’s degree: 8.8% (Nebraska: 31.9%)
> Adults with at least a high school diploma or equivalent: 63.4% (Nebraska: 91.4%)
> Median household income: $43,754 (Nebraska: $61,439)
> Estimated unemployment rate 2015-2019: 6.8% (Nebraska: 3.3%)
> Population: 30,428
[recirclink id=912448]
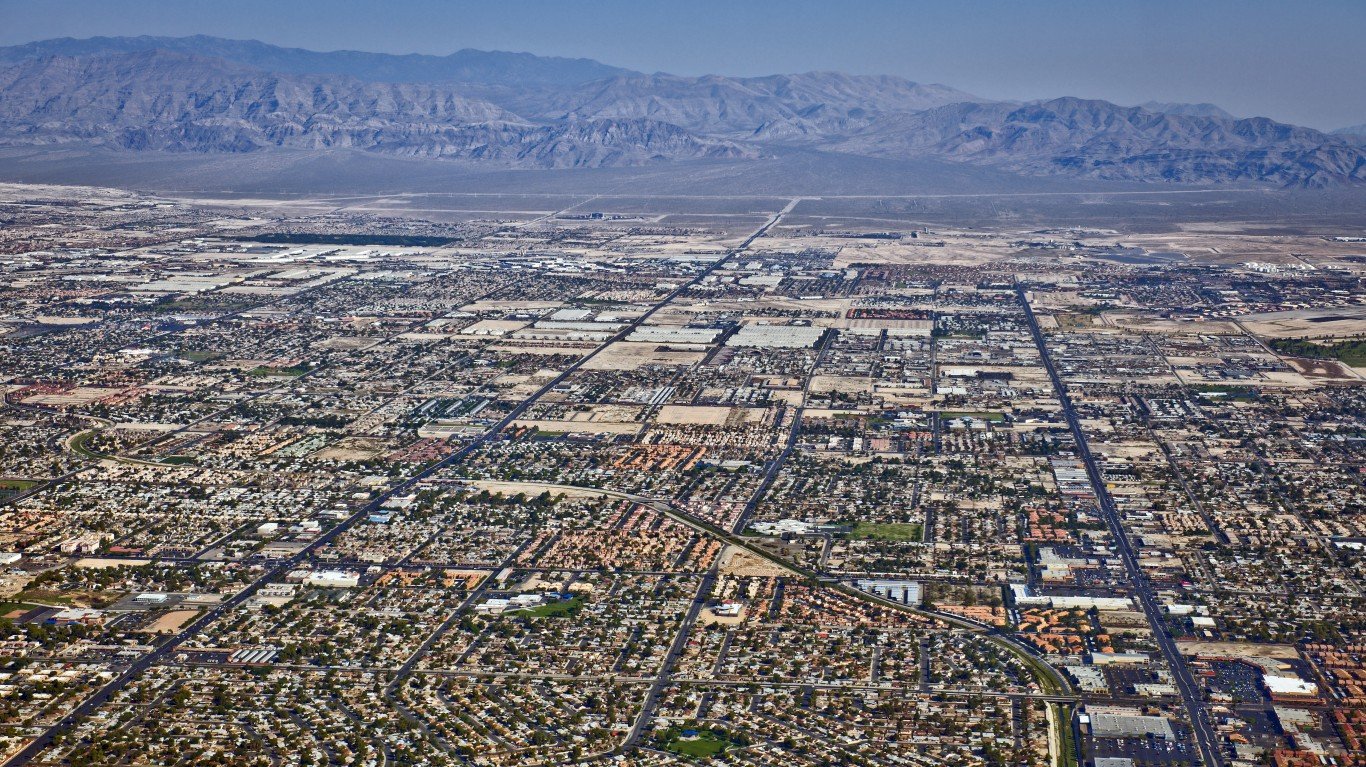
Nevada: 89030
> Location: North Las Vegas
> Adults with at least a bachelor’s degree: 4.0% (Nevada: 24.7%)
> Adults with at least a high school diploma or equivalent: 56.6% (Nevada: 86.7%)
> Median household income: $36,275 (Nevada: $60,365)
> Estimated unemployment rate 2015-2019: 8.6% (Nevada: 6.2%)
> Population: 50,417
New Hampshire: 03582
> Location: Groveton
> Adults with at least a bachelor’s degree: 8.8% (New Hampshire: 37.0%)
> Adults with at least a high school diploma or equivalent: 86.1% (New Hampshire: 93.1%)
> Median household income: $45,492 (New Hampshire: $76,768)
> Estimated unemployment rate 2015-2019: 6.2% (New Hampshire: 3.6%)
> Population: 2,530
[in-text-ad-2]
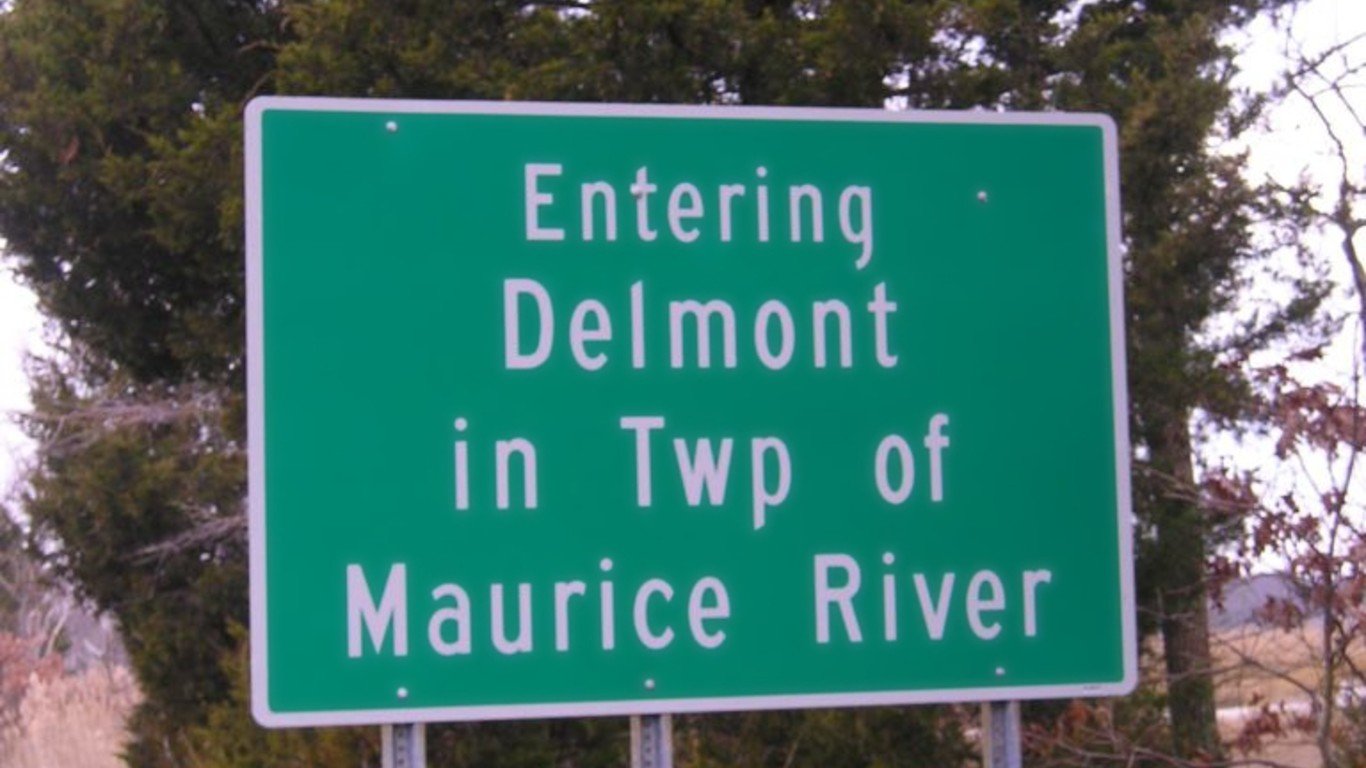
New Jersey: 08314
> Location: Delmont
> Adults with at least a bachelor’s degree: 4.2% (New Jersey: 39.7%)
> Adults with at least a high school diploma or equivalent: 76.1% (New Jersey: 89.8%)
> Median household income: $78,796 (New Jersey: $82,545)
> Estimated unemployment rate 2015-2019: 11.7% (New Jersey: 5.5%)
> Population: 2,908
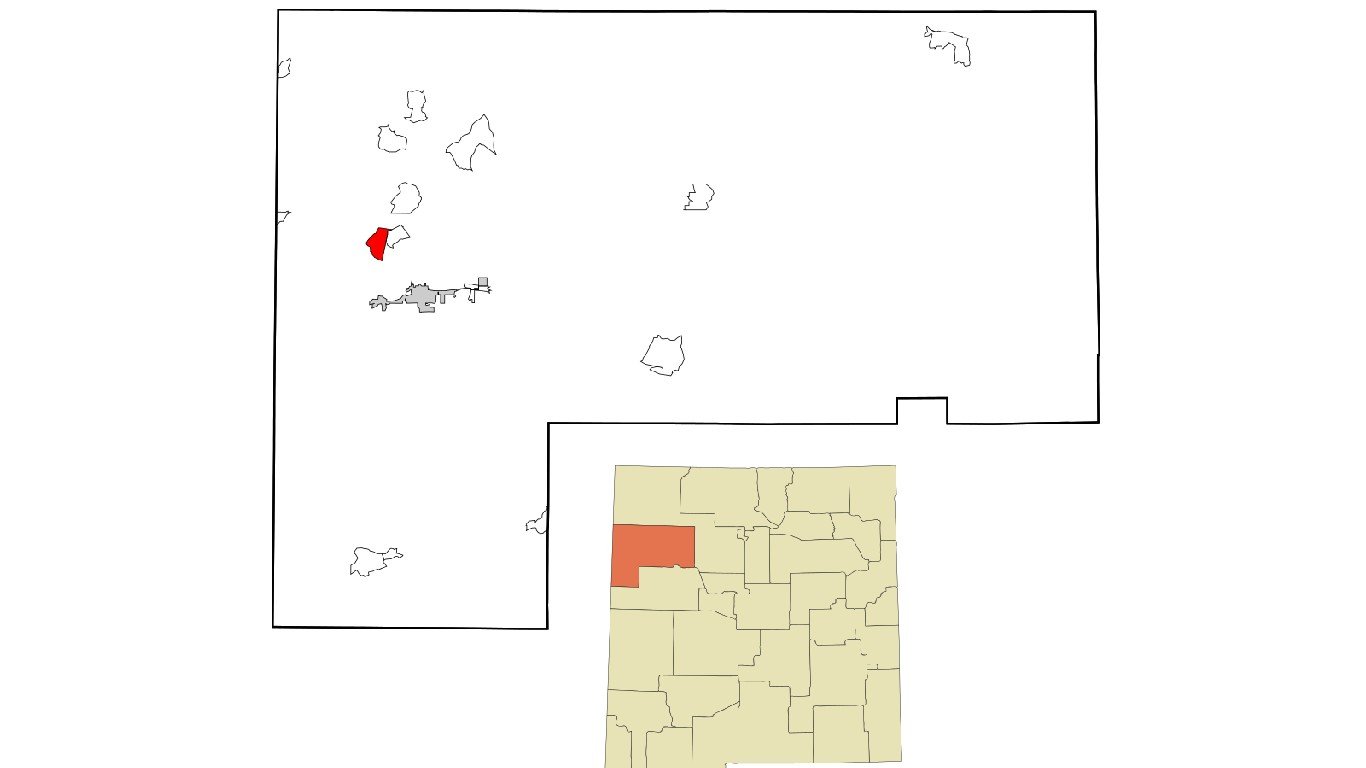
New Mexico: 87305
> Location: Rock Springs
> Adults with at least a bachelor’s degree: 2.3% (New Mexico: 27.3%)
> Adults with at least a high school diploma or equivalent: 69.4% (New Mexico: 85.6%)
> Median household income: $24,447 (New Mexico: $49,754)
> Estimated unemployment rate 2015-2019: 12.8% (New Mexico: 6.7%)
> Population: 3,209
[in-text-ad]
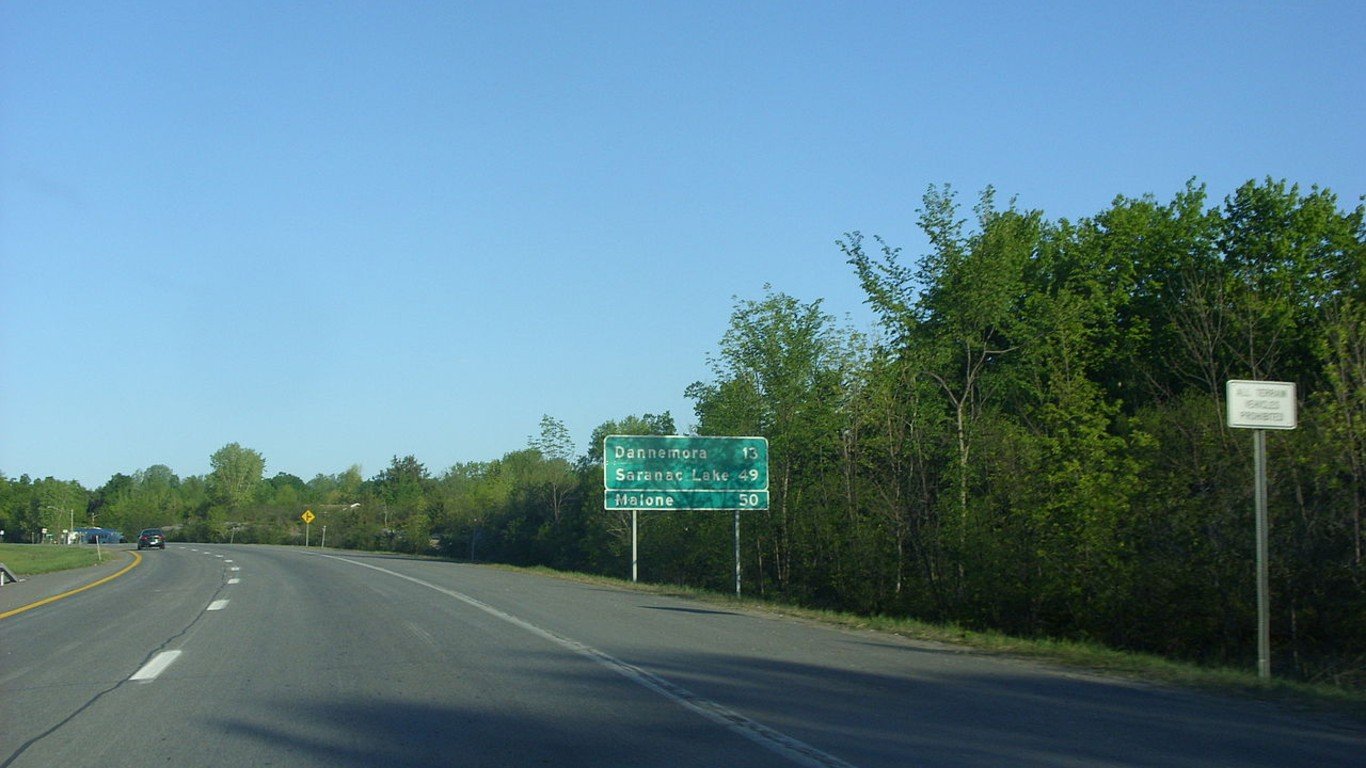
New York: 12929
> Location: Dannemora
> Adults with at least a bachelor’s degree: 3.6% (New York: 36.6%)
> Adults with at least a high school diploma or equivalent: 77.1% (New York: 86.8%)
> Median household income: $51,429 (New York: $68,486)
> Estimated unemployment rate 2015-2019: 8.3% (New York: 5.5%)
> Population: 3,982
[recirclink id=876190]

North Carolina: 28347
> Location: Hoffman
> Adults with at least a bachelor’s degree: 3.1% (North Carolina: 31.3%)
> Adults with at least a high school diploma or equivalent: 57.2% (North Carolina: 87.8%)
> Median household income: $29,722 (North Carolina: $54,602)
> Estimated unemployment rate 2015-2019: 2.9% (North Carolina: 5.6%)
> Population: 2,187
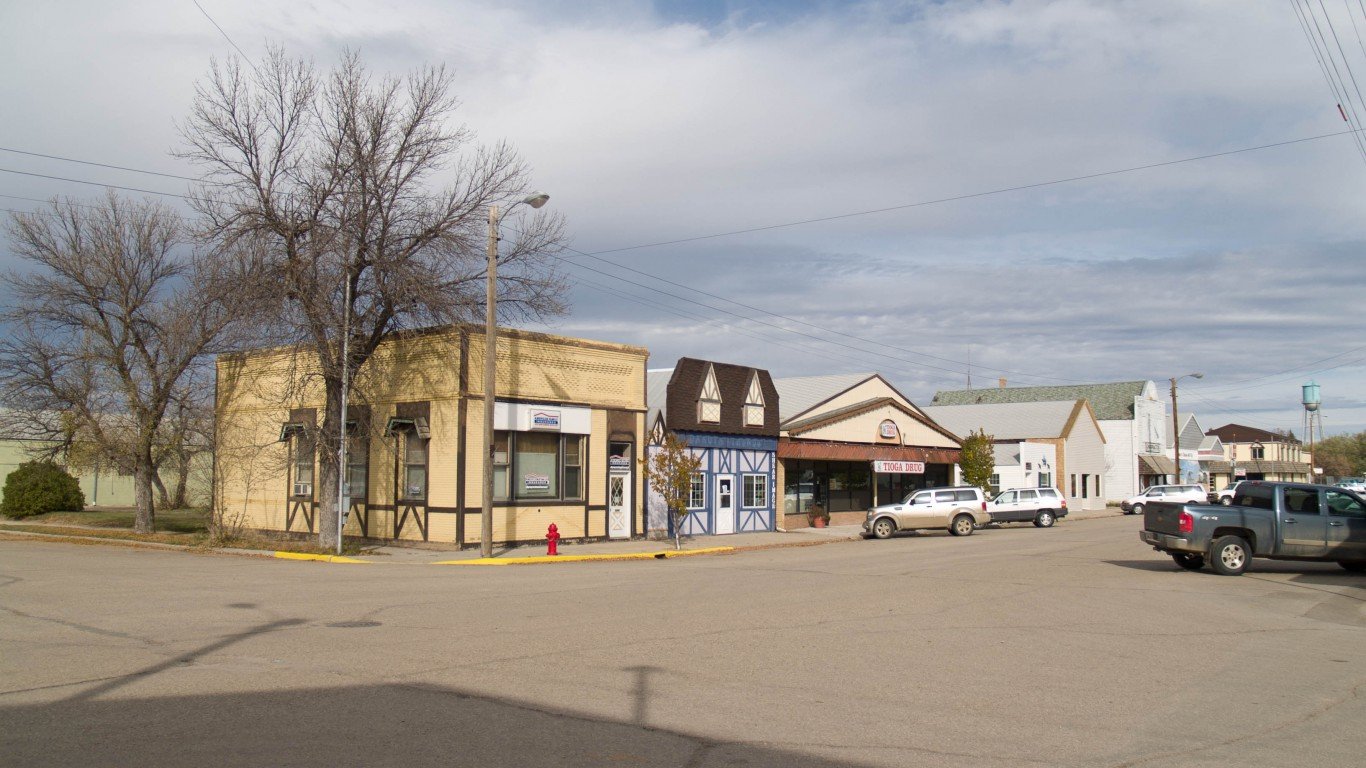
North Dakota: 58852
> Location: Tioga
> Adults with at least a bachelor’s degree: 12.2% (North Dakota: 30.0%)
> Adults with at least a high school diploma or equivalent: 88.8% (North Dakota: 92.6%)
> Median household income: $88,194 (North Dakota: $64,894)
> Estimated unemployment rate 2015-2019: 0.6% (North Dakota: 2.8%)
> Population: 1,436
[in-text-ad-2]

Ohio: 44902
> Location: Mansfield
> Adults with at least a bachelor’s degree: 3.4% (Ohio: 28.3%)
> Adults with at least a high school diploma or equivalent: 82.5% (Ohio: 90.4%)
> Median household income: $27,815 (Ohio: $56,602)
> Estimated unemployment rate 2015-2019: 5.7% (Ohio: 5.3%)
> Population: 5,504

Oklahoma: 74829
> Location: Boley
> Adults with at least a bachelor’s degree: 4.3% (Oklahoma: 25.5%)
> Adults with at least a high school diploma or equivalent: 67.7% (Oklahoma: 88.0%)
> Median household income: $27,969 (Oklahoma: $52,919)
> Estimated unemployment rate 2015-2019: 5.6% (Oklahoma: 5.1%)
> Population: 1,510
[in-text-ad]
Oregon: 97844
> Location: Irrigon
> Adults with at least a bachelor’s degree: 6.1% (Oregon: 33.7%)
> Adults with at least a high school diploma or equivalent: 72.2% (Oregon: 90.7%)
> Median household income: $62,167 (Oregon: $62,818)
> Estimated unemployment rate 2015-2019: 5.8% (Oregon: 5.5%)
> Population: 4,133
[recirclink id=846882]
Pennsylvania: 15510
> Location: Somerset
> Adults with at least a bachelor’s degree: 4.9% (Pennsylvania: 31.4%)
> Adults with at least a high school diploma or equivalent: 83.8% (Pennsylvania: 90.5%)
> Median household income: N/A (Pennsylvania: $61,744)
> Estimated unemployment rate 2015-2019: 0.0% reported (Pennsylvania: 5.3%)
> Population: 2,592

Rhode Island: 02863
> Location: Central Falls
> Adults with at least a bachelor’s degree: 8.1% (Rhode Island: 34.2%)
> Adults with at least a high school diploma or equivalent: 64.9% (Rhode Island: 88.8%)
> Median household income: $32,928 (Rhode Island: $67,167)
> Estimated unemployment rate 2015-2019: 6.8% (Rhode Island: 5.4%)
> Population: 19,411
[in-text-ad-2]
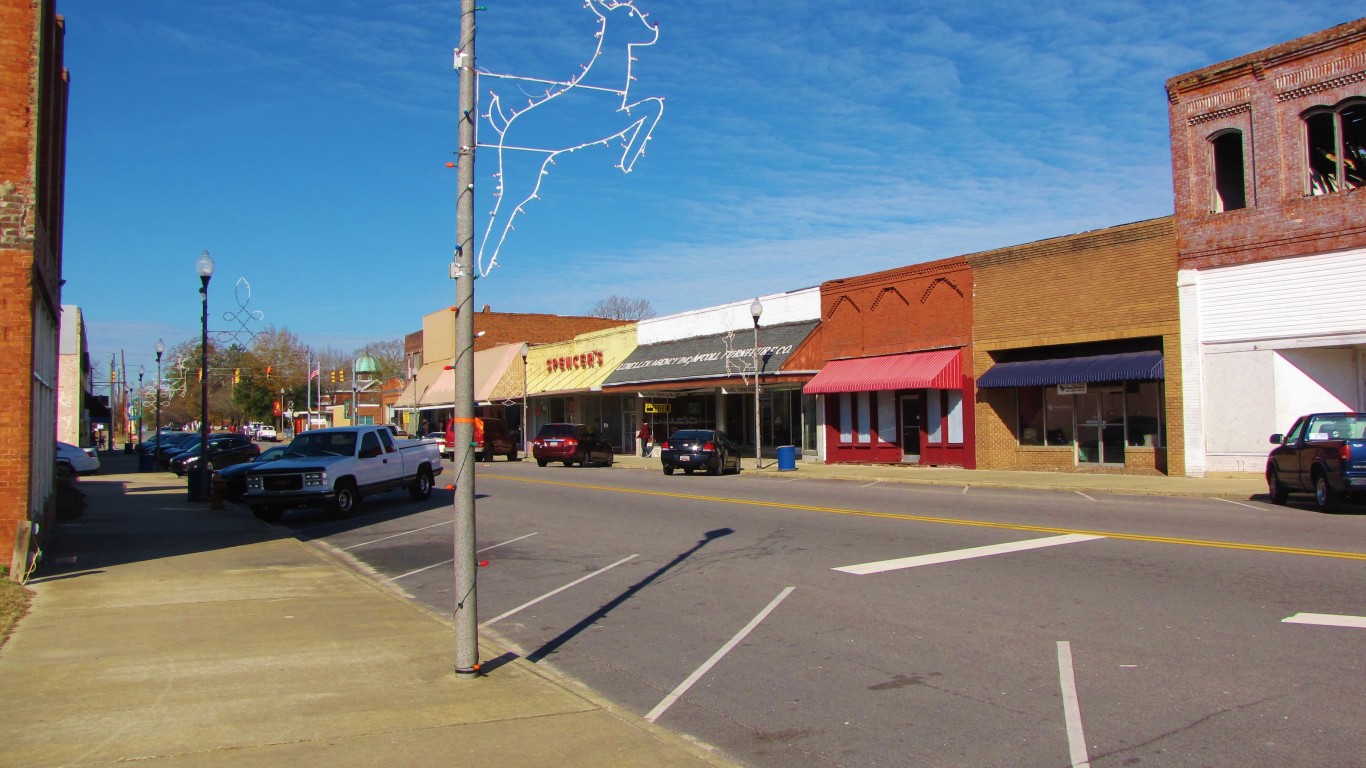
South Carolina: 29570
> Location: McColl
> Adults with at least a bachelor’s degree: 5.0% (South Carolina: 28.1%)
> Adults with at least a high school diploma or equivalent: 80.6% (South Carolina: 87.5%)
> Median household income: $28,917 (South Carolina: $53,199)
> Estimated unemployment rate 2015-2019: 12.9% (South Carolina: 5.8%)
> Population: 3,538
South Dakota: 57770
> Location: Pine Ridge
> Adults with at least a bachelor’s degree: 8.8% (South Dakota: 28.8%)
> Adults with at least a high school diploma or equivalent: 78.1% (South Dakota: 91.7%)
> Median household income: $43,333 (South Dakota: $58,275)
> Estimated unemployment rate 2015-2019: 12.9% (South Dakota: 3.4%)
> Population: 6,248
[in-text-ad]
Tennessee: 37755
> Location: Helenwood
> Adults with at least a bachelor’s degree: 4.2% (Tennessee: 27.3%)
> Adults with at least a high school diploma or equivalent: 85.5% (Tennessee: 87.5%)
> Median household income: $34,063 (Tennessee: $53,320)
> Estimated unemployment rate 2015-2019: 11.0% (Tennessee: 5.3%)
> Population: 3,188
[recirclink id=878400]

Texas: 77093
> Location: Houston
> Adults with at least a bachelor’s degree: 3.0% (Texas: 29.9%)
> Adults with at least a high school diploma or equivalent: 47.0% (Texas: 83.7%)
> Median household income: $31,301 (Texas: $61,874)
> Estimated unemployment rate 2015-2019: 4.8% (Texas: 5.1%)
> Population: 47,135
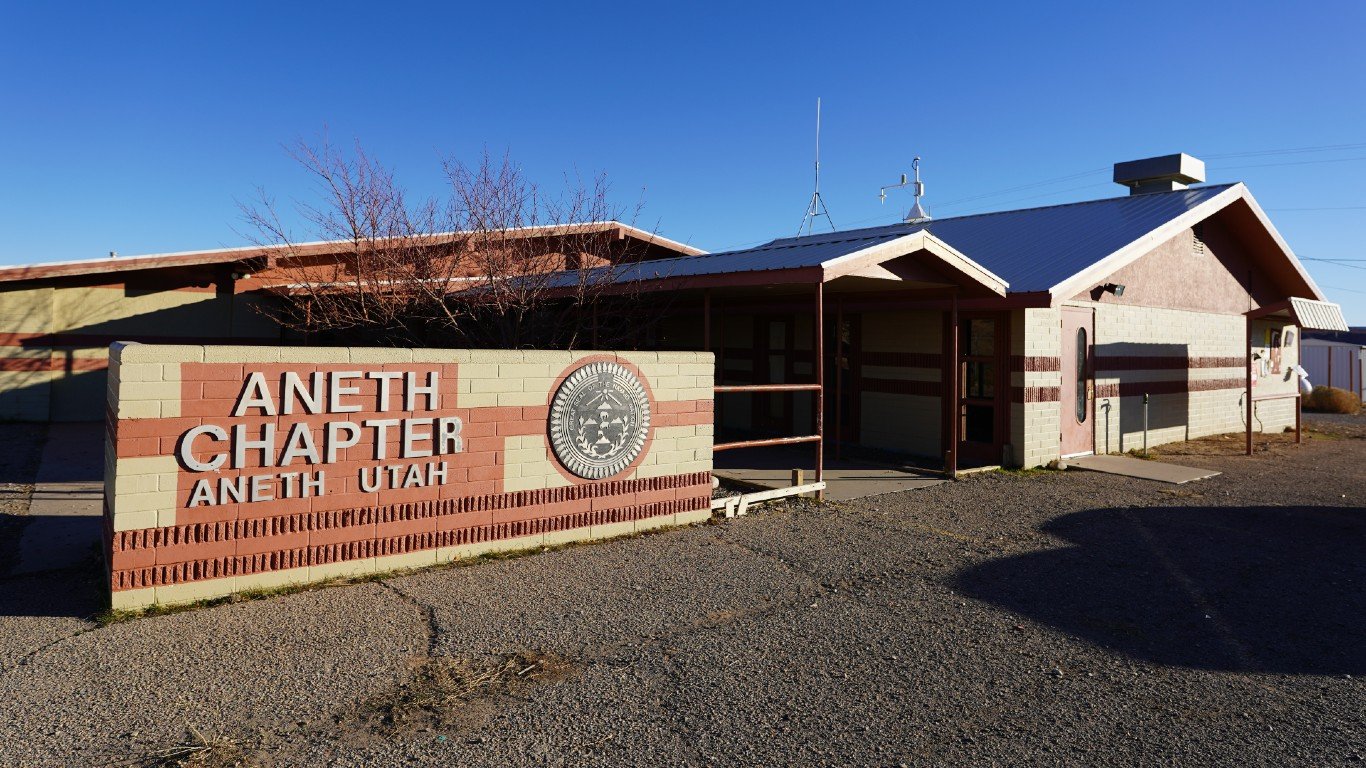
Utah: 84534
> Location: Aneth
> Adults with at least a bachelor’s degree: 7.5% (Utah: 34.0%)
> Adults with at least a high school diploma or equivalent: 74.2% (Utah: 92.3%)
> Median household income: $31,597 (Utah: $71,621)
> Estimated unemployment rate 2015-2019: 25.8% (Utah: 3.6%)
> Population: 2,757
[in-text-ad-2]
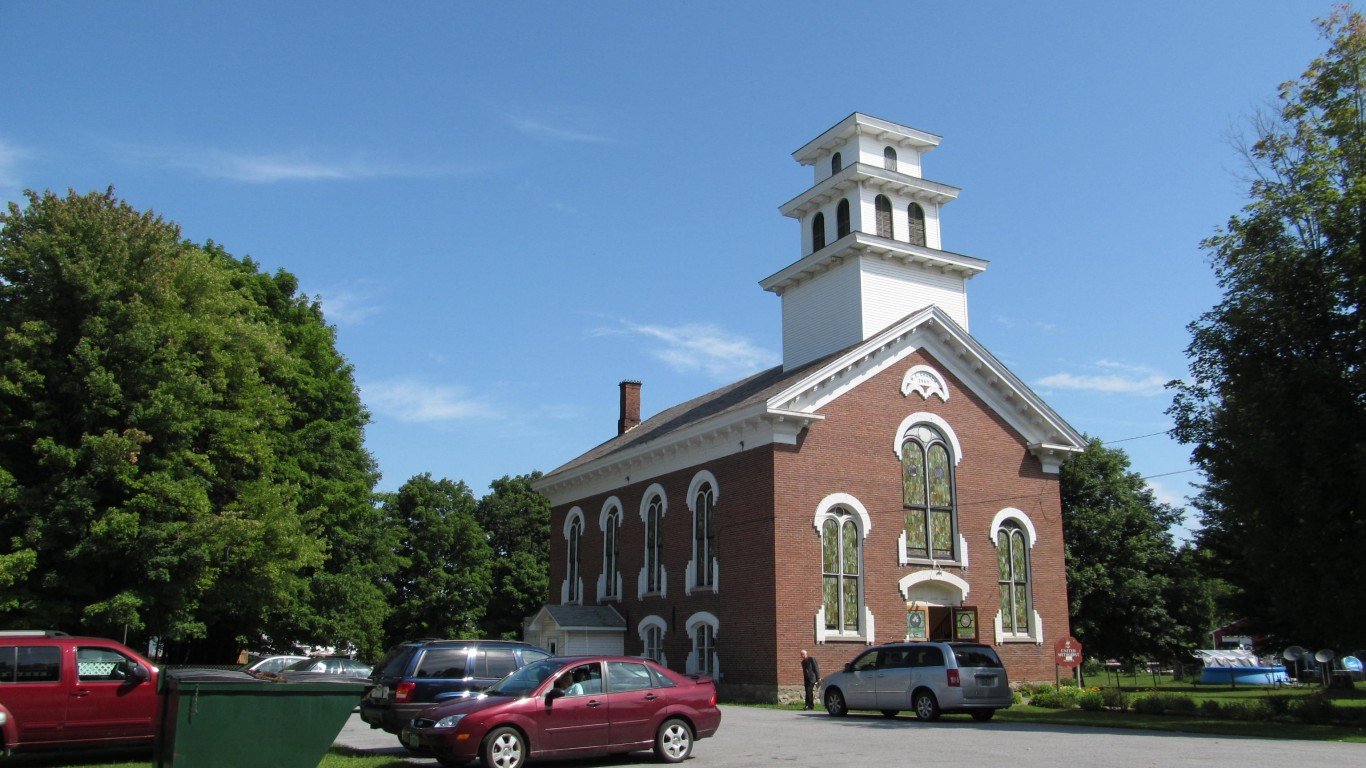
Vermont: 05459
> Location: Highgate Center
> Adults with at least a bachelor’s degree: 10.3% (Vermont: 38.0%)
> Adults with at least a high school diploma or equivalent: 85.2% (Vermont: 92.7%)
> Median household income: $52,731 (Vermont: $61,973)
> Estimated unemployment rate 2015-2019: 0.0% reported (Vermont: 3.6%)
> Population: 2,133
Virginia: 24430
> Location: Craigsville
> Adults with at least a bachelor’s degree: 2.9% (Virginia: 38.8%)
> Adults with at least a high school diploma or equivalent: 71.8% (Virginia: 89.7%)
> Median household income: $31,250 (Virginia: $74,222)
> Estimated unemployment rate 2015-2019: 7.2% (Virginia: 4.6%)
> Population: 3,829
[in-text-ad]
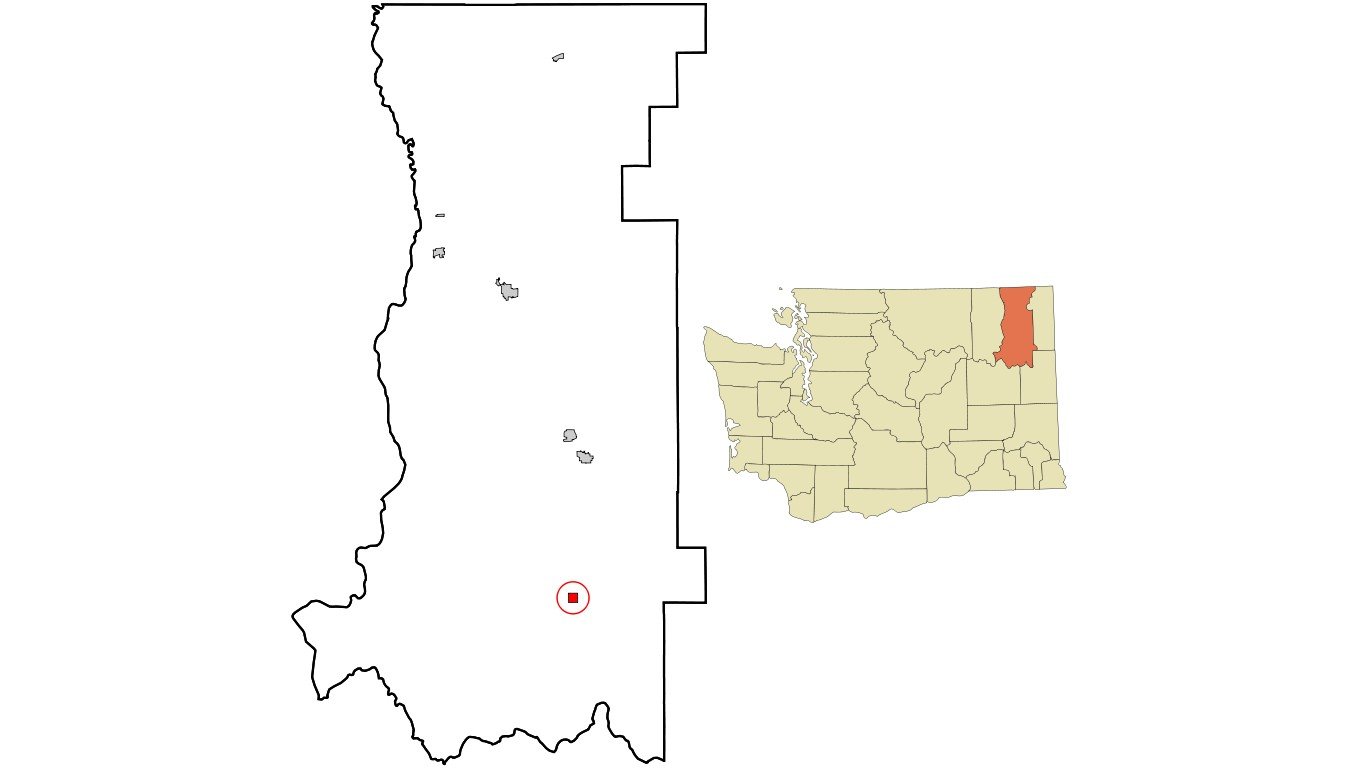
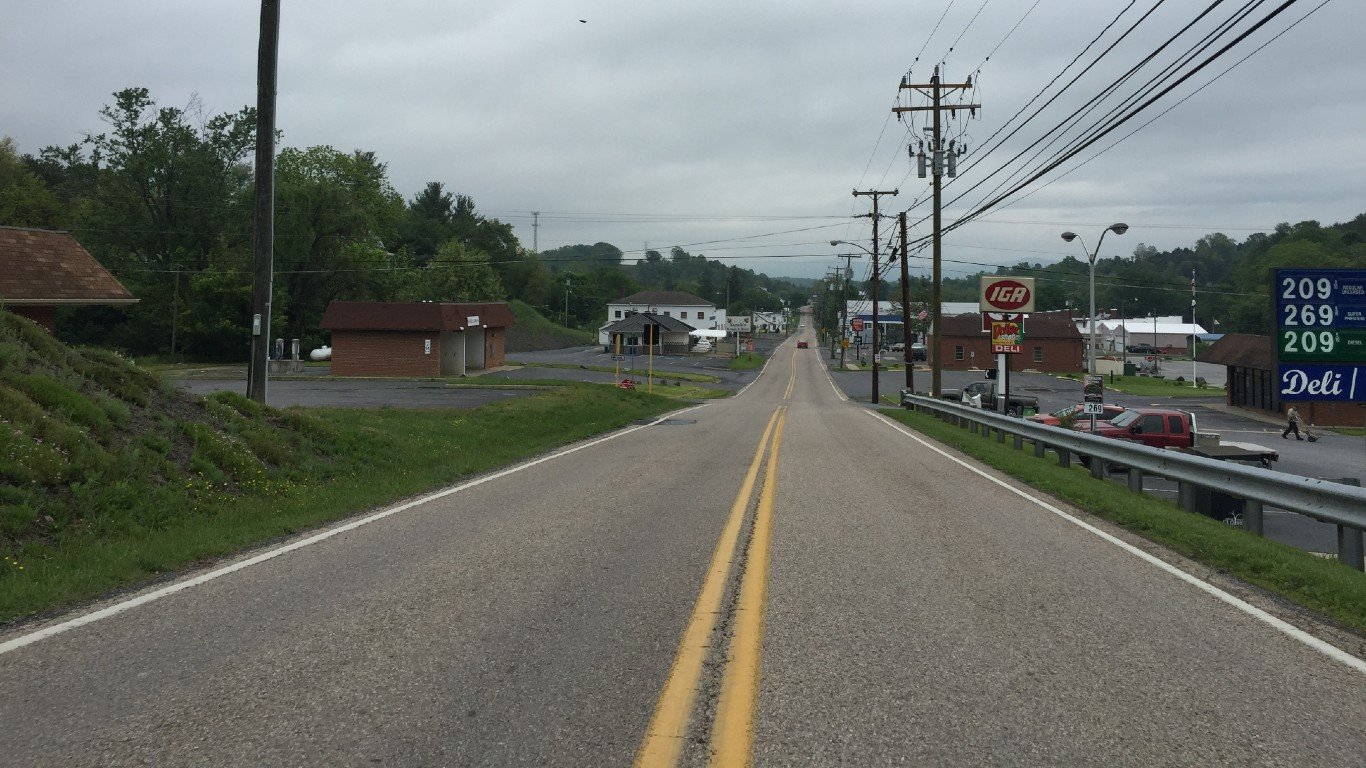
Washington: 99173
> Location: Springdale
> Adults with at least a bachelor’s degree: 4.2% (Washington: 36.0%)
> Adults with at least a high school diploma or equivalent: 86.6% (Washington: 91.3%)
> Median household income: $34,889 (Washington: $73,775)
> Estimated unemployment rate 2015-2019: 9.3% (Washington: 5.0%)
> Population: 1,673
[recirclink id=912448]
West Virginia: 26386
> Location: Lumberport
> Adults with at least a bachelor’s degree: 7.0% (West Virginia: 20.6%)
> Adults with at least a high school diploma or equivalent: 78.6% (West Virginia: 86.9%)
> Median household income: $50,161 (West Virginia: $46,711)
> Estimated unemployment rate 2015-2019: 7.4% (West Virginia: 6.5%)
> Population: 2,620
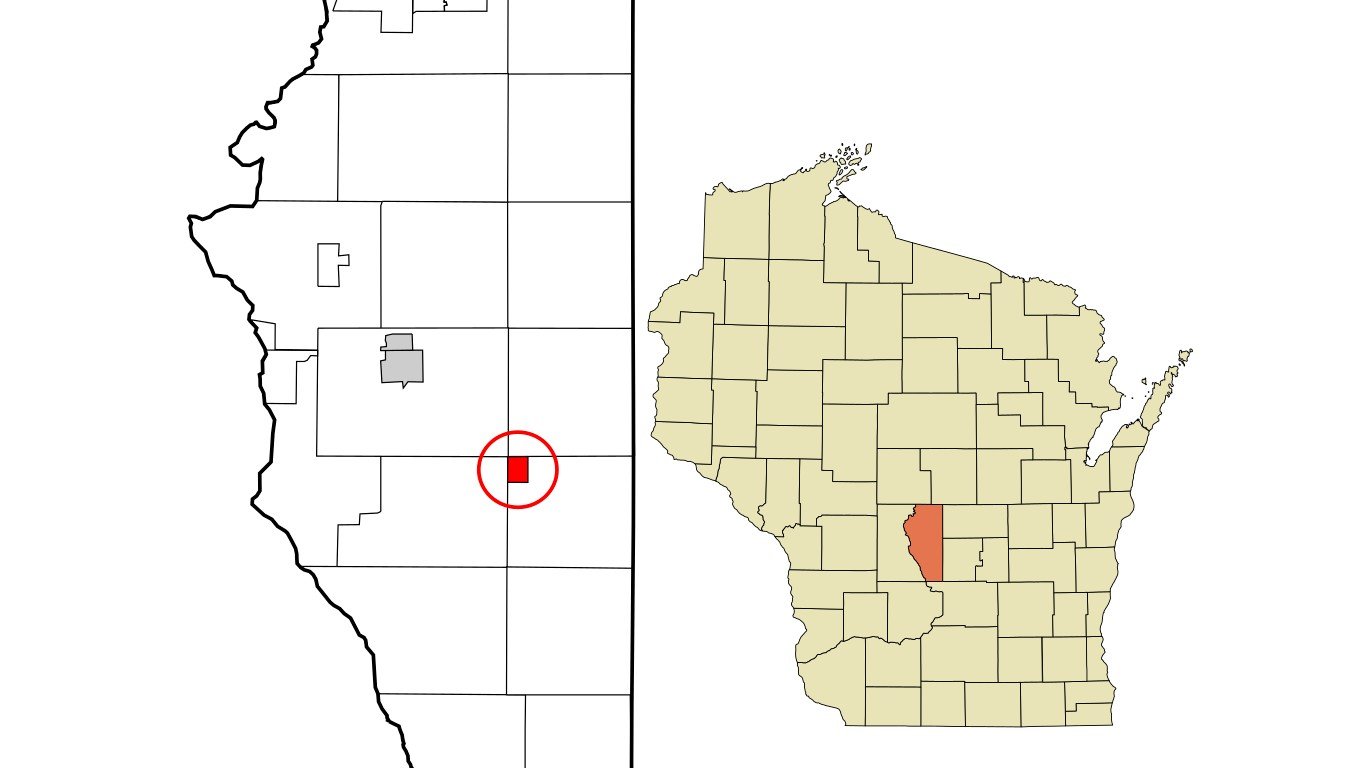
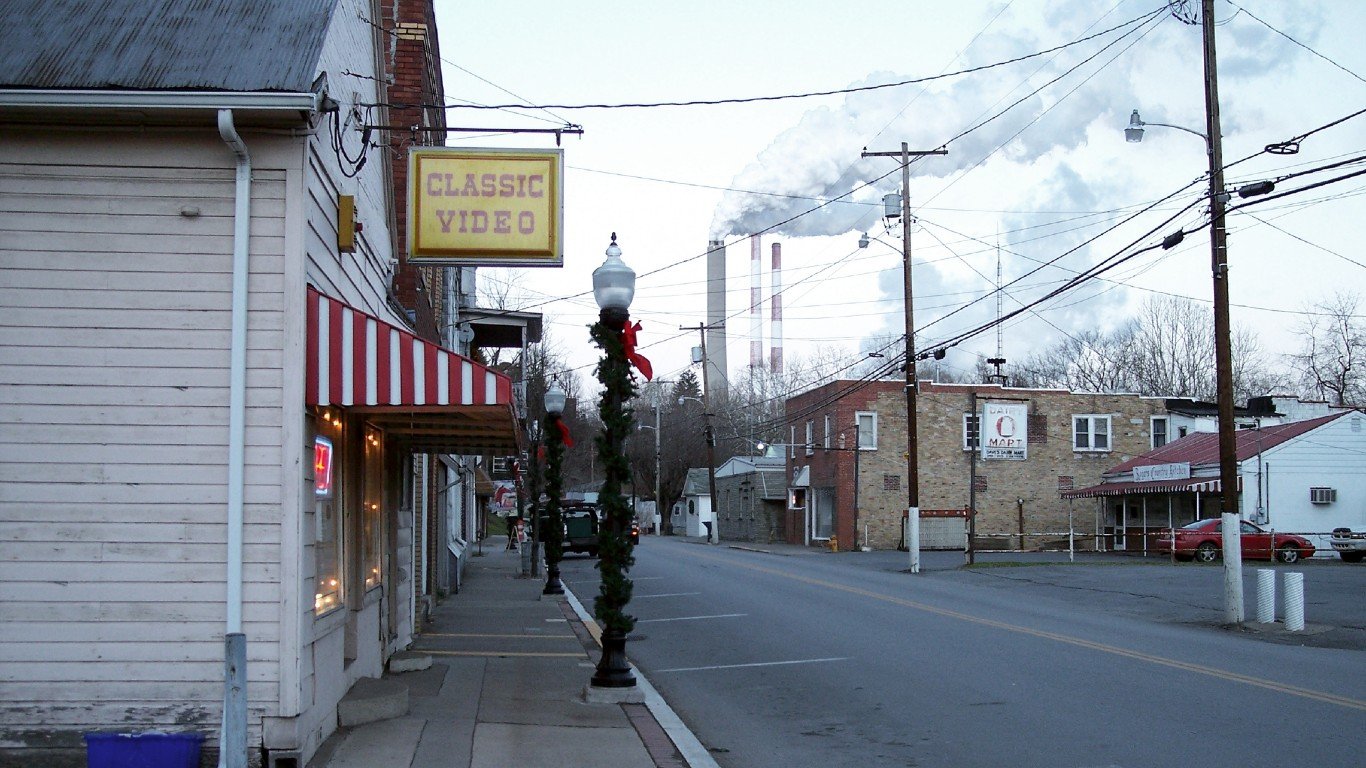
Wisconsin: 53936
> Location: Grand Marsh
> Adults with at least a bachelor’s degree: 4.7% (Wisconsin: 30.1%)
> Adults with at least a high school diploma or equivalent: 87.3% (Wisconsin: 92.2%)
> Median household income: $41,875 (Wisconsin: $61,747)
> Estimated unemployment rate 2015-2019: 3.5% (Wisconsin: 3.6%)
> Population: 2,333
[in-text-ad-2]
Wyoming: 82716
> Location: Gillette
> Adults with at least a bachelor’s degree: 11.8% (Wyoming: 27.4%)
> Adults with at least a high school diploma or equivalent: 91.1% (Wyoming: 93.2%)
> Median household income: $75,468 (Wyoming: $64,049)
> Estimated unemployment rate 2015-2019: 5.2% (Wyoming: 4.5%)
> Population: 17,245
Methodology
To determine the least educated ZIP zip code in every state, 24/7 Wall St. reviewed five-year estimates of the percentage of adults 25 years and over with at least a bachelor’s degree in ZIP codes nationwide from the U.S. Census Bureau’s 2019 American Community Survey.
We used ZIPip Code Tabulation Areas — a Ccensus geography type that which defines areal representations of United States Postal Service ZIP zip codes (USPS ZIP zip codes do not define geographic boundaries but instead are a network of mail delivery routes in a service area). We refer to Census ZCTAs as ZIP zip codes.
Of the 33,120 ZIP zip codes the Ccensus publishes data for, 32,936 had boundaries that fell within one of the 50 states, while the rest were in the District of Columbia or Puerto Rico.
ZIPip codes were excluded if bachelor’s degree or higher attainment rates were not available in the 2019 ACS, if the ZIP zip code’s 25 and older population was less than 1,000, or if the sampling error associated with a ZIP zip code’s data was deemed too high.
The sampling error was defined as too high if the coefficient of variation — a statistical assessment of how reliable an estimate is — for a ZIP zip code’s bachelor’s or higher attainment rate was above 15% and greater than two standard deviations above the mean CV for all ZIP zip codes’ bachelor’s or higher attainment rate. We similarly excluded ZIP zip codes that had a sampling error too high for their 25 and over population estimates, using the same definition.
The remaining 20,091 ZIP zip codes were ranked within their state based on the share of adults 25 years and over with at least a bachelor’s degree.
Additional information on the share of adults 25 years and over who have completed at least high school or its equivalent, median household income, unemployment rates for the 16 and older population in the civilian labor force, and population figures are also five-year estimates from the 2019 ACS.
Contact [email protected] for any questions or corrections.