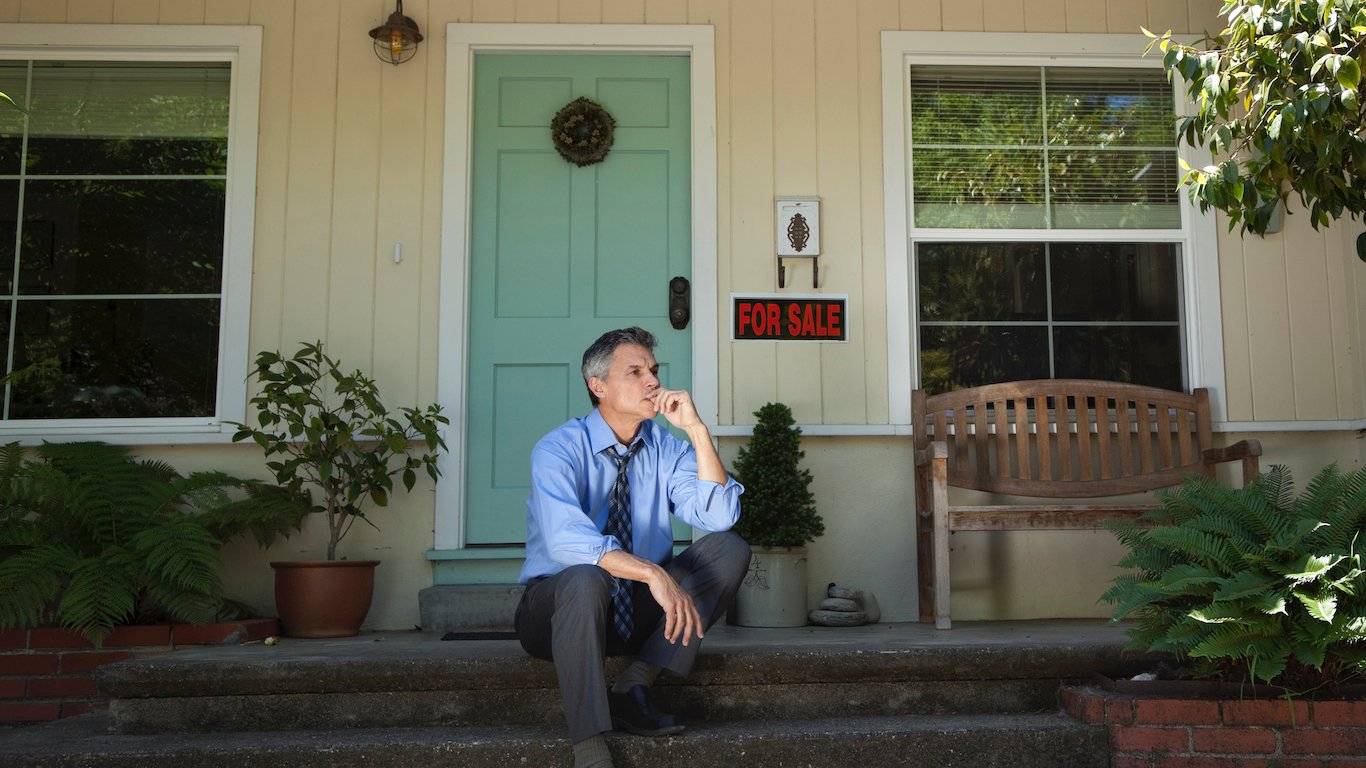
Inventory in the U.S. housing market hit a record low in 2021 as household growth, low interest rates, and the COVID-19 pandemic fueled a surge in demand for homes. The resulting inventory crunch has sent home prices to all time highs — and in major metropolitan areas across the country, the American middle class has been spending more on housing than they can afford.
According to a recent report from the Joint Center for Housing Studies of Harvard University, 21.2% of homeowners and 46.3% of renters in the United States are either moderately or severely burdened by housing costs — defined as spending more than 30% or more than 50% of their income on housing, respectively. Nationwide, 24.5% of middle-class households spend over 30% of their income on housing.
Using data from the JCHS report “The State of the Nation’s Housing 2021,” 24/7 Wall St. identified the metro areas where the middle class can no longer afford housing. For the purposes of this story, the middle class is defined as households earning between $45,000 and $74,999 a year.
It is important to note that rental prices have not increased the way home prices have in recent months. However, an estimated 53% of renters lost income during the pandemic, and according to the JCHS report, renters are typically far less able to withstand a loss of income than homeowners. Here is a look at the places where 1-bedroom rents dropped the most during the pandemic.
With only a few exceptions, most of the metro areas where the middle class can no longer afford housing are coastal areas. Nearly half of the metro areas on this list are in California, a state where high-demand and limited inventory has created one of the most expensive housing markets in the country. Here is a look at the states where home prices went up the most in the last 12 months.
Click here to see the cities where the middle class can no longer afford housing
Click here to see our detailed methodology

20. Baltimore-Columbia-Towson, MD
> Cost-burdened middle-class households: 33.8%
> Median home value: $313,200
> Median household income: $83,160
> Homeownership rate: 66.4%
[in-text-ad]

19. New Haven-Milford, CT
> Cost-burdened middle-class households: 35.4%
> Median home value: $251,500
> Median household income: $69,751
> Homeownership rate: 60.5%
[recirclink id=911070]

18. Austin-Round Rock, TX
> Cost-burdened middle-class households: 37.5%
> Median home value: $318,400
> Median household income: $80,954
> Homeownership rate: 57.6%

17. Portland-Vancouver-Hillsboro, OR-WA
> Cost-burdened middle-class households: 39.4%
> Median home value: $408,600
> Median household income: $78,439
> Homeownership rate: 61.8%
[in-text-ad-2]
16. Stockton-Lodi, CA
> Cost-burdened middle-class households: 41.3%
> Median home value: $385,600
> Median household income: $68,997
> Homeownership rate: 58.4%

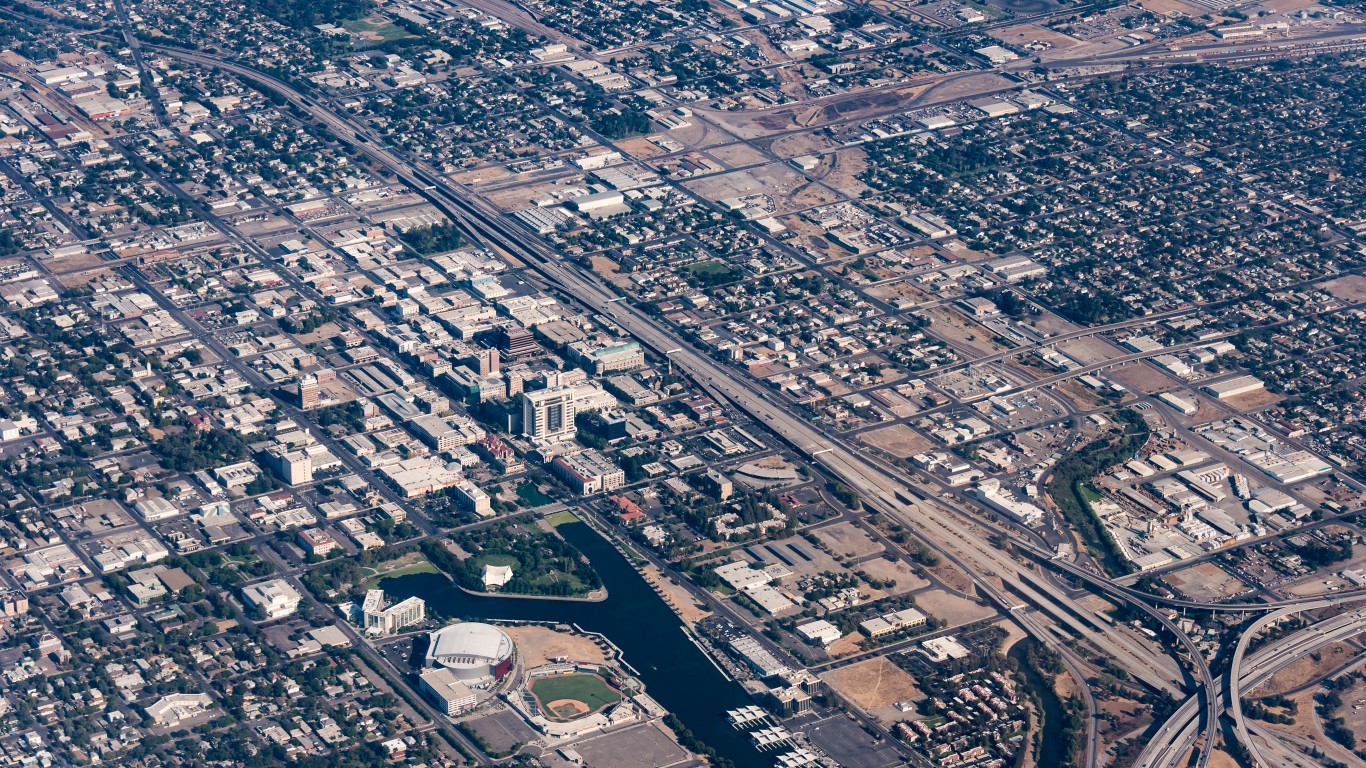
15. Sacramento-Roseville-Arden-Arcade, CA
> Cost-burdened middle-class households: 42.5%
> Median home value: $434,400
> Median household income: $76,706
> Homeownership rate: 60.4%
[in-text-ad]

14. Miami-Fort Lauderdale-West Palm Beach, FL
> Cost-burdened middle-class households: 43.0%
> Median home value: $315,400
> Median household income: $60,141
> Homeownership rate: 59.2%
[recirclink id=912900]

13. Denver-Aurora-Lakewood, CO
> Cost-burdened middle-class households: 43.5%
> Median home value: $437,800
> Median household income: $85,641
> Homeownership rate: 64.3%
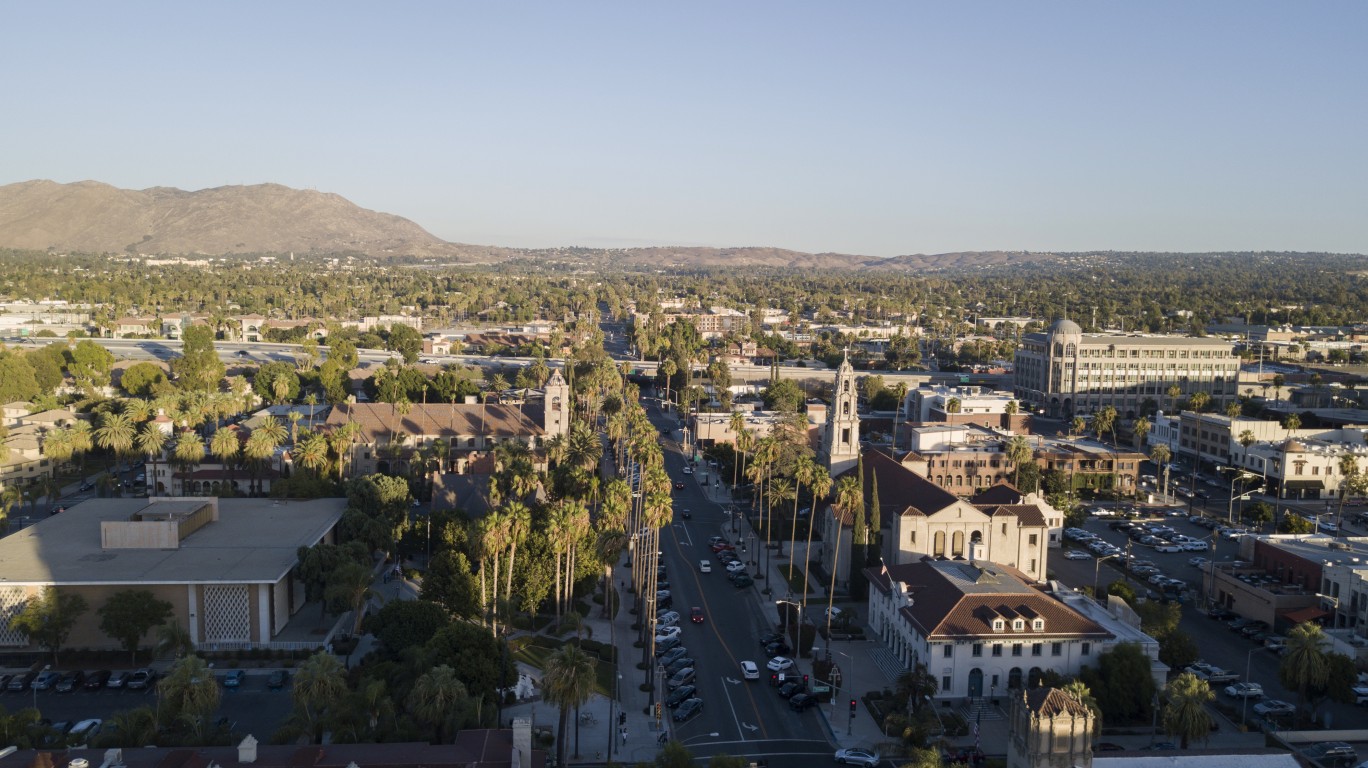
12. Riverside-San Bernardino-Ontario, CA
> Cost-burdened middle-class households: 45.3%
> Median home value: $378,500
> Median household income: $70,954
> Homeownership rate: 63.9%
[in-text-ad-2]

11. Seattle-Tacoma-Bellevue, WA
> Cost-burdened middle-class households: 49.5%
> Median home value: $503,000
> Median household income: $94,027
> Homeownership rate: 59.7%

10. Bridgeport-Stamford-Norwalk, CT
> Cost-burdened middle-class households: 49.6%
> Median home value: $444,500
> Median household income: $97,053
> Homeownership rate: 66.1%
[in-text-ad]

9. Boston-Cambridge-Newton, MA-NH
> Cost-burdened middle-class households: 50.0%
> Median home value: $482,700
> Median household income: $94,430
> Homeownership rate: 61.5%
[recirclink id=916394]

8. New York-Newark-Jersey City, NY-NJ-PA
> Cost-burdened middle-class households: 50.4%
> Median home value: $482,900
> Median household income: $83,160
> Homeownership rate: 50.8%

7. Urban Honolulu, HI
> Cost-burdened middle-class households: 52.7%
> Median home value: $739,700
> Median household income: $87,470
> Homeownership rate: 57.4%
[in-text-ad-2]

6. Washington-Arlington-Alexandria, DC-VA-MD-WV
> Cost-burdened middle-class households: 53.5%
> Median home value: $446,300
> Median household income: $105,659
> Homeownership rate: 63.5%

5. Los Angeles-Long Beach-Anaheim, CA
> Cost-burdened middle-class households: 56.8%
> Median home value: $666,900
> Median household income: $77,774
> Homeownership rate: 48.2%
[in-text-ad]

4. Oxnard-Thousand Oaks-Ventura, CA
> Cost-burdened middle-class households: 59.1%
> Median home value: $629,600
> Median household income: $92,236
> Homeownership rate: 62.8%
[recirclink id=917526]

3. San Francisco-Oakland-Hayward, CA
> Cost-burdened middle-class households: 59.3%
> Median home value: $940,900
> Median household income: $114,696
> Homeownership rate: 54.0%

2. San Diego-Carlsbad, CA
> Cost-burdened middle-class households: 60.3%
> Median home value: $619,300
> Median household income: $83,985
> Homeownership rate: 53.8%
[in-text-ad-2]
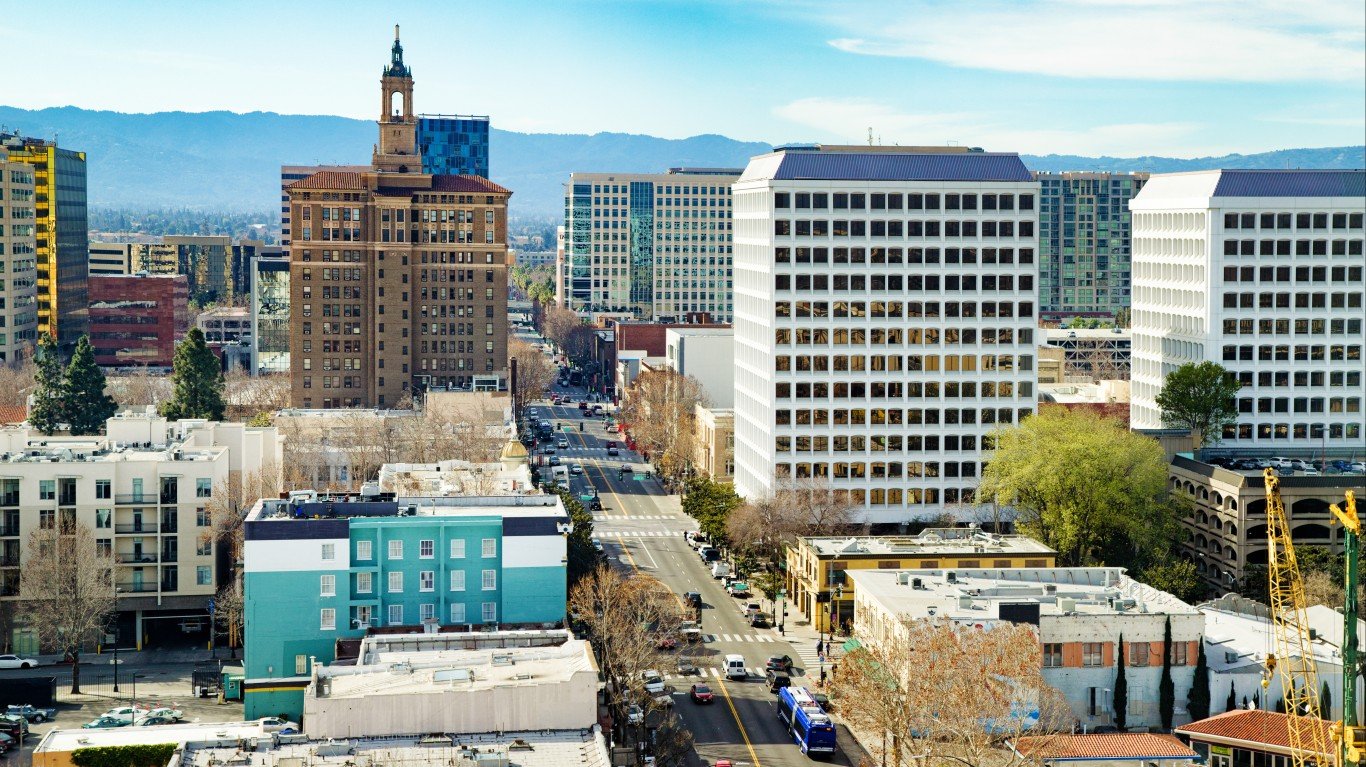
1. San Jose-Sunnyvale-Santa Clara, CA
> Cost-burdened middle-class households: 63.7%
> Median home value: $1,116,400
> Median household income: $130,865
> Homeownership rate: 55.2%
Methodology
To determine the cities where the middle class can no longer afford a home, 24/7 Wall St. reviewed data on housing cost burdens from the Joint Center for Housing Studies of Harvard University. The center ranked the 100 largest U.S. metropolitan areas based on the percentage of homeowners and renters earning between $45,000 and $74,999 a year — the income bracket representing the middle class — that spend at least 30% of their income on housing costs. Data on housing cost burdens came from “The State of the Nation’s Housing 2021” report of the JCHS. 24/7 Wall St. added data on median home value, median household income, and homeownership rate — all from the U.S. Census Bureau’s 2019 American Community Survey and are one-year data.
Contact [email protected] for any questions or corrections.