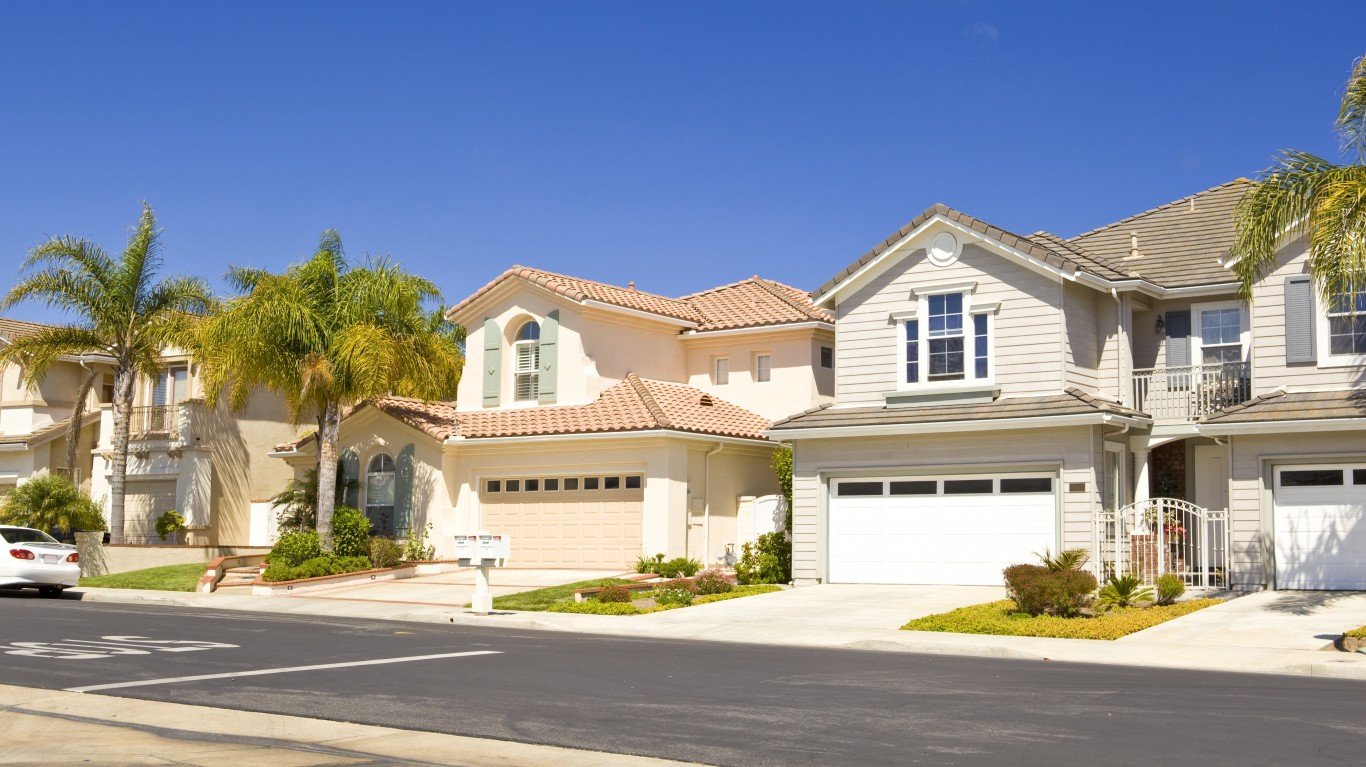
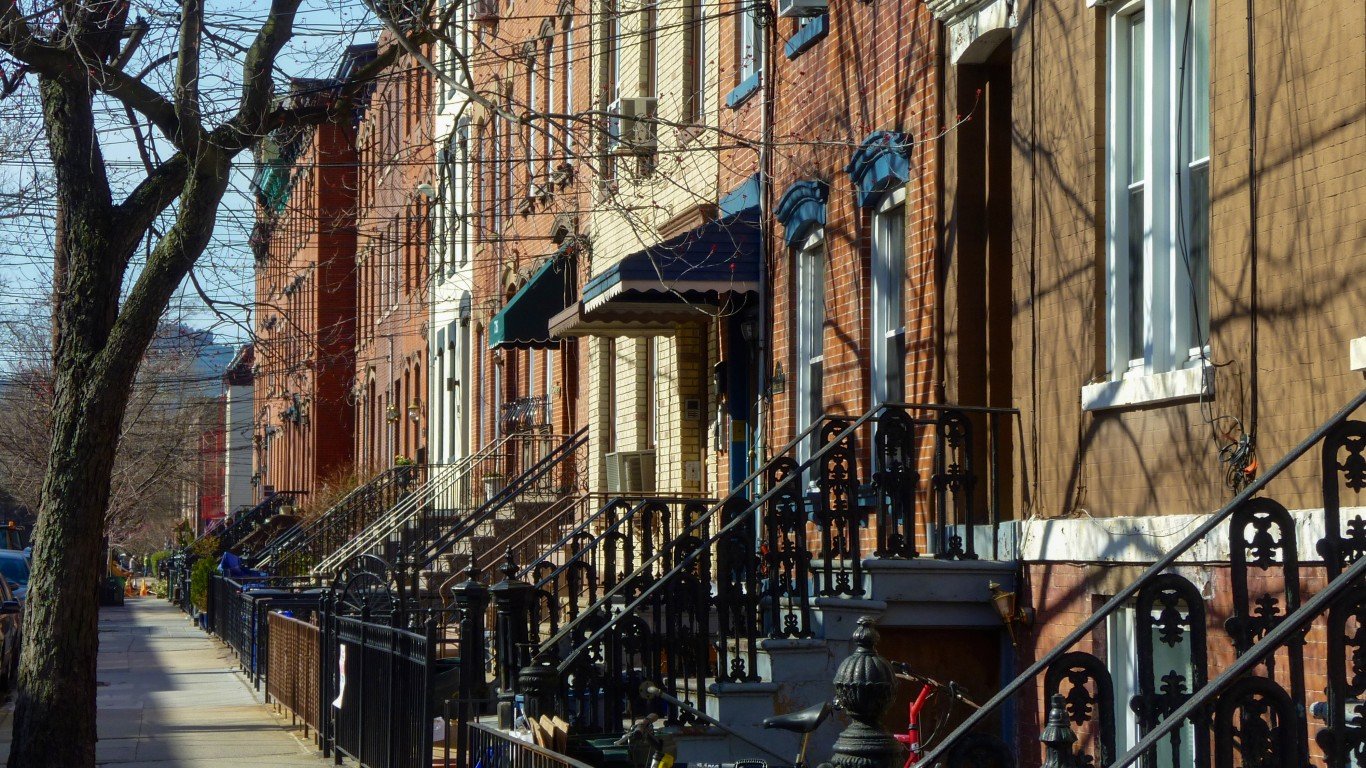
With travel curtailed significantly over the past year, living in a desirable area has never been more important for Americans. People want to live in an area that is affordable, safe, and convenient — a place that provides a high quality of life for its residents.
While each place in the country has its positives and negatives, some cities stand out as especially good places to live. These cities have universal appeal, as they are attractive to most people because of their location, economic condition, the numerous entertainment and leisure options they provide, as well as other quality of life attributes.
To identify the best cities to live in, 24/7 Wall St. used data from the Census Bureau, FBI, and Centers for Disease Control and Prevention to create a weighted index of 25 measures across four categories: affordability, economy, quality of life, and community.
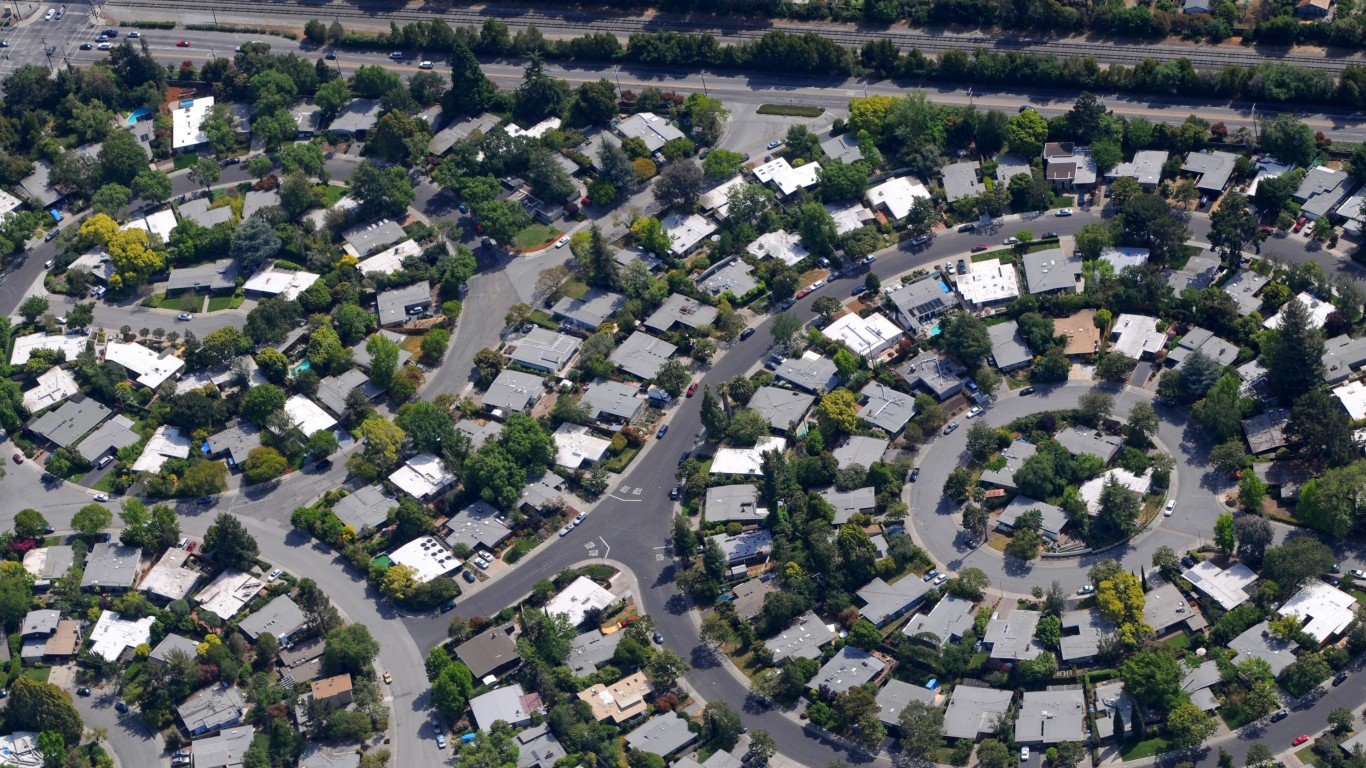
The 50 best cities to live are concentrated in just a dozen different states. California dominates the list with 20 of its cities making the list, followed by Massachusetts with seven, and New Jersey with six.
The best cities to live are typically just outside major cities like New York, Los Angeles, Boston, or Chicago. Their residents have access to the high-paying jobs in those cities but can avoid issues that often come with major cities, like higher crime rates and housing costs. These are the most expensive houses to buy in the nation.
Click here to see the best cities to live
Click here to read our detailed methodology

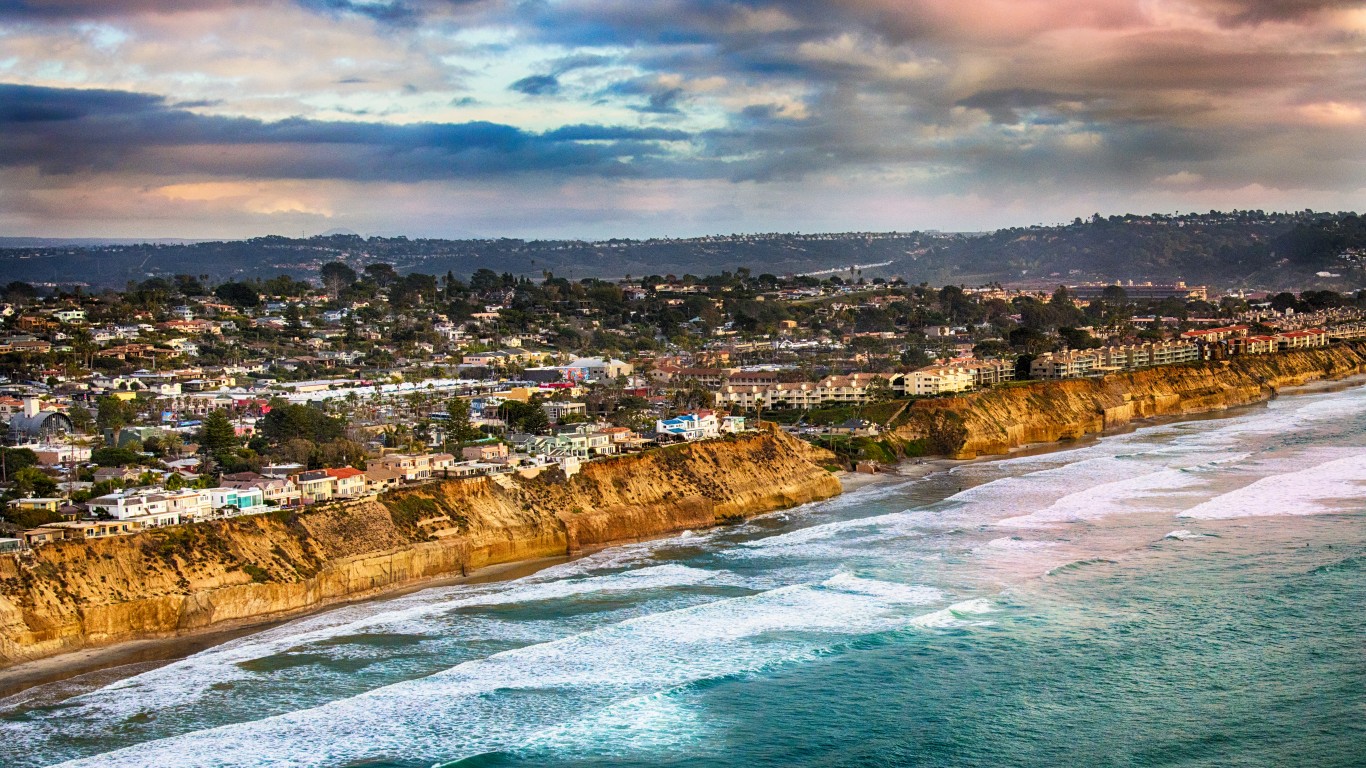
50. Windsor, California
> Population: 27,447
> 5-yr. population change: +1.2%
> Median household income: $106,899
> 5-yr. unemployment rate: 4.1%
Windsor, California, which lies about 50 miles north of San Francisco, ranks as one of America’s 50 best cities to live in large part due to its favorable economic conditions. The city has a median annual household income of nearly $107,000 — well above the national median of $62,843.
Windsor also has a poverty rate of just 4.0%, a fraction of the 13.4% U.S. poverty rate. Its five-year unemployment rate is 4.1%, compared to the national rate of 5.3% over that same time period.
[in-text-ad]

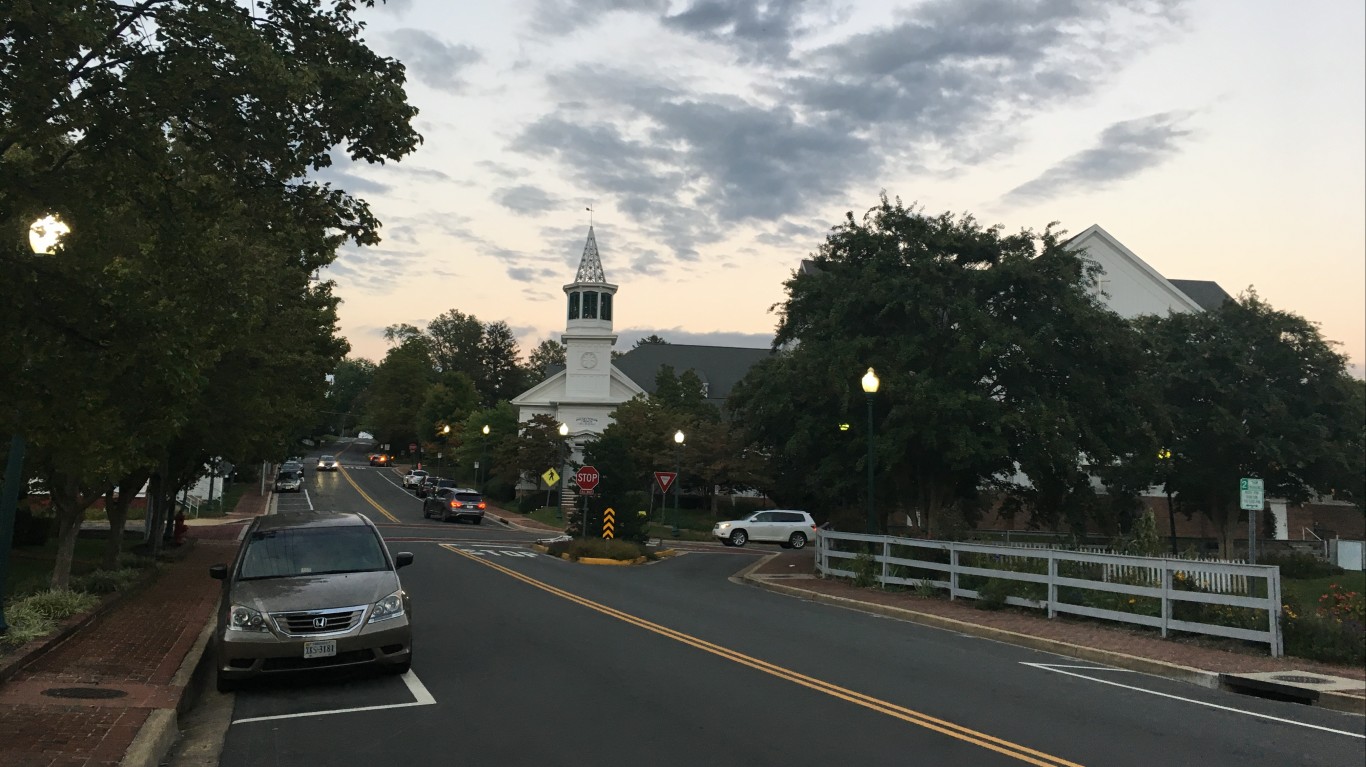
49. Herndon, Virginia
> Population: 24,532
> 5-yr. population change: +1.6%
> Median household income: $111,371
> 5-yr. unemployment rate: 4.1%
Herndon, Virginia, just 15 miles west of Washington, D.C., is one of two Virginia cities to rank among the 50 best cities to live in America. The city is fairly affluent, with a median annual household income over $111,000, and its unemployment rate of 4.1% is relatively low.
Like many other affluent cities, Herndon has a low poverty rate, at just 5.9% — less than half of the 13.4% U.S. poverty rate. The city also has fairly healthy residents, with 21.1% of adults considered obese, compared to nearly 30% nationwide. Nearly all Herndon residents have access to a place where they can exercise.
[recirclink id=964562]

48. Healdsburg, California
> Population: 11,845
> 5-yr. population change: +3.3%
> Median household income: $96,016
> 5-yr. unemployment rate: 2.9%
Healdsburg is a town of nearly 12,000 located in Sonoma County in the heart of California’s wine country. The city has many recreation and leisure options, with more movie theaters, museums, parks, sports centers, hotels, and restaurants per capita than the typical city.
Though Healdsburg’s population increased by just 3.3% over the past five years, its workforce increased by more than 20% during that same time. The city has a low unemployment rate of under 3.0% and a high median household income of over $96,000.
47. Scotts Valley, California
> Population: 11,863
> 5-yr. population change: +1.3%
> Median household income: $108,289
> 5-yr. unemployment rate: 3.6%
Scotts Valley sits about 20 miles south of San Jose near California’s coast. That access to the Silicon Valley area has helped make residents among the more affluent in the country.
The city’s median household income of $108,289 is well above the $62,843 median nationwide, and a quarter of area households earn $200,000 or more per year. Scotts Valley also reported an average unemployment rate of just 3.6% over the last five years, well below the 5.3% rate across the country during that same span.
[in-text-ad-2]

46. New Rochelle, New York
> Population: 79,067
> 5-yr. population change: +0.8%
> Median household income: $81,311
> 5-yr. unemployment rate: 6.1%
New Rochelle, which sits north of New York City, ranks among the best cities to live in America. The city has a relatively low violent crime rate of 124 incidents per 100,000 residents, roughly one-third the national violent crime rate.
With its proximity to New York City, New Rochelle residents have better commuting options than residents of most other cities. Nearly one-third of New Rochelle commuters do not take a car to work, compared to less than 10% of all American commuters.

45. Goleta, California
> Population: 30,975
> 5-yr. population change: +2.1%
> Median household income: $98,005
> 5-yr. unemployment rate: 5.5%
Goleta, which lies just west of Santa Barbara, is one of 20 California cities to rank among the 50 best cities to live in America. The area is relatively affluent, with a median annual household income just over $98,000.
Goleta residents tend to report relatively healthy habits — 86.0% of resident adults report getting at least some exercise in their leisure time, compared to 77.3% of all American adults. More than 92% of residents also have somewhere they can go to get exercise, as the city has an outsized share of gyms and other recreational activity centers.
[in-text-ad]
44. Revere, Massachusetts
> Population: 53,692
> 5-yr. population change: +0.8%
> Median household income: $62,568
> 5-yr. unemployment rate: 5.4%
Revere is one of seven Massachusetts cities to rank among the 50 best cities to live. The city, just north of Boston, has relatively healthy residents, with a low obesity rate and a high share of residents who exercise in their free time.
Revere offers commuters more transit options than the typical city, as over a quarter of commuters take public transit. Just 56.3% of workers drive to work by themselves — 20 percentage points lower than the rate nationwide. One study found that long commutes are associated with high cholesterol and elevated blood pressure, as well as anxiety, stress, and poor sleep.
[recirclink id=956476]
43. Harrison, New Jersey
> Population: 17,213
> 5-yr. population change: +19.2%
> Median household income: $69,604
> 5-yr. unemployment rate: 5.6%
Harrison, New Jersey, is just over the Passaic River from Newark and within commuting distance from New York City. It is one of the fastest growing cities to rank among the best places to live, with its population increasing by over 19% over the past five years.
Harrison is home to Red Bull Arena, where the New York Red Bulls of Major League Soccer play their home games. The city has higher than typical concentrations of fitness and recreational centers, bars, and restaurants as well.

42. Westfield, New Jersey
> Population: 29,877
> 5-yr. population change: -2.5%
> Median household income: $170,798
> 5-yr. unemployment rate: 2.7%
Westfield, New Jersey, has one of the lowest violent crime rates out of the more than 2,000 cities considered for this list. It reported just 13.4 murders, rapes, robberies, and aggravated assaults per 100,000 residents, a fraction of the U.S. violent crime rate of 367 per 100,000.
In spite of being one of the best cities to live in the country, Westfield has shrunk in recent years. The city, just west of New York City, had a 2.5% population decline over the past five years.
[in-text-ad-2]
41. Chelsea, Massachusetts
> Population: 39,992
> 5-yr. population change: +7.8%
> Median household income: $56,802
> 5-yr. unemployment rate: 4.7%
Chelsea, Massachusetts, which sits just north of Boston, is one of the faster growing cities in the country. Over the past five years, its population increased by 7.8% to nearly 40,000 people. The overall U.S. population increased by 3.4% during that same time period.
Chelsea has some of the best health outcomes among American cities. It has a 30-day mortality rate of just 9.8% among Medicare recipients who suffer health challenges like heart failure, pneumonia, stroke, and more. The nationwide rate is 10.7%. The city also has a relatively low share of residents who are obese and who get no leisure time exercise.
40. Lake Forest, Illinois
> Population: 19,173
> 5-yr. population change: +1.4%
> Median household income: $172,165
> 5-yr. unemployment rate: 4.0%
Lake Forest, Illinois, is about 30 miles north of Chicago, along the shores of Lake Michigan. Like many other smaller cities just outside major cities, Lake Forest is very affluent, with a median household income of $172,165 — more than $100,000 higher than the U.S. median household income.
Lake Forest has a very low violent crime rate of 42 incidents per 100,000, well below the 367 per 100,000 violent crime rate nationwide. The city is also close to Northwestern University in Evanston, and more than 80% of adult residents hold at least a bachelor’s degree.
[in-text-ad]
39. Lone Tree, Colorado
> Population: 12,923
> 5-yr. population change: +4.8%
> Median household income: $120,392
> 5-yr. unemployment rate: 2.8%
Lone Tree, Colorado, is a town of nearly 13,000 just south of Denver. The city’s residents tend to be economically well off, with a median household income of over $120,000. Lone Tree also has a poverty rate of just 2.2%, well below the 13.4% poverty rate nationwide.
Lone Tree residents also tend to be healthy — just 20.1% of adults are obese, compared to 29.7% of all American adults. The city also has a relatively low rate of overdose deaths, at 9.0 per 100,000 residents. Nationwide, the rate is more than twice as high, at 22.5 fatal overdoses per 100,000 residents.
[recirclink id=946029]

38. Bellaire, Texas
> Population: 18,815
> 5-yr. population change: +7.3%
> Median household income: $206,734
> 5-yr. unemployment rate: 2.0%
Bellaire, Texas, just southwest of Houston, ranks as one of the 50 best cities in America to live in. The city is one of the most affluent in the country, with most households earning over $200,000.
Bellaire’s average unemployment rate over the last five years was just 2.0%, less than half of the comparable national rate. The city also has a 2.3% poverty rate, a fraction of the U.S. rate of 13.4%. Owning one’s home can help build wealth, and nearly 90% of Bellaire homes are owner-occupied, compared to 64% of all homes nationwide.

37. Durango, Colorado
> Population: 18,588
> 5-yr. population change: +7.6%
> Median household income: $66,160
> 5-yr. unemployment rate: 4.8%
The population of Durango in southwestern Colorado grew by 7.6% over the past five years, more than double the national growth rate of 3.4% during that same time. The city is walkable, with 11% of commuters walking to their jobs, and 8.1% cycling there.
Durango is home to Fort Lewis College, a four-year institution. College towns frequently rank among the best places to live as they tend to have young, healthy, and well-educated populations. Nationwide, 6.9% of the total population is enrolled in college. In Durango, college students make up 14.2% of the population.
[in-text-ad-2]
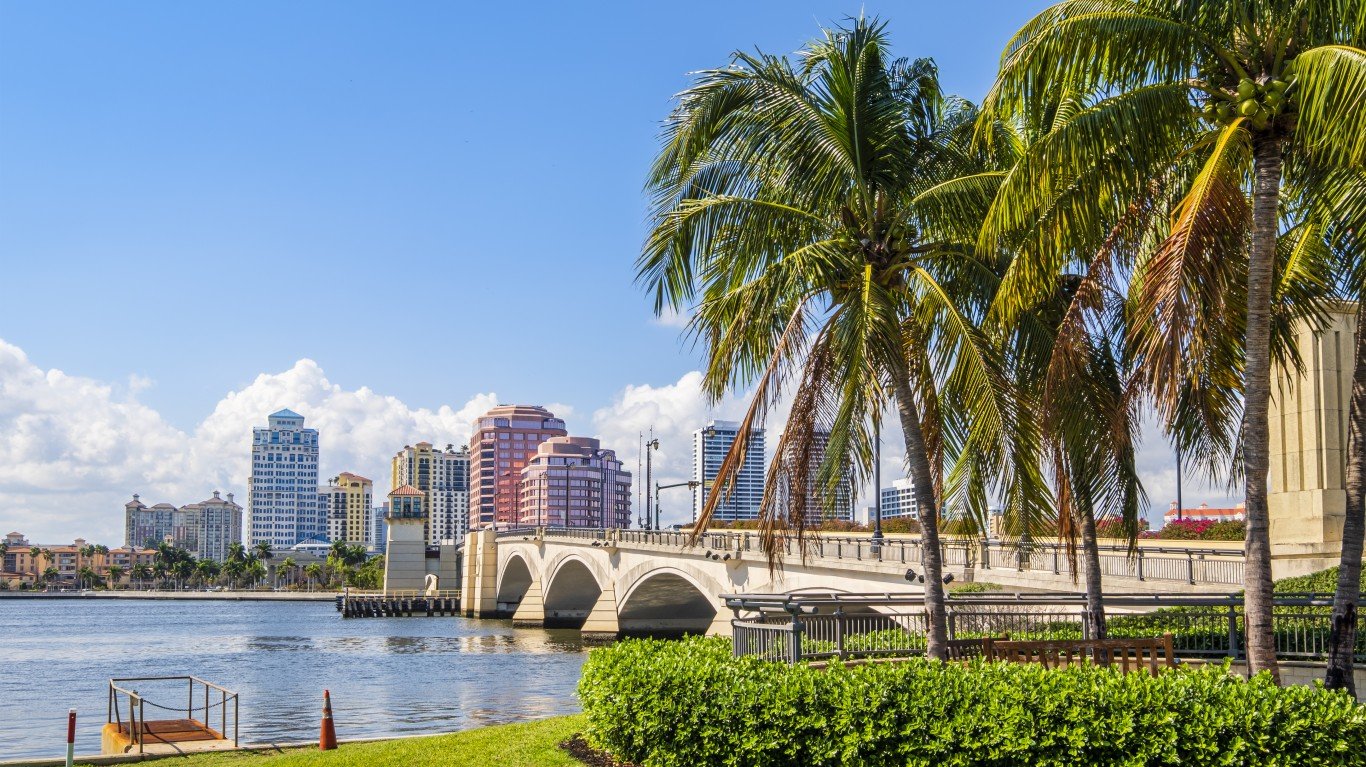
36. Palm Beach, Florida
> Population: 8,723
> 5-yr. population change: +4.5%
> Median household income: $141,348
> 5-yr. unemployment rate: 2.3%
Palm Beach is the lone Florida city to rank among the 50 best places to live in America. The city’s population is well educated, with 67.9% of residents 25 and older holding at least a bachelor’s degree. This high level of educational attainment has likely helped contribute to the relatively high median household income, which, at $141,348, is more than double the U.S. median.
Palm Beach is a safe place to live, with just 92 violent crimes per 100,000 people reported. Nationwide, the violent crime rate is 367 incidents per 100,000. A popular retirement destination, just 30.7% of Palm Beach residents are employed, compared to 47.7% of all Americans.

35. Bainbridge Island, Washington
> Population: 24,486
> 5-yr. population change: +5.5%
> Median household income: $117,990
> 5-yr. unemployment rate: 3.1%
Bainbridge Island, Washington, is a city that sits on an island just across the Eliot Bay from Seattle. The city has a median household income of $118,000 and an average poverty rate of just 3.6% over the past five years.
Real estate on Bainbridge Island is in high demand and as a result not that affordable. The median home is worth six times as much as the city’s median household income. Nationwide, the median home is worth 3.5 times as much as the median household income. Still, nearly 80% of homes in Bainbridge Island are owned by those who live in them, well above the U.S. homeownership rate of 64%.
[in-text-ad]
34. Vienna, Virginia
> Population: 16,489
> 5-yr. population change: +2.0%
> Median household income: $161,196
> 5-yr. unemployment rate: 2.4%
Vienna, Virginia, which is just outside of Washington D.C., is one of the best cities in America to live in. Its median household income of $161,196 is nearly $100,000 higher than the U.S. median. It also has a relatively low poverty rate, at just 2.8%.
Vienna residents tend to have relatively healthy habits. Just 15.0% of residents get no exercise in their leisure time, compared to 22.7% of all Americans. Active lifestyles help reduce the risk of obesity, and just 21.1% of Vienna adult residents are obese, well below the national adult obesity rate of 29.7%.
[recirclink id=964562]

33. Chatham, New Jersey
> Population: 8,816
> 5-yr. population change: -2.0%
> Median household income: $192,321
> 5-yr. unemployment rate: 5.2%
Due in large part to strong economic conditions, Chatham, New Jersey, ranks as one of the best cities to live in America. The city has a median household income of $192,321, well above the U.S. median of $62,843.
The poverty rate in Chatham is just 1.2%, one of the lowest out of more than 27,000 cities in the country. Home values tend to reflect what people in an area can afford, but even though Chatham’s residents tend to be wealthy, homes are relatively affordable. The median home value is 3.9 times higher than the median household income in the city — higher than the national affordability ratio of 3.5 but lower than every other city to rank among the best places to live.

32. Belmont, Massachusetts
> Population: 26,113
> 5-yr. population change: +3.7%
> Median household income: $129,380
> 5-yr. unemployment rate: 4.0%
Belmont is one of several Massachusetts cities around Boston to rank among the best cities to live. Those with college degrees tend to have higher earnings than those without. In Belmont, more than three-quarters of adults 25 and older hold at least a bachelor’s degree, compared to 32.1% of all Americans that age. The area’s $129,380 median household income is more than double the U.S. median.
Belmont is one of the safest cities in the country. It has a violent crime rate of 23 reported incidents per 100,000 residents — a fraction of the U.S. violent crime rate of 367 per 100,000 residents.
[in-text-ad-2]

31. San Francisco, California
> Population: 874,961
> 5-yr. population change: +5.5%
> Median household income: $112,449
> 5-yr. unemployment rate: 4.2%
San Francisco is by far the largest city to rank among the best cities to live in. Much of the list consists of smaller cities and towns surrounding major cities. San Francisco residents tend to have high earnings, with a median household income nearly $50,000 higher than the U.S. median. The city is also convenient for commuters, with most commuters taking public transit, walking, biking, or working from home.
City residents tend to have a healthy lifestyle. San Francisco is among the most active cities, as more than 85% of residents get some form of exercise in their free time, compared to 77.3% of all Americans. The city has an obesity rate of just 16.9% — one of the lowest in the country.

30. Winchester, Massachusetts
> Population: 22,738
> 5-yr. population change: +4.0%
> Median household income: $169,623
> 5-yr. unemployment rate: 2.0%
Winchester is one of seven different Massachusetts cities to rank among the best cities to live in America. Like most other cities on this list, Winchester has a high median household income, at $169,623.
Winchester has averaged an unemployment rate of just 2.0% over the past five years, less than half of the U.S. unemployment rate during that same time of 5.3%. It also had an average poverty rate in the past five years of 2.3%.
[in-text-ad]

29. West University Place, Texas
> Population: 15,603
> 5-yr. population change: +2.5%
> Median household income: $250,000+
> 5-yr. unemployment rate: 2.6%
West University Place, Texas, is just outside of Houston, and just to the west of Rice University. The city of 15,603 has a violent crime rate of just 38.5 incidents per 100,000 residents — roughly one-tenth of the national violent crime rate.
West University Place is one of fewer than 50 major cities with a median household income of more than a quarter million dollars. Nearly 64% of all households in the city earn more than $200,000 per year, compared to just 7.7% of all U.S. households.
[recirclink id=940603]

28. Wellesley, Massachusetts
> Population: 28,747
> 5-yr. population change: -0.4%
> Median household income: $197,132
> 5-yr. unemployment rate: 4.6%
Wellesley, Massachusetts, is one of the best cities to live in America, with a median household income of nearly $200,000. The city is among the safest in the country, with a violent crime rate of just 24 incidents per 100,000 residents.
The city is home to Wellesley College, Babson College, and a campus of Massachusetts Bay Community College. More than 18% of residents are enrolled in college, whereas just 6.9% of all Americans are enrolled in college. The city has an 83.8% bachelor’s degree attainment rate among adults 25 and older.
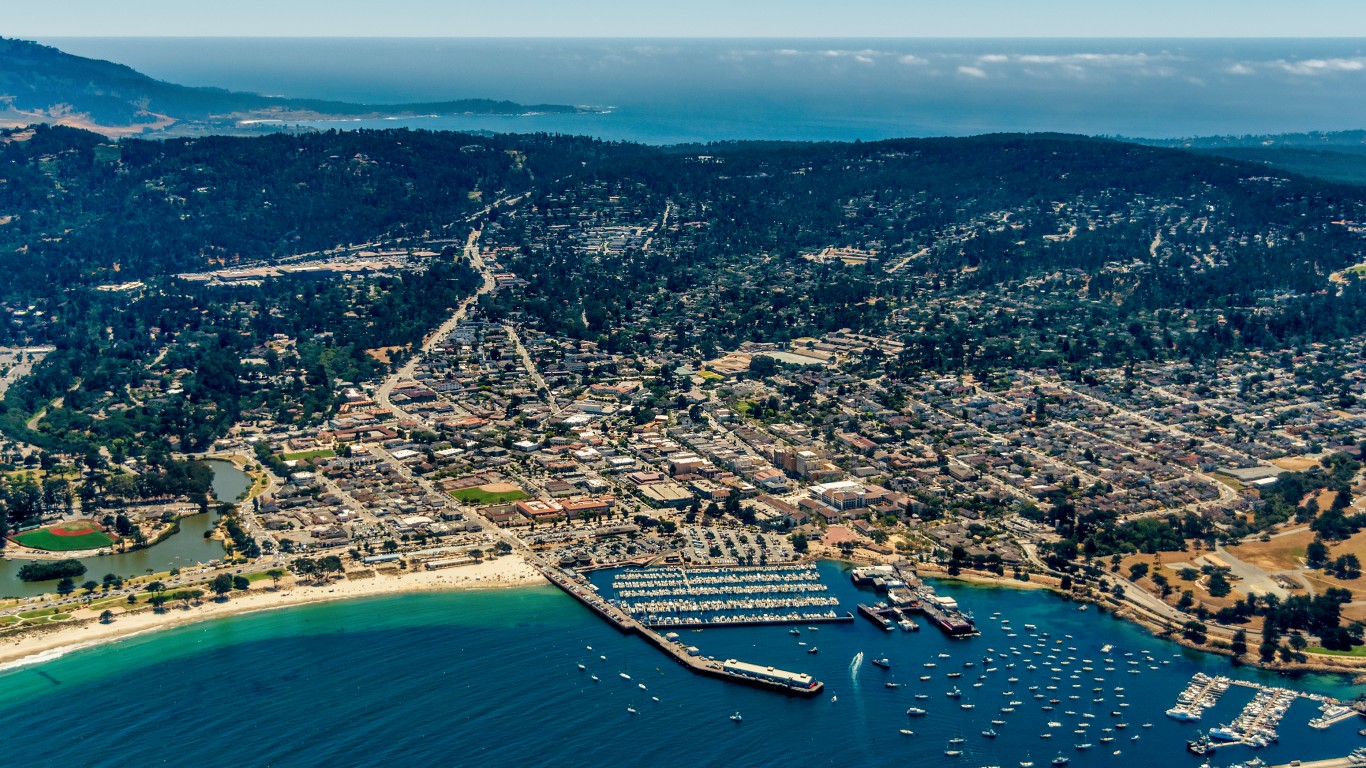
27. Monterey, California
> Population: 28,352
> 5-yr. population change: +1.1%
> Median household income: $80,694
> 5-yr. unemployment rate: 3.0%
Monterey is a coastal city in Central California, one of 20 California cities to rank among the best places to live in America. The city has a relatively high median household income, at $80,694. The city’s five-year unemployment rate is also low, at 3.0%.
The city is home to Presidio of Monterey, an Army base that houses the Defense Language Institute Foreign Language Center. More than 3,000 active duty armed forces members live in Monterey.
[in-text-ad-2]

26. Santa Barbara, California
> Population: 91,376
> 5-yr. population change: +1.9%
> Median household income: $76,606
> 5-yr. unemployment rate: 3.8%
Santa Barbara, along the Central California coast, is one of the best cities to live in America. The city has a relatively high median household income, at $76,606. Its average unemployment rate over the past five years was just 3.8%, well below the 5.3% comparable national rate.
Santa Barbara has a large labor force, as nearly 56% of city residents are employed compared to 47.7% of all Americans. The city is also one of the more active ones in the country — just 14% of adult residents say they get no exercise in their free time, compared to 22.7% of all American adults.
25. Summit, New Jersey
> Population: 21,913
> 5-yr. population change: +0.4%
> Median household income: $157,835
> 5-yr. unemployment rate: 5.5%
Like many other cities that rank among the best places to live, Summit, New Jersey, is within commuting distance of a major city. The city is less than 20 miles away from New York City, providing residents with ample job opportunities.
Workers with a college degree tend to have higher earnings, and in Summit, 71.0% of residents 25 and older have at least a bachelor’s degree. This may be one of the reasons why the city’s median household income is relatively high, at $157,835.
[in-text-ad]

24. Port Washington, New York
> Population: 15,808
> 5-yr. population change: -0.2%
> Median household income: $141,667
> 5-yr. unemployment rate: 2.2%
Port Washington, New York, located on the North Shore of Long Island, is one of the 25 best cities to live in America. City residents have access to the high-paying jobs in New York City, and the city’s median household income is $141,667.
Port Washington is one of the safer cities in the country, with a violent crime of 38 incidents per 100,000 residents — roughly one-tenth of the U.S. violent crime rate. In spite of its positive attributes, the population of Port Washington contracted over the past five years, declining by 0.2% to 15,808.
[recirclink id=964562]
23. Hinsdale, Illinois
> Population: 17,710
> 5-yr. population change: +4.8%
> Median household income: $203,368
> 5-yr. unemployment rate: 2.9%
Less than 20 miles from downtown Chicago, Hinsdale, Illinois, ranks among the best cities to live in America. More than 80% of city residents 25 and older hold at least a bachelor’s degree, which has likely contributed to the high income levels — most Hinsdale households earn over $200,000 per year.
Economic conditions in Hinsdale are much better than they are, on average, nationwide. The city’s five-year average poverty rate of 2.2% is a fraction of the 13.4% national rate over the same time. Its unemployment rate is also relatively low, at just 2.9% during that same time period.
22. Solana Beach, California
> Population: 13,356
> 5-yr. population change: +1.6%
> Median household income: $108,118
> 5-yr. unemployment rate: 3.2%
Solana Beach is a relatively affluent community of over 13,000 just north of San Diego in Southern California. The median annual household income is more than $108,000, well above the national median of $62,843.
Solana Beach residents tend to have healthy lifestyles. Less than 15% of residents report getting no exercise in their leisure time, compared to 22.7% of all Americans. The city’s obesity rate of 20.3% is well below the U.S. rate of 29.7%.
[in-text-ad-2]

21. Coronado, California
> Population: 23,639
> 5-yr. population change: -2.9%
> Median household income: $108,967
> 5-yr. unemployment rate: 4.3%
Coronado, California, makes up the small strip of land across the San Diego Bay from the city of San Diego. Home to North Island Naval Station, more than 17% of Coronado residents are in the armed forces. The city is relatively safe, with a violent crime rate of 38 incidents per 100,000 residents, a fraction of the U.S. rate.
Waterfront property tends to be fairly expensive, and Coronado is no exception. The typical house in the city is worth over $1.6 million, or 14.8 times more than the median household income — one of the highest affordability ratios in the country.
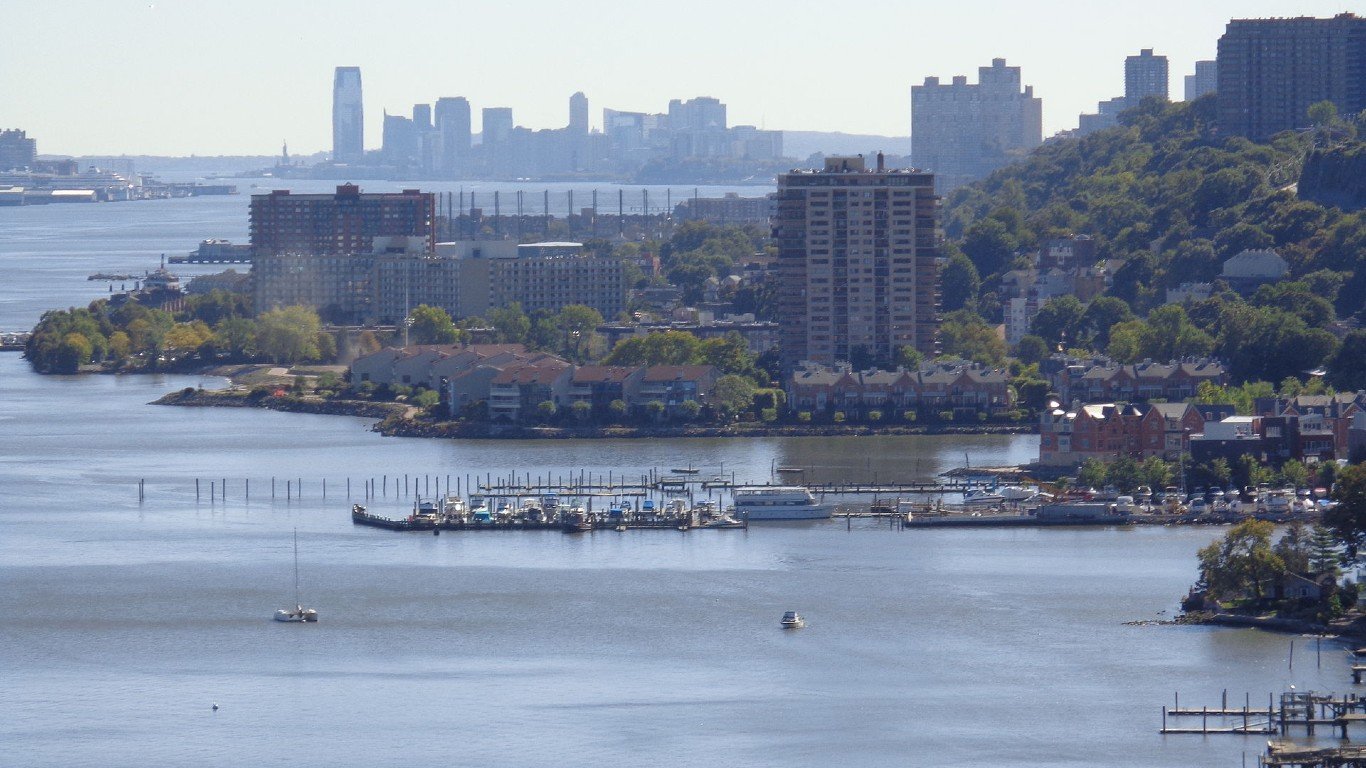
20. Edgewater, New Jersey
> Population: 12,403
> 5-yr. population change: +3.6%
> Median household income: $127,221
> 5-yr. unemployment rate: 3.5%
Edgewater, New Jersey, is a town of more than 12,000 that sits just across the Hudson River from New York City. City residents are financially well-off, with a median household income of $127,221, which is more than double the U.S. median.
Like many other wealthy cities, Edgewater residents are unlikely to face serious financial hardship. Just 6.9% are living below the poverty line, and its five-year unemployment rate of 3.5% is well below the comparable U.S. unemployment rate of 5.3%.
[in-text-ad]
19. Somerville, Massachusetts
> Population: 80,906
> 5-yr. population change: +4.3%
> Median household income: $97,328
> 5-yr. unemployment rate: 3.3%
Somerville, Massachusetts, just outside of Boston, ranks as one of America’s best cities to live in. The city is conveniently located for commuters, as fewer than half rely on a car to get to their job. Most workers either walk, bike, or take public transportation to jobs that tend to pay well. The city’s median household income is over $97,000.
More than two thirds of Somerville residents are employed, compared to less than half of all Americans. The city’s unemployment rate of 3.3% is two full percentage points lower than the U.S. unemployment rate over the last five years.
[recirclink id=956476]

18. Paradise Valley, Arizona
> Population: 14,362
> 5-yr. population change: +8.4%
> Median household income: $211,393
> 5-yr. unemployment rate: 2.1%
Paradise Valley, just outside of Phoenix, is one of America’s best cities to live in, and the only city in Arizona to make the list. The city is prosperous, with a median annual household income of $211,393, which is well more than triple the U.S. median of $62,843.
In addition to high incomes, Paradise Valley residents are able to build wealth through homeownership. More than 93% of homes are owner-occupied, compared to 64.0% of homes nationwide. Home values are likely to continue increasing in the area as demand grows with the population. Over the past five years, the number of Paradise Valley residents increased by 8.4%.

17. Highland Park, Texas
> Population: 9,168
> 5-yr. population change: +4.2%
> Median household income: $211,136
> 5-yr. unemployment rate: 1.4%
Highland Park is a Dallas suburb of just over 9,000 people. It is one of three Texas cities to rank among the best places to live. One of the most affluent places in the country, most Highland Park households earn over $200,000 per year.
Highland Park workers have an average commute time of less than 18 minutes, which is well below the average American commute of nearly 27 minutes. Financial hardship is very uncommon in Highland Park, as it has a five-year unemployment rate of just 1.4% and a poverty rate of 2.3%.
[in-text-ad-2]
16. Brookline, Massachusetts
> Population: 59,180
> 5-yr. population change: +0.3%
> Median household income: $117,326
> 5-yr. unemployment rate: 2.8%
Brookline, Massachusetts, is one of several Boston suburbs to rank among the best cities to live in America. City residents are financially well-off, with a median annual household income of $117,326. The city also has a relatively low unemployment rate, at 2.8%.
Brookline offers residents a wide array of entertainment and recreational options. Residents have more restaurants, rec centers, golf courses, sports venues, and other options than residents of the typical U.S. city. It is also relatively safe, with both violent crime and property crime rates less than half of the national rates.

15. Winnetka, Illinois
> Population: 12,428
> 5-yr. population change: +0.5%
> Median household income: $250,000+
> 5-yr. unemployment rate: 2.4%
Winnetka, Illinois, is north of Chicago, along the shores of Lake Michigan. The city is one of just a few dozen cities in America with a median household income over $250,000. Also, over the past five years, the city’s unemployment rate has averaged just 2.4% and the poverty rate averaged 2.9%, well below the national rates of 5.3% and 13.4%, respectively.
Winnetka is one of the 10 safest cities in America, with a violent crime rate of just 8 incidents per 100,000 residents, well below the national rate of 367 per 100,000. The city had no reported murders, rapes, or robberies in the most recent year.
[in-text-ad]

14. Darien, Connecticut
> Population: 21,742
> 5-yr. population change: +2.6%
> Median household income: $232,523
> 5-yr. unemployment rate: 4.9%
Darien, near the southwestern tip of the state, is the lone city in Connecticut to rank among America’s best cities to live. Within commuting distance of New York City and its job market, Darien residents have a median household income of $232,523 — nearly four times higher than the U.S. median.
Darien residents tend to make healthy lifestyle choices, as just 17.3% of residents get no exercise in their leisure time. The city also has a relatively low obesity rate of 21.2%.
[recirclink id=946029]

13. Orinda, California
> Population: 19,646
> 5-yr. population change: +6.8%
> Median household income: $223,217
> 5-yr. unemployment rate: 3.8%
Orinda, California, is in the San Francisco Bay area, just east of Berkeley. It is one of the most affluent cities in the country, with a median household income of $223,217 — well above the U.S. median of $62,843.
Over the past five years, Orinda’s population grew by 6.8%, adding over 1,200 residents and growing to nearly 20,000 people. Expansion tends to drive up real estate prices, but despite a median home value of nearly $1.5 million, more than 90% of Orinda homes are owner-occupied.

12. Laguna Beach, California
> Population: 23,036
> 5-yr. population change: -0.3%
> Median household income: $129,983
> 5-yr. unemployment rate: 6.0%
Laguna Beach, California, is a city of 23,000 that is about 40 miles south of Los Angeles. The median household income is nearly $130,000 — more than double the median household income nationwide.
Though the city is well-off, the labor pool is shrinking. The number of people working in Laguna Beach declined by 3.0% over the past five years, as the population shrank by 0.3% during that same time period.
[in-text-ad-2]

11. Rye, New York
> Population: 15,820
> 5-yr. population change: -0.5%
> Median household income: $192,688
> 5-yr. unemployment rate: 4.1%
Rye, New York, sits just north of New York City. Area residents are well-off, with a median annual household income of $192,688. The city has an unemployment rate of 4.1% and a poverty rate of just 4.0%.
Rye is one of the safest cities in America, with a violent crime rate of just 6 incidents per 100,000 residents. Only a few other cities in the entire country have lower violent crime rates. It also had fewer than 100 property crimes reported per 100,000 residents. The national property crime rate is 2,110 incidents per 100,000.
10. Hoboken, New Jersey
> Population: 53,193
> 5-yr. population change: +2.3%
> Median household income: $147,620
> 5-yr. unemployment rate: 3.0%
Hoboken, New Jersey, ranks as the 10th best city to live in America — the highest ranked city outside of the state of California. The city sits just across the Hudson River from New York City, providing its residents access to the city and all the high-paying jobs and entertainment options available therein.
More than two-thirds of residents, 67.2%, are employed. This is well above the 47.7% employment share nationwide and is likely one reason why Hoboken has a median household income of $147,620 — more than double the U.S. median household income.
[in-text-ad]

9. San Marino, California
> Population: 13,194
> 5-yr. population change: -0.8%
> Median household income: $166,607
> 5-yr. unemployment rate: 1.8%
San Marino, California, is a city of 13,000 just outside of Los Angeles. The city has a median household income of $166,607, over $100,000 higher than the U.S. median. College-educated workers tend to have higher earnings, and 78.1% of San Marino adults aged 25 and older have at least a bachelor’s degree.
San Marino has had one of the strongest job markets in the country — it has averaged a 1.8% unemployment rate over the last five years, roughly a third of the 5.3% unemployment rate nationwide over that same time period. Even though the city’s overall population declined, the number of employed people in the city increased by 7.2% over the past five years, a full percentage point higher than the labor force increase nationwide.
[recirclink id=487977]

8. Manhattan Beach, California
> Population: 35,500
> 5-yr. population change: -0.1%
> Median household income: $153,023
> 5-yr. unemployment rate: 5.1%
Manhattan Beach, California, is a city of 35,500 just outside of Los Angeles, along the Pacific Ocean. Waterfront property tends to be more expensive, and Manhattan Beach is no exception — it is one of just a few dozen cities in America in which most homes are worth over $2 million.
Manhattan Beach ranks as one of America’s best cities to live in large part because of its economic conditions . The median household income is over $150,000, and the poverty rate of 3.2% is more than 10 percentage points lower than the U.S. poverty rate.

7. Newport Beach, California
> Population: 85,694
> 5-yr. population change: -1.0%
> Median household income: $127,223
> 5-yr. unemployment rate: 3.1%
Newport Beach, California, is one of several Los Angeles-area cities to rank among the best cities to live in America. City residents are financially well-off, with a median household income of over $127,000. Residents are also relatively unlikely to be unemployed or live below the poverty line.
Newport Beach residents are among the healthiest in the country. It is one of a very small share of U.S. cities with an obesity rate of under 20%. More than 99% of residents have somewhere they can get exercise.
[in-text-ad-2]

6. Malibu, California
> Population: 12,620
> 5-yr. population change: -1.6%
> Median household income: $150,747
> 5-yr. unemployment rate: 3.5%
Malibu, California, is just west of Los Angeles, along the Pacific Coast. Like many other cities that rank among the best places to live, Malibu has a high level of educational attainment — 66.0% of adults 25 and older have at least a bachelor’s degree.
High educational attainment is linked with higher incomes, and Malibu has a median household income of over $150,000. Residents are relatively unlikely to face financial hardship, as the city has just a 3.5% unemployment rate, and only 7.1% of residents live below the poverty line.

5. Los Altos, California
> Population: 30,504
> 5-yr. population change: +2.5%
> Median household income: $235,278
> 5-yr. unemployment rate: 3.3%
Los Altos, California, is located in Silicon Valley in between San Francisco and San Jose. It ranks as one of the five best cities to live in the country as financial hardship is relatively uncommon — just 2.8% of residents live below the poverty line, and less than 1% rely on food stamps. Also, the city has a 3.3% unemployment rate.
Incomes tend to rise with educational attainment, and Los Altos is no exception — 84.2% of residents age 25 and older hold at least a bachelor’s degree, well above the 32.1% rate nationwide. This is likely one of the reasons why the city’s median household income is one of the highest in the country, at $235,278.
[in-text-ad]

4. Piedmont, California
> Population: 11,317
> 5-yr. population change: +3.3%
> Median household income: $224,659
> 5-yr. unemployment rate: 3.9%
Piedmont, Califiornia, just east of Oakland, is one of nine California cities to rank among the top 10 best cities to live in America. The typical household in the city makes nearly $225,000 per year, and its poverty rate of 2.4% is a fraction of the U.S. rate of 13.4%.
Owning a home can help build wealth, as real estate values increase. In Piedmont, nearly 88% of homes are owner occupied, compared to 64% of all homes nationwide. Most homes in Piedmont are now worth over $2 million.
[recirclink id=940603]

3. Palo Alto, California
> Population: 66,573
> 5-yr. population change: +0.9%
> Median household income: $158,271
> 5-yr. unemployment rate: 3.2%
Palo Alto, California, along the San Francisco Bay, ranks at the third best American city to live in. The city’s median household income is $158,271, which is more than double the U.S. median of $62,843. Financial hardship is uncommon, as just 6.1% of residents live below the poverty line, and the city has an unemployment rate of 3.2%.
Palo Alto residents report some of the best health outcomes in the country.Less than 20% of residents are obese, compared to nearly 30% of all Americans. The city has low rates of overdose deaths, and deaths from issues like heart failure and stroke in Medicaid patients are uncommon as well.
2. Tiburon, California
> Population: 9,144
> 5-yr. population change: +0.5%
> Median household income: $154,915
> 5-yr. unemployment rate: 2.7%
Tiburon, California, just across the San Francisco Bay from both San Francisco and Oakland, ranks as the second best city to live in America. The city of just over 9,000 has a median household income of nearly $150,000 and an unemployment rate roughly half the U.S. rate, at 2.7%.
One of Tiburon’s top positive attributes is its safety. The violent crime rate is zero — no violent crimes were reported in the city last year. The city also reported a property crime rate of 897 per 100,000 residents, less than half the property crime rate nationwide.
[in-text-ad-2]
1. Burlingame, California
> Population: 30,576
> 5-yr. population change: +3.2%
> Median household income: $128,447
> 5-yr. unemployment rate: 4.7%
Burlingame, California, ranks as the best city to live in America. The city, located between San Francisco and San Jose along the San Francisco Bay, has a median household income of $128,447 — more than double the U.S. median of $62,843. Both poverty and unemployment are relatively uncommon.
Burlingame residents have among the highest quality of life and tend to make healthy lifestyle choices. Just 15.6% of residents get no leisure time exercise, compared to 22.7% of all Americans. Chronic health issues are generally uncommon, and nearly all residents have a place to exercise.
Methodology
To identify the best cities to live in, 24/7 Wall St. created a weighted index of 25 measures across four categories: affordability, economy, quality of life, and community.
1.) The affordability category consists of three measures:
- The ratio of median home value to median household income was included at full weight.
- Median property taxes paid as a percentage of median home value was included at one-fourth weight.
- Regional price parity, a measure of cost of living, was included at full weight.
2.) The economy category consists of four measures:
- Median home value was included at full weight.
- Employment growth from 2015 to 2019 was included at one-half weight.
- The ratio of the number of employed workers to the total population was included at one-half weight.
- The unemployment rate was included at full weight.
3.) The quality of life category consists of six measures:
- The poverty rate was included at full weight.
- The share of the population in urban census tracts at least 1 mile from a grocery store and in rural census tracts at least 10 miles from a grocery store, a measure of poor food access, was included at full weight.
- The distance from the city center to the nearest hospital was included at full weight.
- The percentage of patients discharged from acute care hospitals who were readmitted to the hospital within 30 days was included at full weight.
- The percentage of heart attack, coronary artery bypass grafting (CABG) surgery, chronic obstructive pulmonary disease (COPD), heart failure, pneumonia, and stroke patients who passed away within 30 days of treatment was included at full weight.
- The number of drug-related fatalities per 100,000 residents was included at one-fourth weight.
4.) The community category consists of 12 measures:
- The percentage of workers 16 and over commuting by public transit, walking, or other non-car means was included at one-half weight.
- The average travel time to work was included at full weight.
- The number of hospital admissions for conditions that could be treated in an outpatient setting per 1,000 Medicare enrollees — an indication of poor outpatient care and overuse of hospitals — was included at one-half weight.
- The number of violent crimes — homicide, rape, robbery, and aggravated assault — reported per 100,000 residents was included at full weight.
- The number of property crimes — burglary, larceny, motor vehicle theft, and arson — reported per 100,000 residents was included at full weight.
- The number of movie theaters per 100,000 residents was included at one-fourth weight.
- The number of libraries and archives per 100,000 residents was included at one-fourth weight.
- The number of theater companies and dinner theaters per 100,000 residents was included at one-fourth weight.
- The number of museums per 100,000 residents was included at one-fourth weight.
- The number of nature parks and similar institutions per 100,000 residents was included at one-fourth weight.
- The number of alcoholic drinking places per 100,000 residents was included at one-fourth weight.
- The number of restaurants and other eating places per 100,000 residents was included at one-fourth weight.
Data on population, employment, unemployment, median home value, median household income, median property taxes paid, commuter characteristics, average travel time to work, and poverty came from the U.S. Census Bureau’s American Community Survey and are five-year estimates for the period 2015 to 2019. Employment data used to calculate five-year employment growth are five-year estimates for the years 2011 to 2015. Data on cost of living came from real estate analysis company ATTOM Data Solutions and is for the year 2014.
Data on the share of the population in urban census tracts or areas at least 1 mile from a grocery store and in rural census tracts at least 10 miles from a grocery store, a measure of poor food access, came from the U.S. Department of Agriculture’s 2020 update to the Food Access Research Atlas and is at the county level.
Data on hospital locations came from the Centers for Medicare & Medicaid Services. Data on 30-day readmission rates and 30-day mortality rates also came from the CMS and are for the period July 2016 to June 2019. Data was aggregated to the city level for cities with at least one hospital, and was aggregated to the county level for cities with no hospitals. Data on the number of drug-related deaths per 100,000 residents per year from the period 2017 to 2019 is from the Centers for Disease Control and Prevention and is at the county level. Data on preventable hospitalizations per 1,000 Medicare enrollees came from the 2021 County Health Rankings and Roadmaps program, a collaboration between the Robert Wood Johnson Foundation and University of Wisconsin Population Health Institute, and is at the county level.
Data on the number of violent crimes and property crimes reported per 100,000 residents came from the FBI’s Uniform Crime Reporting Program and are for the year 2019.
Data on the number of movie theaters, libraries and archives, theater companies and dinner theaters, museums, nature parks and other similar institutions, alcoholic beverage drinking places, and restaurants and other eating places came from the Census Bureau’s 2019 County Business Patterns series and is at the county level.
To avoid geographic clustering, we only took the top-ranking city in a given county. Our list includes cities, towns, villages, boroughs, and census-designated places. We did not include places with fewer than 8,000 residents in our analysis.
Contact [email protected] for any questions or corrections.