When it comes to exercising, residents of a few cities are leading the pack. Nationally, the share of adults who meet or exceed federal exercise guidelines — 150 minutes of moderate aerobic exercise or 75 minutes of vigorous physical activity a week – is on the rise. Nearly 25% of adults Americans met the requirements in 2017, compared to just over 18% a decade earlier, according to the Centers for Disease Control and Prevention. While this is encouraging news, not all cities boast high exercise rates.
24/7 Tempo reviewed data on leisure exercise and access to places for physical activity from the County Health Rankings & Roadmaps report to determine the cities with the lowest rates of regular exercise. About 22.2% of adult Americans report that they do not get any physical activity in their leisure time.
Click here for the 50 cities getting the least exercise
Click here for our methodology
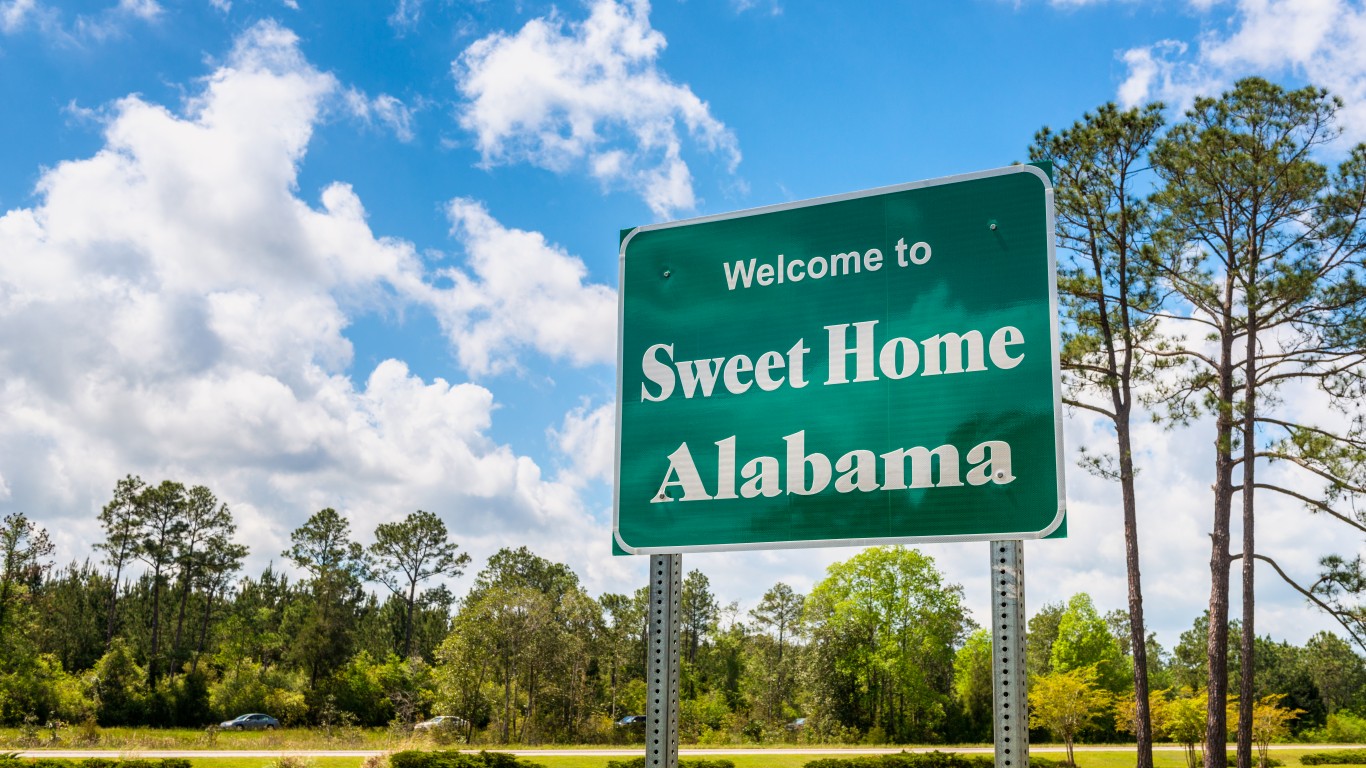
Five of the 10 cities with the lowest share of adults who work out or engage in any physical activity in their free time are in Alabama. In fact, many of the cities where the fewest percentage of adults are exercising are in the South. Similarly, the cities where most people engage in physical activity are also concentrated in one region of the country — these are the 50 most physically active cities in America.
Exercise has been shown to be a crucial factor in maintaining a healthy weight as it helps burn body fat and build muscle tissue. Physical activity is also linked to better quality of life as well as living longer. Some research shows that even just 15 minutes a day of physical activity provides benefits, including lowering the risk of heart disease, diabetes, and some common types of cancer.
Consistent lack of exercise appears to play a role in certain unhealthy outcomes. Of the 50 cities that get the least exercise, only three have an adult obesity rate that is lower than the national rate of 28.5%. Only one city — Williamsport, Pennsylvania — has a lower share of the adult population reporting being in poor or fair health than the U.S. share of 16.0%.
Income also appears to be a factor in whether people spend time exercising. Of the 50 cities where the lowest share of adults exercise, only one has median annual household income higher the national median of nearly $62,000. Wealthier people are more likely to exercise as they have more money to spare on gym memberships and working out apparel.
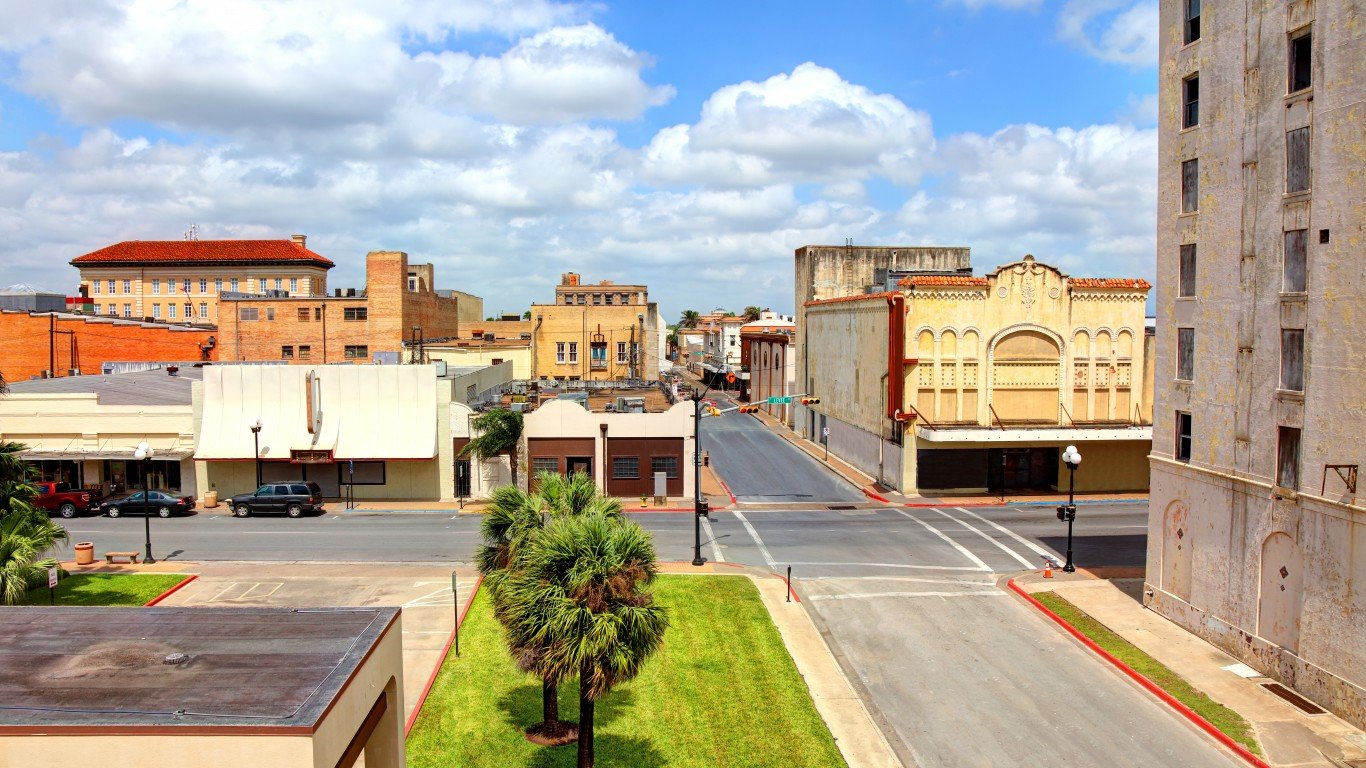
50. Brownsville-Harlingen, Texas
> Adults who don’t exercise: 25.1% (US avg.: 22.2%)
> Pop. with access to places for physical activity: 60.3% (US avg.: 83.9%)
> Adult obesity rate: 31.3% (US avg.: 28.5%)
> Pop. over 20 with diabetes: 10.0% (US avg.: 8.5%)
> Adults in poor or fair health: 32.3% (US avg.: 16.0%)
> Median household income: $38,378 (US median: $61,937)
[in-text-ad]
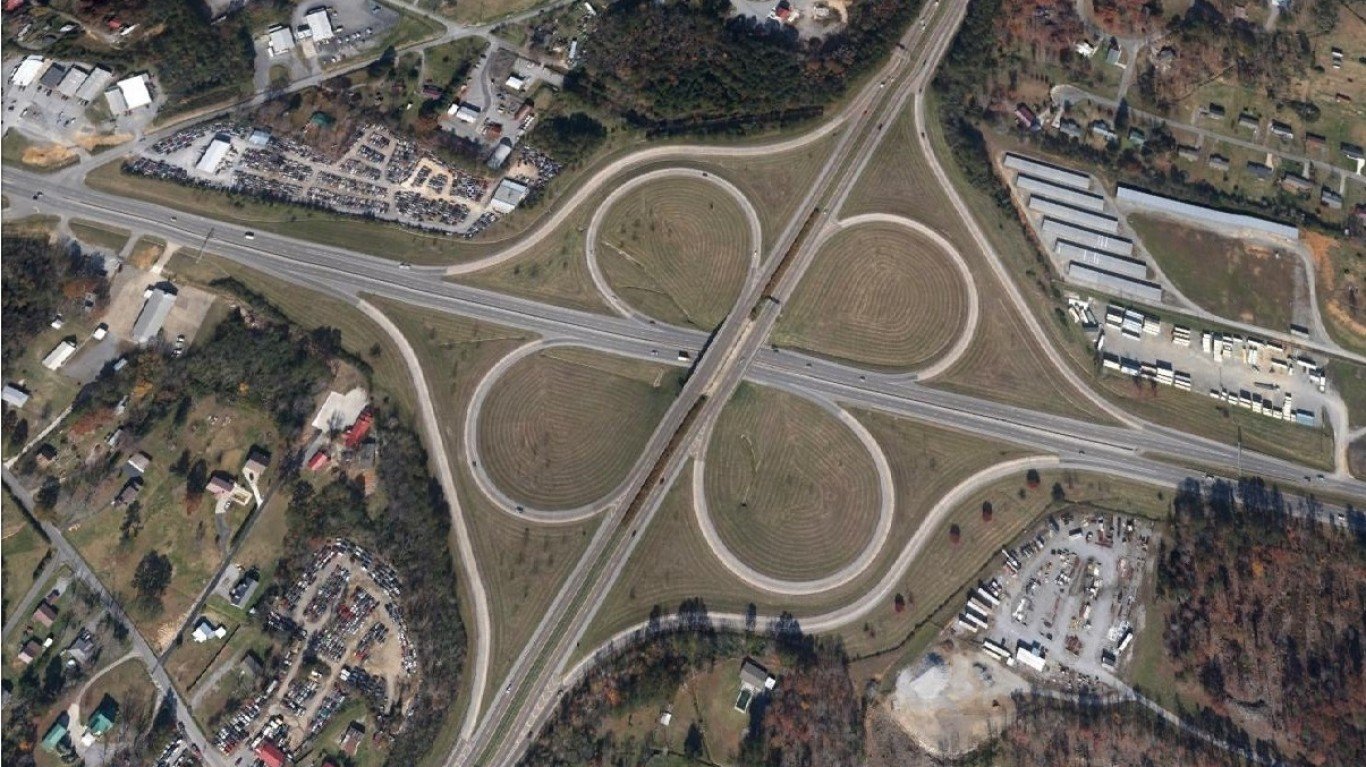
49. Cleveland, Tennessee
> Adults who don’t exercise: 32.2% (US avg.: 22.2%)
> Pop. with access to places for physical activity: 75.5% (US avg.: 83.9%)
> Adult obesity rate: 37.4% (US avg.: 28.5%)
> Pop. over 20 with diabetes: 15.1% (US avg.: 8.5%)
> Adults in poor or fair health: 20.8% (US avg.: 16.0%)
> Median household income: $48,101 (US median: $61,937)
[recirclink id=638021]
48. Valdosta, Georgia
> Adults who don’t exercise: 26.0% (US avg.: 22.2%)
> Pop. with access to places for physical activity: 62.0% (US avg.: 83.9%)
> Adult obesity rate: 35.1% (US avg.: 28.5%)
> Pop. over 20 with diabetes: 16.6% (US avg.: 8.5%)
> Adults in poor or fair health: 22.3% (US avg.: 16.0%)
> Median household income: $35,186 (US median: $61,937)

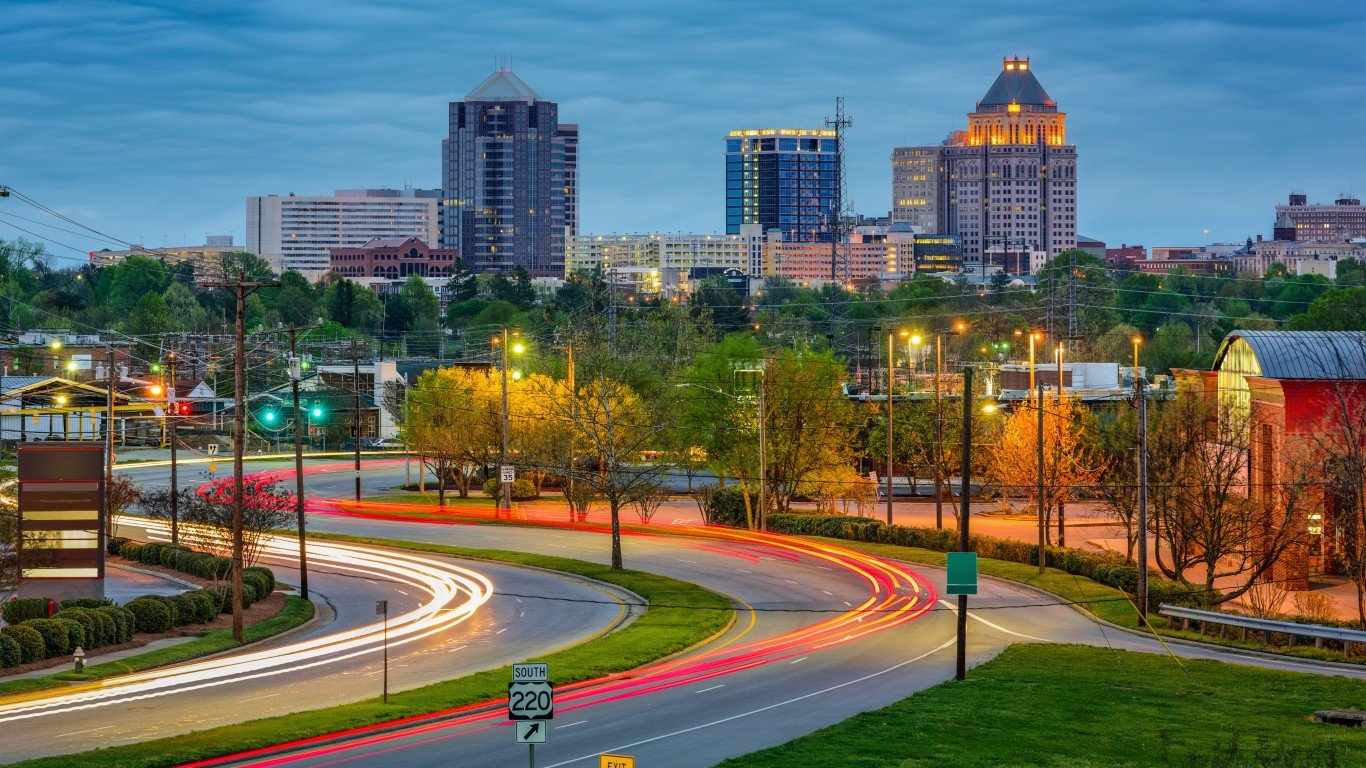
47. Hickory-Lenoir-Morganton, North Carolina
> Adults who don’t exercise: 25.9% (US avg.: 22.2%)
> Pop. with access to places for physical activity: 61.6% (US avg.: 83.9%)
> Adult obesity rate: 31.8% (US avg.: 28.5%)
> Pop. over 20 with diabetes: 10.8% (US avg.: 8.5%)
> Adults in poor or fair health: 17.5% (US avg.: 16.0%)
> Median household income: $47,544 (US median: $61,937)
[in-text-ad-2]
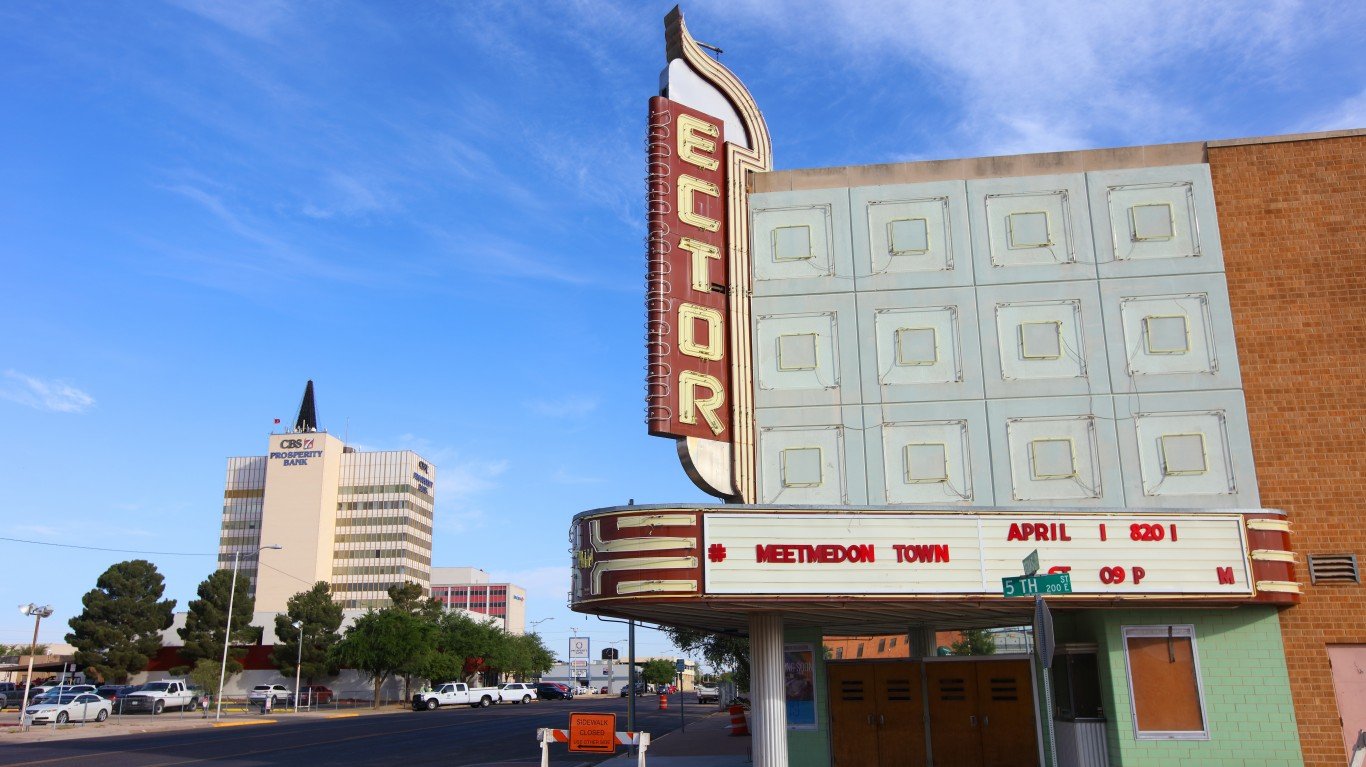
46. Odessa, Texas
> Adults who don’t exercise: 30.5% (US avg.: 22.2%)
> Pop. with access to places for physical activity: 71.5% (US avg.: 83.9%)
> Adult obesity rate: 33.2% (US avg.: 28.5%)
> Pop. over 20 with diabetes: 8.2% (US avg.: 8.5%)
> Adults in poor or fair health: 19.1% (US avg.: 16.0%)
> Median household income: $64,165 (US median: $61,937)

45. Lynchburg, Virginia
> Adults who don’t exercise: 25.4% (US avg.: 22.2%)
> Pop. with access to places for physical activity: 60.2% (US avg.: 83.9%)
> Adult obesity rate: 31.5% (US avg.: 28.5%)
> Pop. over 20 with diabetes: 11.3% (US avg.: 8.5%)
> Adults in poor or fair health: 16.1% (US avg.: 16.0%)
> Median household income: $51,143 (US median: $61,937)
[in-text-ad]

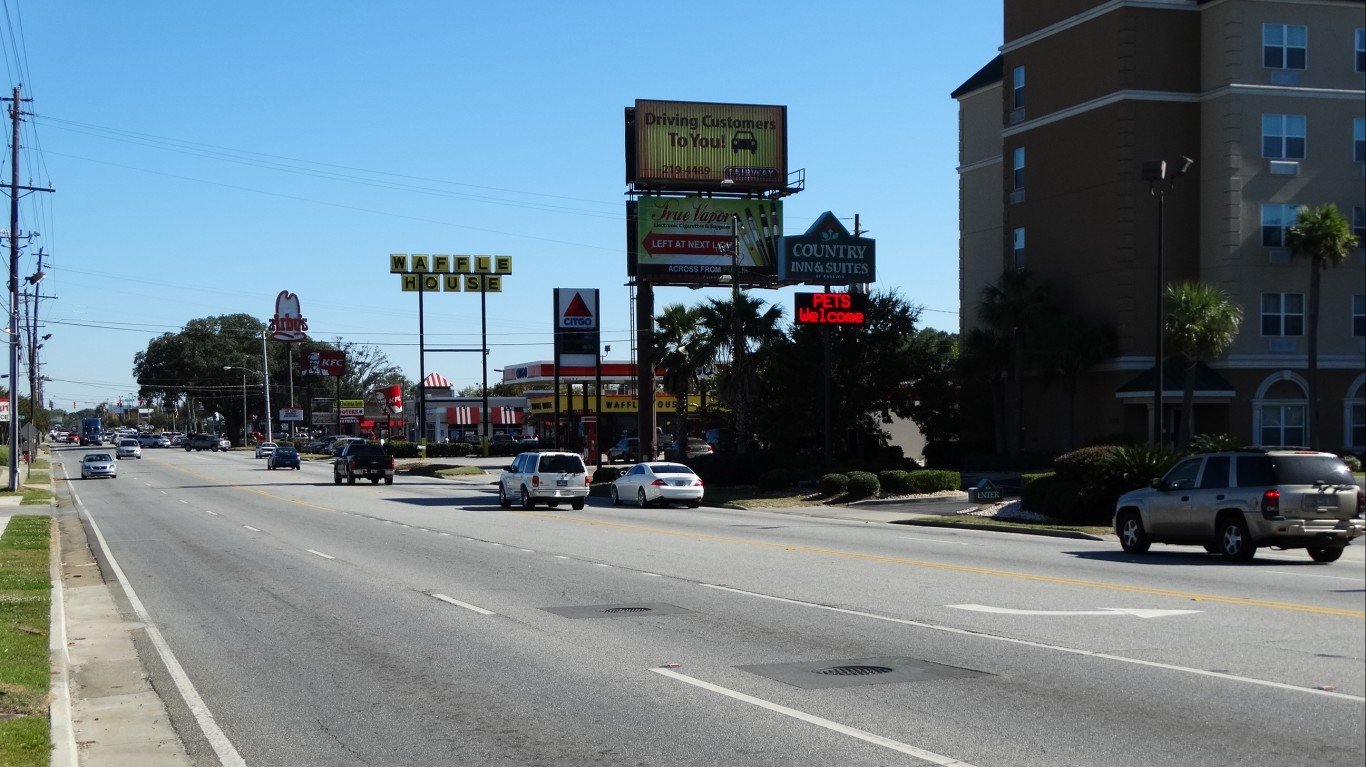
44. Homosassa Springs, Florida
> Adults who don’t exercise: 34.1% (US avg.: 22.2%)
> Pop. with access to places for physical activity: 79.2% (US avg.: 83.9%)
> Adult obesity rate: 27.3% (US avg.: 28.5%)
> Pop. over 20 with diabetes: 10.5% (US avg.: 8.5%)
> Adults in poor or fair health: 19.0% (US avg.: 16.0%)
> Median household income: $39,964 (US median: $61,937)
[recirclink id=566985]
43. Gulfport-Biloxi-Pascagoula, Mississippi
> Adults who don’t exercise: 29.7% (US avg.: 22.2%)
> Pop. with access to places for physical activity: 69.6% (US avg.: 83.9%)
> Adult obesity rate: 34.0% (US avg.: 28.5%)
> Pop. over 20 with diabetes: 11.1% (US avg.: 8.5%)
> Adults in poor or fair health: 19.4% (US avg.: 16.0%)
> Median household income: $47,444 (US median: $61,937)
42. Hot Springs, Arkansas
> Adults who don’t exercise: 35.2% (US avg.: 22.2%)
> Pop. with access to places for physical activity: 81.5% (US avg.: 83.9%)
> Adult obesity rate: 31.2% (US avg.: 28.5%)
> Pop. over 20 with diabetes: 12.8% (US avg.: 8.5%)
> Adults in poor or fair health: 21.2% (US avg.: 16.0%)
> Median household income: $42,779 (US median: $61,937)
[in-text-ad-2]

41. Hanford-Corcoran, California
> Adults who don’t exercise: 17.4% (US avg.: 22.2%)
> Pop. with access to places for physical activity: 42.6% (US avg.: 83.9%)
> Adult obesity rate: 24.0% (US avg.: 28.5%)
> Pop. over 20 with diabetes: 11.1% (US avg.: 8.5%)
> Adults in poor or fair health: 21.7% (US avg.: 16.0%)
> Median household income: $61,663 (US median: $61,937)

40. Kokomo, Indiana
> Adults who don’t exercise: 27.8% (US avg.: 22.2%)
> Pop. with access to places for physical activity: 65.2% (US avg.: 83.9%)
> Adult obesity rate: 32.9% (US avg.: 28.5%)
> Pop. over 20 with diabetes: 13.8% (US avg.: 8.5%)
> Adults in poor or fair health: 17.8% (US avg.: 16.0%)
> Median household income: $55,868 (US median: $61,937)
[in-text-ad]
39. Jackson, Tennessee
> Adults who don’t exercise: 27.7% (US avg.: 22.2%)
> Pop. with access to places for physical activity: 64.9% (US avg.: 83.9%)
> Adult obesity rate: 35.6% (US avg.: 28.5%)
> Pop. over 20 with diabetes: 12.6% (US avg.: 8.5%)
> Adults in poor or fair health: 19.8% (US avg.: 16.0%)
> Median household income: $45,610 (US median: $61,937)
[recirclink id=547692]
38. Hagerstown-Martinsburg, Maryland
> Adults who don’t exercise: 26.6% (US avg.: 22.2%)
> Pop. with access to places for physical activity: 62.2% (US avg.: 83.9%)
> Adult obesity rate: 34.9% (US avg.: 28.5%)
> Pop. over 20 with diabetes: 11.8% (US avg.: 8.5%)
> Adults in poor or fair health: 17.8% (US avg.: 16.0%)
> Median household income: $61,256 (US median: $61,937)
37. Macon-Bibb County, Georgia
> Adults who don’t exercise: 29.9% (US avg.: 22.2%)
> Pop. with access to places for physical activity: 68.8% (US avg.: 83.9%)
> Adult obesity rate: 34.3% (US avg.: 28.5%)
> Pop. over 20 with diabetes: 13.1% (US avg.: 8.5%)
> Adults in poor or fair health: 20.6% (US avg.: 16.0%)
> Median household income: $42,615 (US median: $61,937)
[in-text-ad-2]
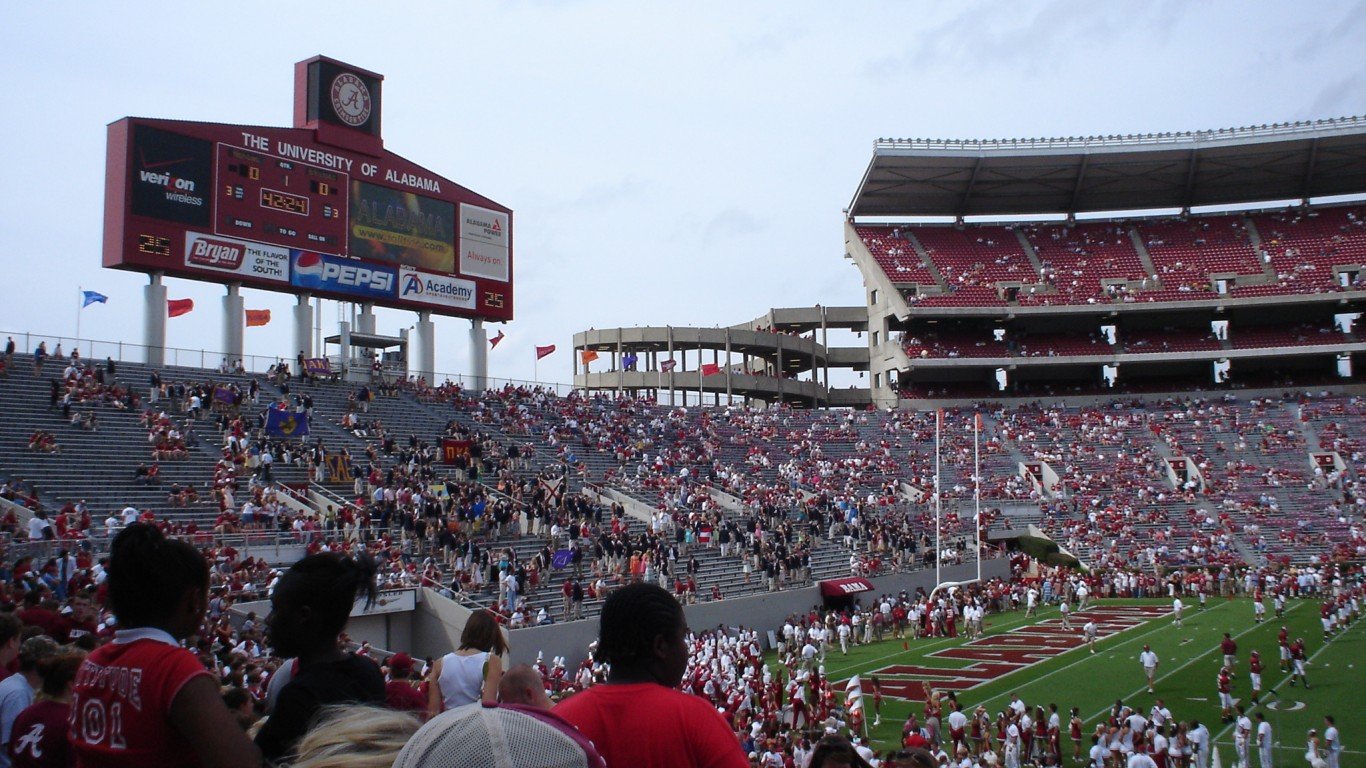
36. Tuscaloosa, Alabama
> Adults who don’t exercise: 27.0% (US avg.: 22.2%)
> Pop. with access to places for physical activity: 62.6% (US avg.: 83.9%)
> Adult obesity rate: 34.8% (US avg.: 28.5%)
> Pop. over 20 with diabetes: 12.3% (US avg.: 8.5%)
> Adults in poor or fair health: 21.6% (US avg.: 16.0%)
> Median household income: $50,939 (US median: $61,937)
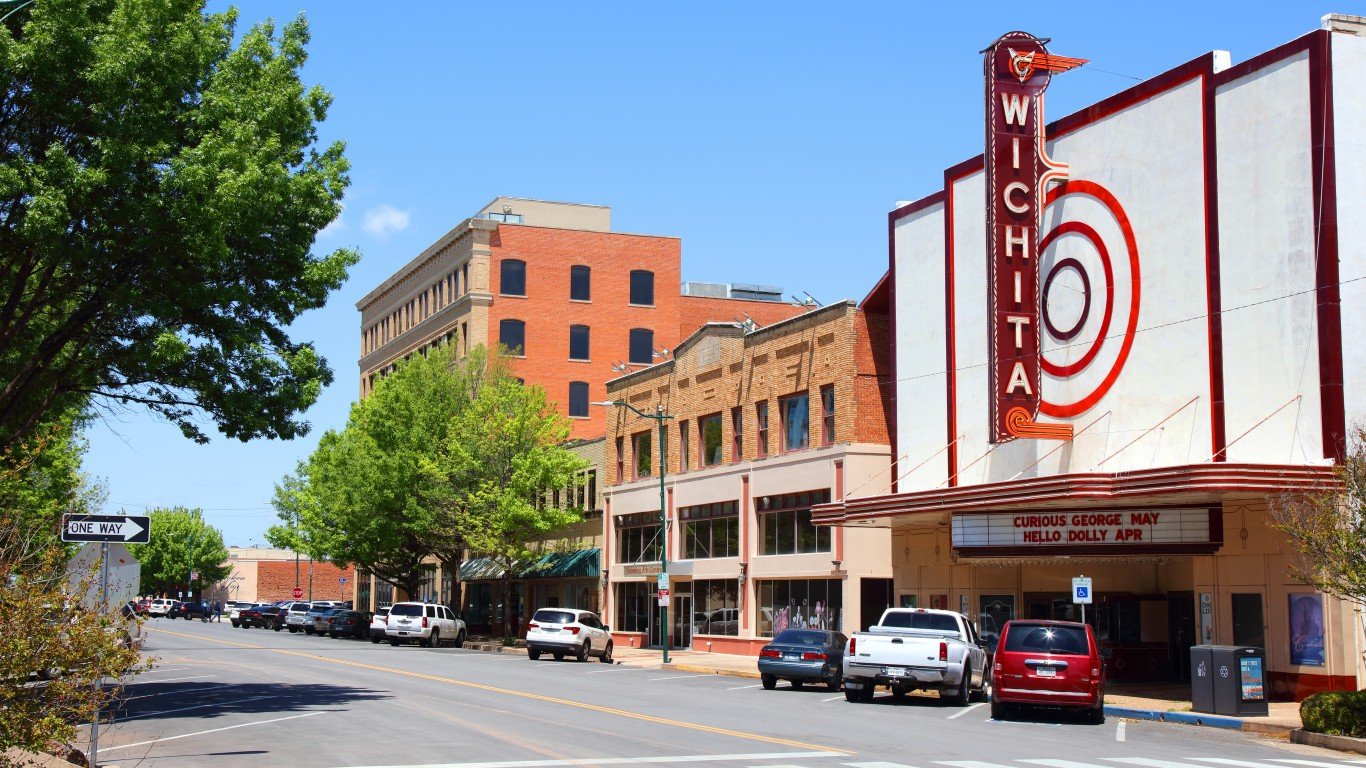
35. Wichita Falls, Texas
> Adults who don’t exercise: 27.5% (US avg.: 22.2%)
> Pop. with access to places for physical activity: 63.6% (US avg.: 83.9%)
> Adult obesity rate: 31.7% (US avg.: 28.5%)
> Pop. over 20 with diabetes: 13.5% (US avg.: 8.5%)
> Adults in poor or fair health: 20.0% (US avg.: 16.0%)
> Median household income: $50,309 (US median: $61,937)
[in-text-ad]
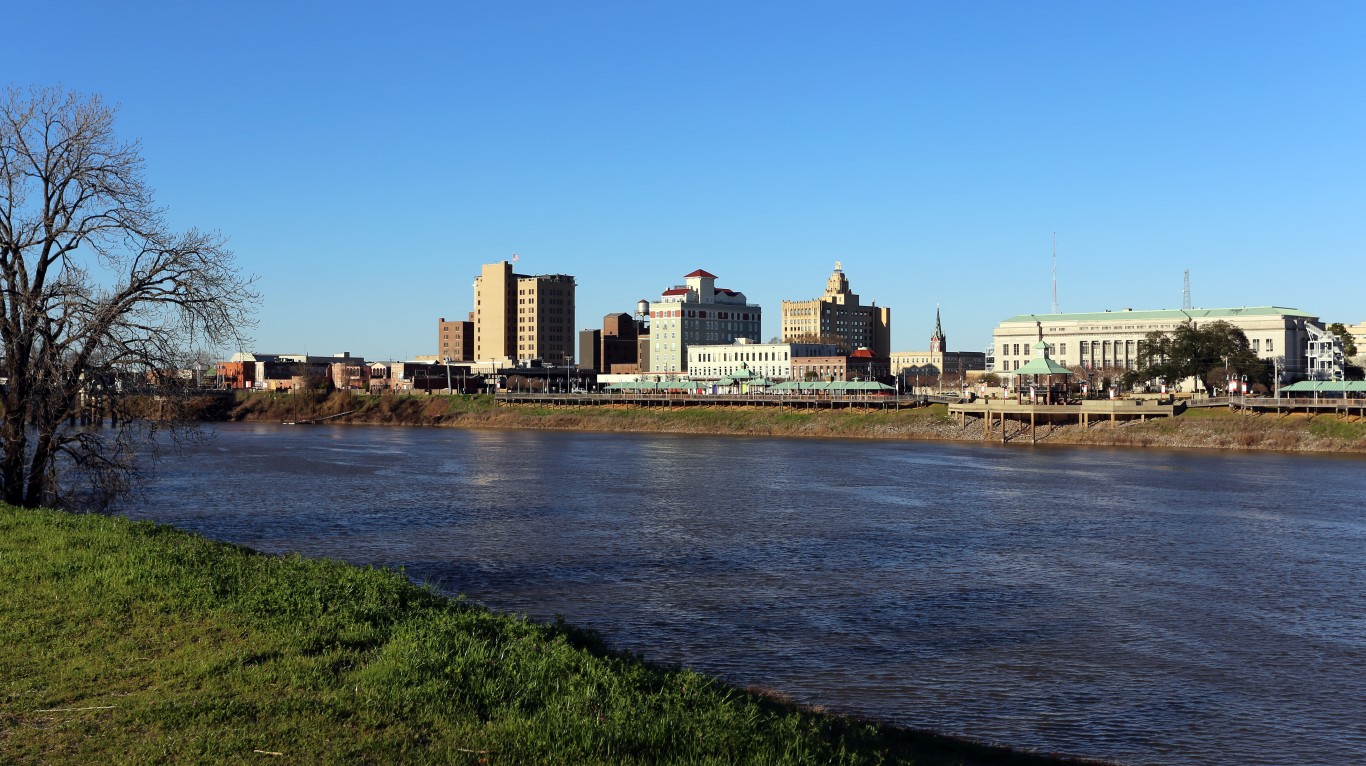
34. Monroe, Louisiana
> Adults who don’t exercise: 30.6% (US avg.: 22.2%)
> Pop. with access to places for physical activity: 70.4% (US avg.: 83.9%)
> Adult obesity rate: 37.3% (US avg.: 28.5%)
> Pop. over 20 with diabetes: 13.3% (US avg.: 8.5%)
> Adults in poor or fair health: 20.3% (US avg.: 16.0%)
> Median household income: $44,353 (US median: $61,937)
[recirclink id=585278]
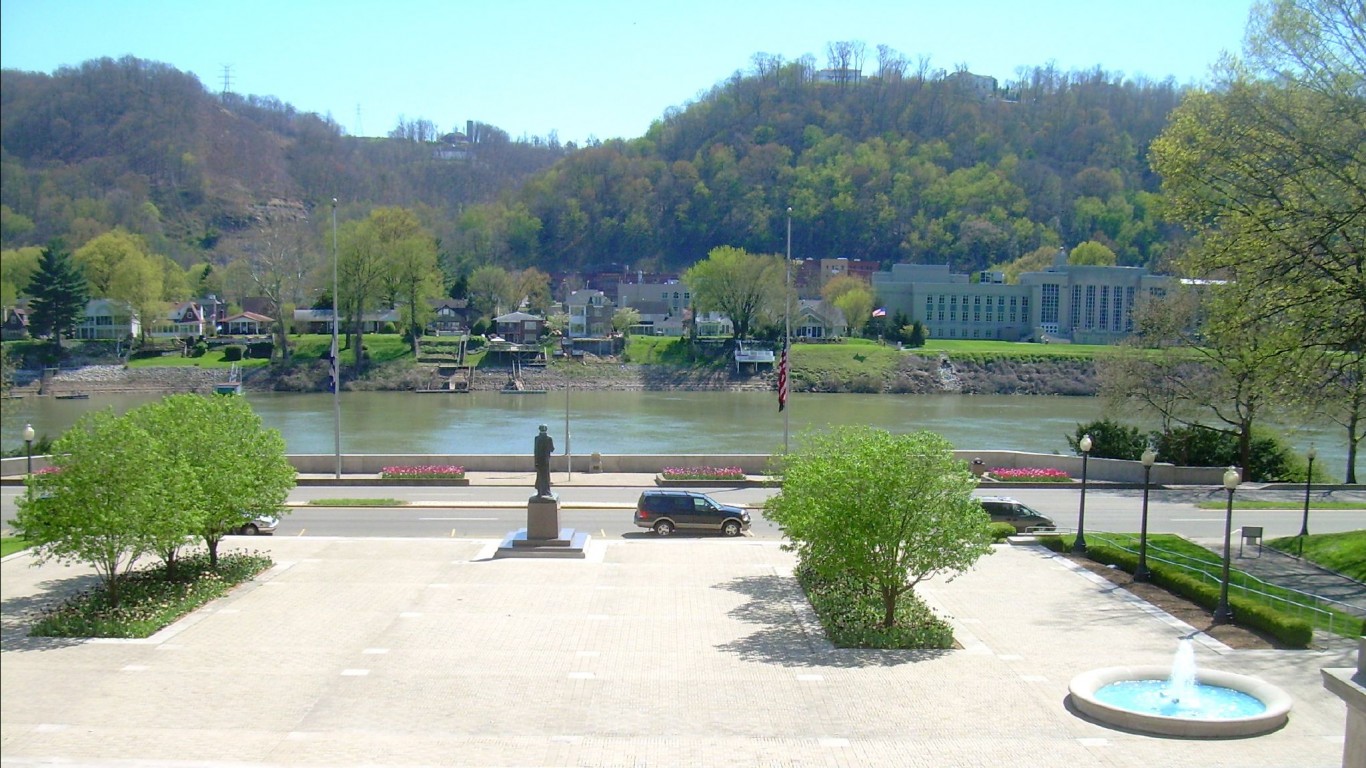
33. Charleston, West Virginia
> Adults who don’t exercise: 27.3% (US avg.: 22.2%)
> Pop. with access to places for physical activity: 62.7% (US avg.: 83.9%)
> Adult obesity rate: 36.2% (US avg.: 28.5%)
> Pop. over 20 with diabetes: 14.1% (US avg.: 8.5%)
> Adults in poor or fair health: 21.7% (US avg.: 16.0%)
> Median household income: $40,806 (US median: $61,937)
32. Houma-Thibodaux, Louisiana
> Adults who don’t exercise: 30.9% (US avg.: 22.2%)
> Pop. with access to places for physical activity: 70.4% (US avg.: 83.9%)
> Adult obesity rate: 40.4% (US avg.: 28.5%)
> Pop. over 20 with diabetes: 11.3% (US avg.: 8.5%)
> Adults in poor or fair health: 19.6% (US avg.: 16.0%)
> Median household income: $51,440 (US median: $61,937)
[in-text-ad-2]
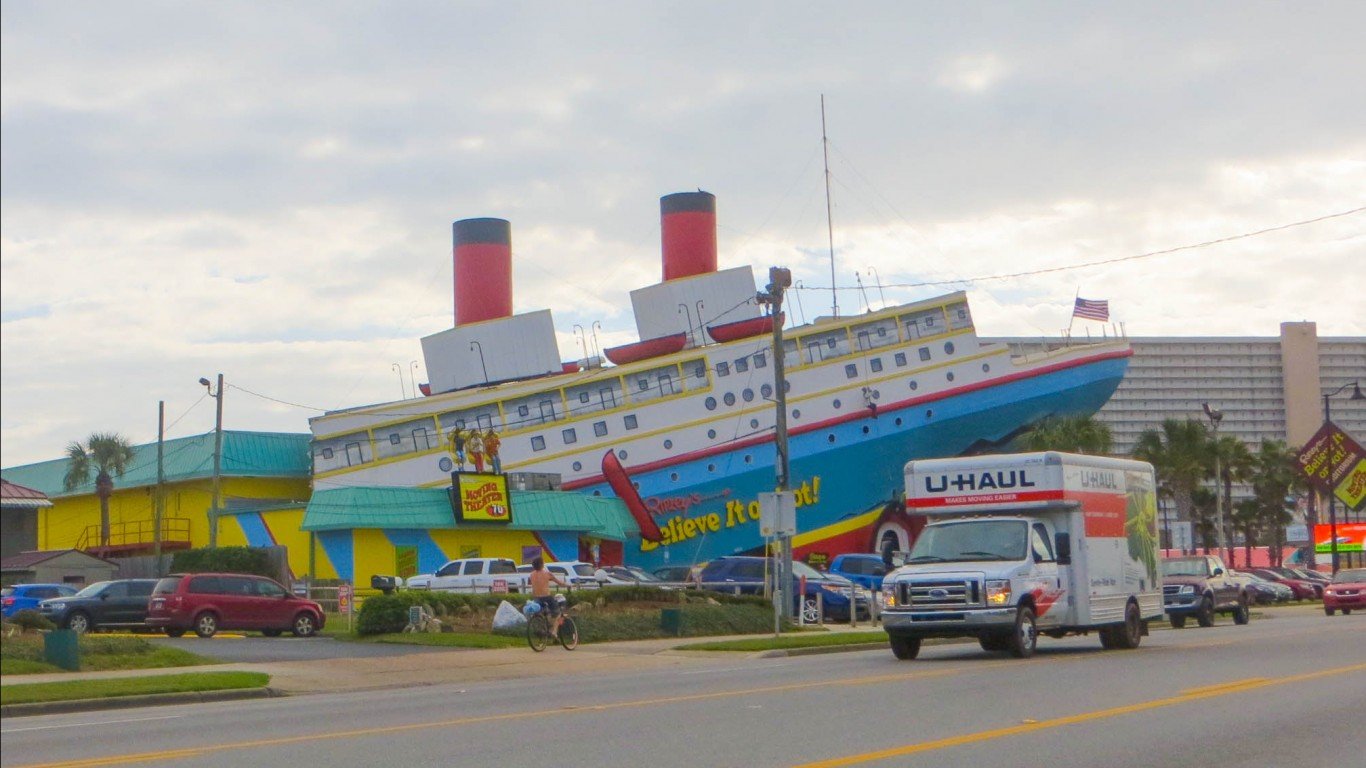
31. Panama City, Florida
> Adults who don’t exercise: 30.9% (US avg.: 22.2%)
> Pop. with access to places for physical activity: 70.3% (US avg.: 83.9%)
> Adult obesity rate: 30.0% (US avg.: 28.5%)
> Pop. over 20 with diabetes: 10.1% (US avg.: 8.5%)
> Adults in poor or fair health: 18.9% (US avg.: 16.0%)
> Median household income: $51,842 (US median: $61,937)

30. Albany, Georgia
> Adults who don’t exercise: 28.2% (US avg.: 22.2%)
> Pop. with access to places for physical activity: 63.6% (US avg.: 83.9%)
> Adult obesity rate: 33.5% (US avg.: 28.5%)
> Pop. over 20 with diabetes: 18.0% (US avg.: 8.5%)
> Adults in poor or fair health: 22.4% (US avg.: 16.0%)
> Median household income: $44,896 (US median: $61,937)
[in-text-ad]

29. Jackson, Mississippi
> Adults who don’t exercise: 29.8% (US avg.: 22.2%)
> Pop. with access to places for physical activity: 66.9% (US avg.: 83.9%)
> Adult obesity rate: 36.1% (US avg.: 28.5%)
> Pop. over 20 with diabetes: 12.5% (US avg.: 8.5%)
> Adults in poor or fair health: 19.5% (US avg.: 16.0%)
> Median household income: $55,700 (US median: $61,937)
[recirclink id=559836]
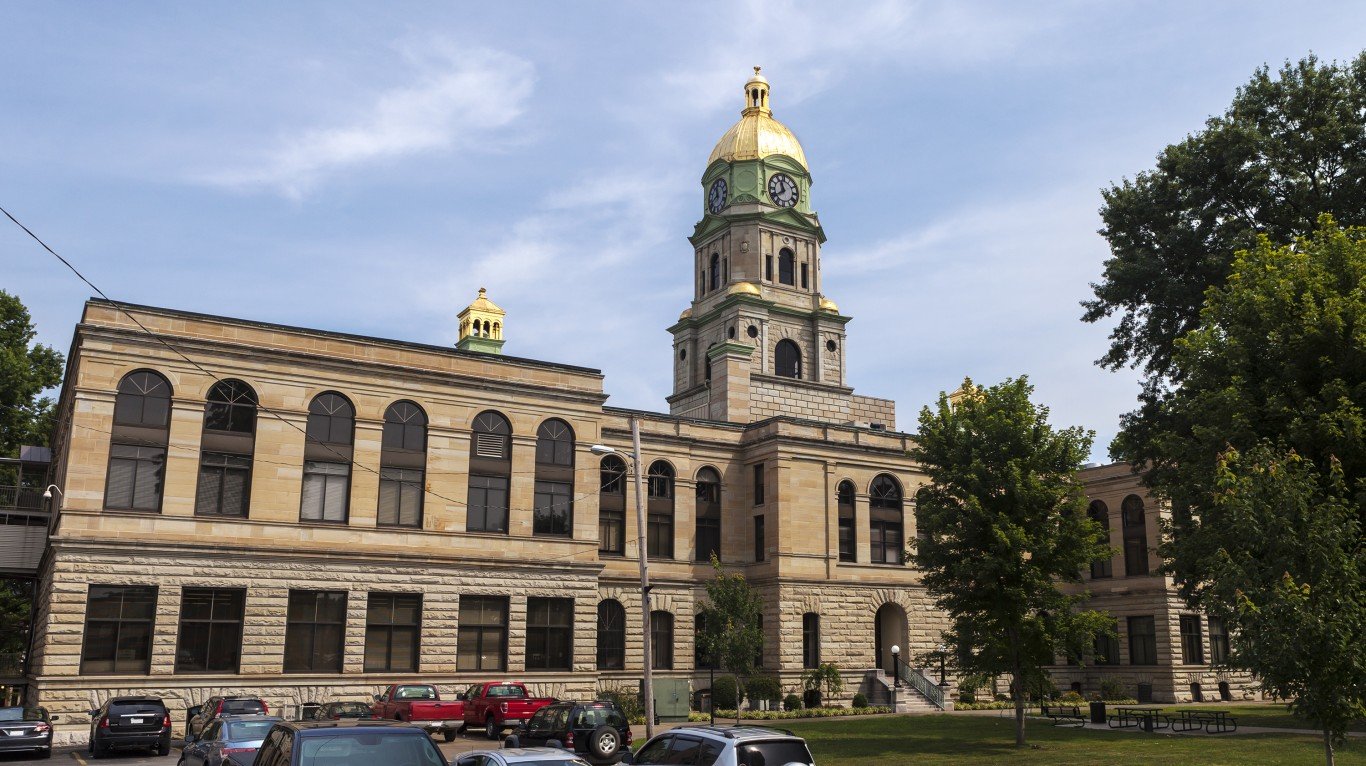
28. Huntington-Ashland, West Virginia
> Adults who don’t exercise: 28.5% (US avg.: 22.2%)
> Pop. with access to places for physical activity: 63.9% (US avg.: 83.9%)
> Adult obesity rate: 36.9% (US avg.: 28.5%)
> Pop. over 20 with diabetes: 14.1% (US avg.: 8.5%)
> Adults in poor or fair health: 21.1% (US avg.: 16.0%)
> Median household income: $45,535 (US median: $61,937)
27. Hinesville, Georgia
> Adults who don’t exercise: 26.9% (US avg.: 22.2%)
> Pop. with access to places for physical activity: 60.1% (US avg.: 83.9%)
> Adult obesity rate: 35.8% (US avg.: 28.5%)
> Pop. over 20 with diabetes: 13.6% (US avg.: 8.5%)
> Adults in poor or fair health: 20.0% (US avg.: 16.0%)
> Median household income: $47,234 (US median: $61,937)
[in-text-ad-2]

26. Enid, Oklahoma
> Adults who don’t exercise: 27.7% (US avg.: 22.2%)
> Pop. with access to places for physical activity: 61.3% (US avg.: 83.9%)
> Adult obesity rate: 37.1% (US avg.: 28.5%)
> Pop. over 20 with diabetes: 8.7% (US avg.: 8.5%)
> Adults in poor or fair health: 19.2% (US avg.: 16.0%)
> Median household income: $53,946 (US median: $61,937)

25. Lawton, Oklahoma
> Adults who don’t exercise: 29.8% (US avg.: 22.2%)
> Pop. with access to places for physical activity: 65.6% (US avg.: 83.9%)
> Adult obesity rate: 32.8% (US avg.: 28.5%)
> Pop. over 20 with diabetes: 9.9% (US avg.: 8.5%)
> Adults in poor or fair health: 19.5% (US avg.: 16.0%)
> Median household income: $52,034 (US median: $61,937)
[in-text-ad]
24. Longview, Texas
> Adults who don’t exercise: 27.4% (US avg.: 22.2%)
> Pop. with access to places for physical activity: 60.2% (US avg.: 83.9%)
> Adult obesity rate: 32.2% (US avg.: 28.5%)
> Pop. over 20 with diabetes: 11.8% (US avg.: 8.5%)
> Adults in poor or fair health: 17.4% (US avg.: 16.0%)
> Median household income: $51,296 (US median: $61,937)
[recirclink id=578236]
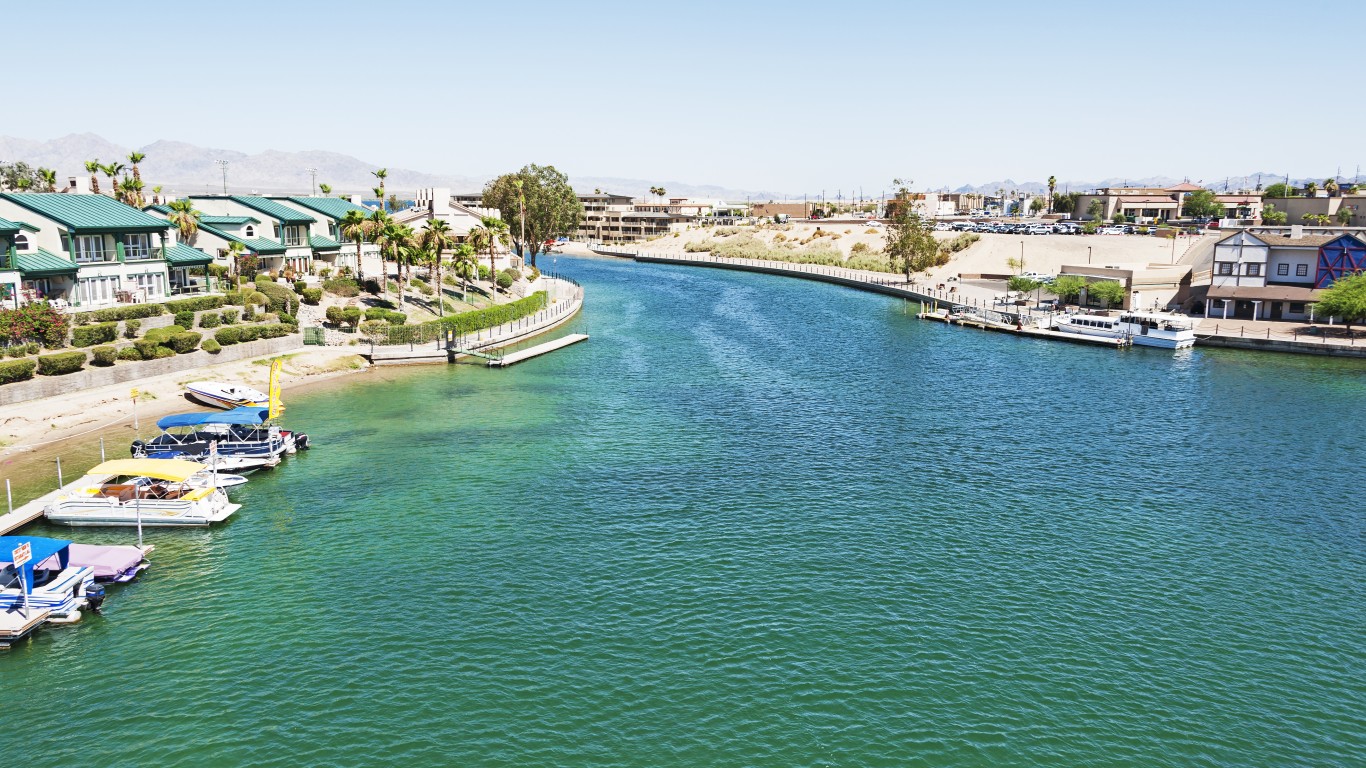
23. Lake Havasu City-Kingman, Arizona
> Adults who don’t exercise: 30.4% (US avg.: 22.2%)
> Pop. with access to places for physical activity: 65.6% (US avg.: 83.9%)
> Adult obesity rate: 31.9% (US avg.: 28.5%)
> Pop. over 20 with diabetes: 10.1% (US avg.: 8.5%)
> Adults in poor or fair health: 20.9% (US avg.: 16.0%)
> Median household income: $46,060 (US median: $61,937)
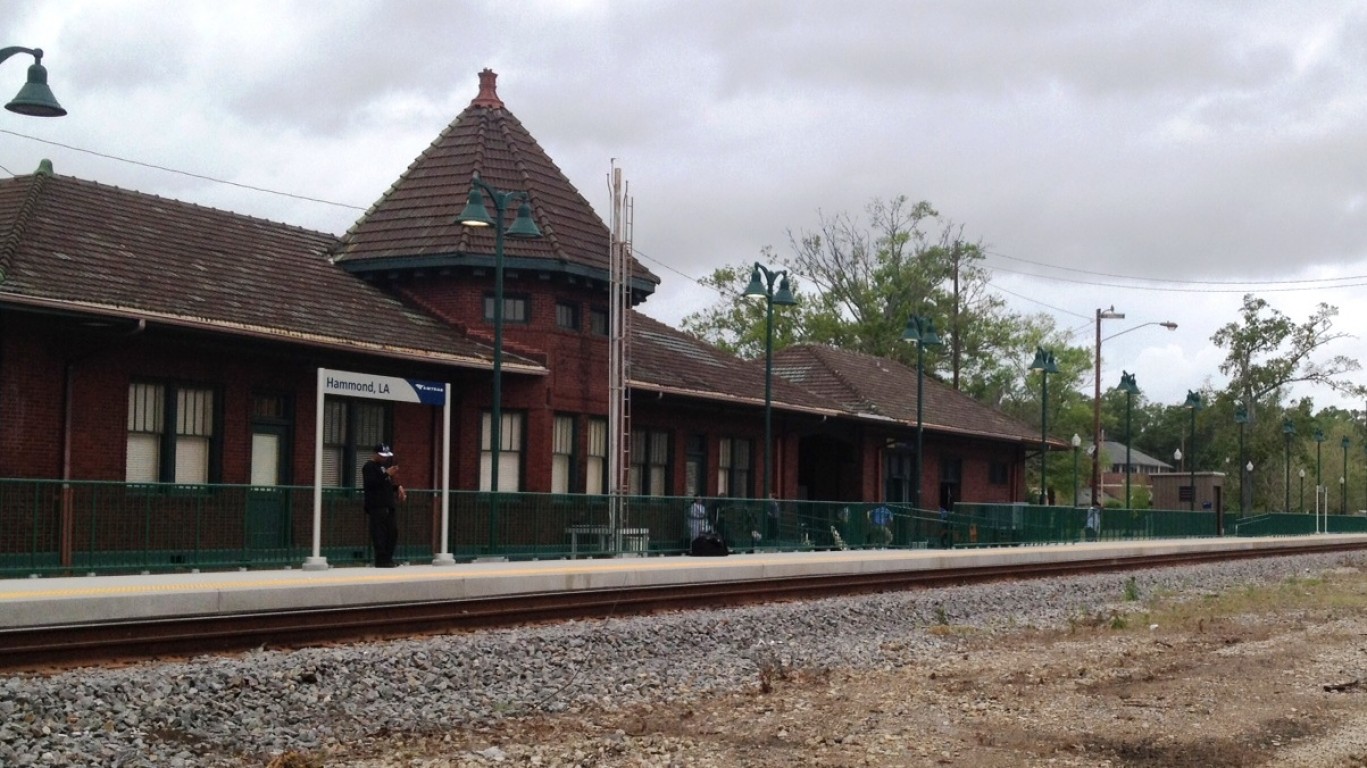
22. Hammond, Louisiana
> Adults who don’t exercise: 33.8% (US avg.: 22.2%)
> Pop. with access to places for physical activity: 71.1% (US avg.: 83.9%)
> Adult obesity rate: 38.5% (US avg.: 28.5%)
> Pop. over 20 with diabetes: 9.8% (US avg.: 8.5%)
> Adults in poor or fair health: 19.7% (US avg.: 16.0%)
> Median household income: $48,205 (US median: $61,937)
[in-text-ad-2]

21. Morristown, Tennessee
> Adults who don’t exercise: 31.6% (US avg.: 22.2%)
> Pop. with access to places for physical activity: 66.2% (US avg.: 83.9%)
> Adult obesity rate: 33.7% (US avg.: 28.5%)
> Pop. over 20 with diabetes: 16.0% (US avg.: 8.5%)
> Adults in poor or fair health: 20.5% (US avg.: 16.0%)
> Median household income: $47,439 (US median: $61,937)
20. Jacksonville, North Carolina
> Adults who don’t exercise: 24.7% (US avg.: 22.2%)
> Pop. with access to places for physical activity: 51.0% (US avg.: 83.9%)
> Adult obesity rate: 27.9% (US avg.: 28.5%)
> Pop. over 20 with diabetes: 11.0% (US avg.: 8.5%)
> Adults in poor or fair health: 16.6% (US avg.: 16.0%)
> Median household income: $50,639 (US median: $61,937)
[in-text-ad]

19. Beckley, West Virginia
> Adults who don’t exercise: 30.3% (US avg.: 22.2%)
> Pop. with access to places for physical activity: 61.9% (US avg.: 83.9%)
> Adult obesity rate: 39.3% (US avg.: 28.5%)
> Pop. over 20 with diabetes: 14.0% (US avg.: 8.5%)
> Adults in poor or fair health: 25.2% (US avg.: 16.0%)
> Median household income: $38,917 (US median: $61,937)
[recirclink id=544481]

18. Dover, Delaware
> Adults who don’t exercise: 29.5% (US avg.: 22.2%)
> Pop. with access to places for physical activity: 60.0% (US avg.: 83.9%)
> Adult obesity rate: 33.8% (US avg.: 28.5%)
> Pop. over 20 with diabetes: 11.6% (US avg.: 8.5%)
> Adults in poor or fair health: 16.9% (US avg.: 16.0%)
> Median household income: $54,419 (US median: $61,937)
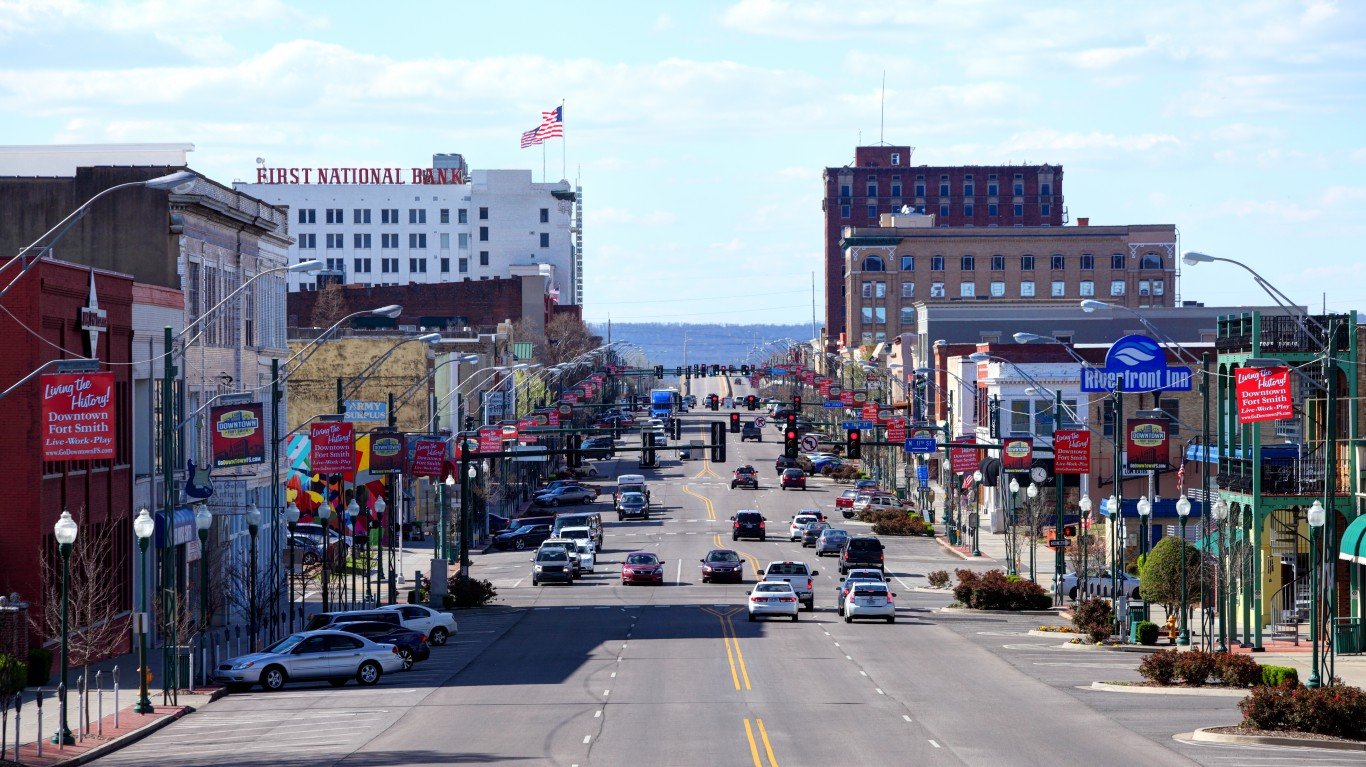
17. Fort Smith, Arkansas
> Adults who don’t exercise: 31.2% (US avg.: 22.2%)
> Pop. with access to places for physical activity: 63.8% (US avg.: 83.9%)
> Adult obesity rate: 34.0% (US avg.: 28.5%)
> Pop. over 20 with diabetes: 12.5% (US avg.: 8.5%)
> Adults in poor or fair health: 22.1% (US avg.: 16.0%)
> Median household income: $44,317 (US median: $61,937)
[in-text-ad-2]
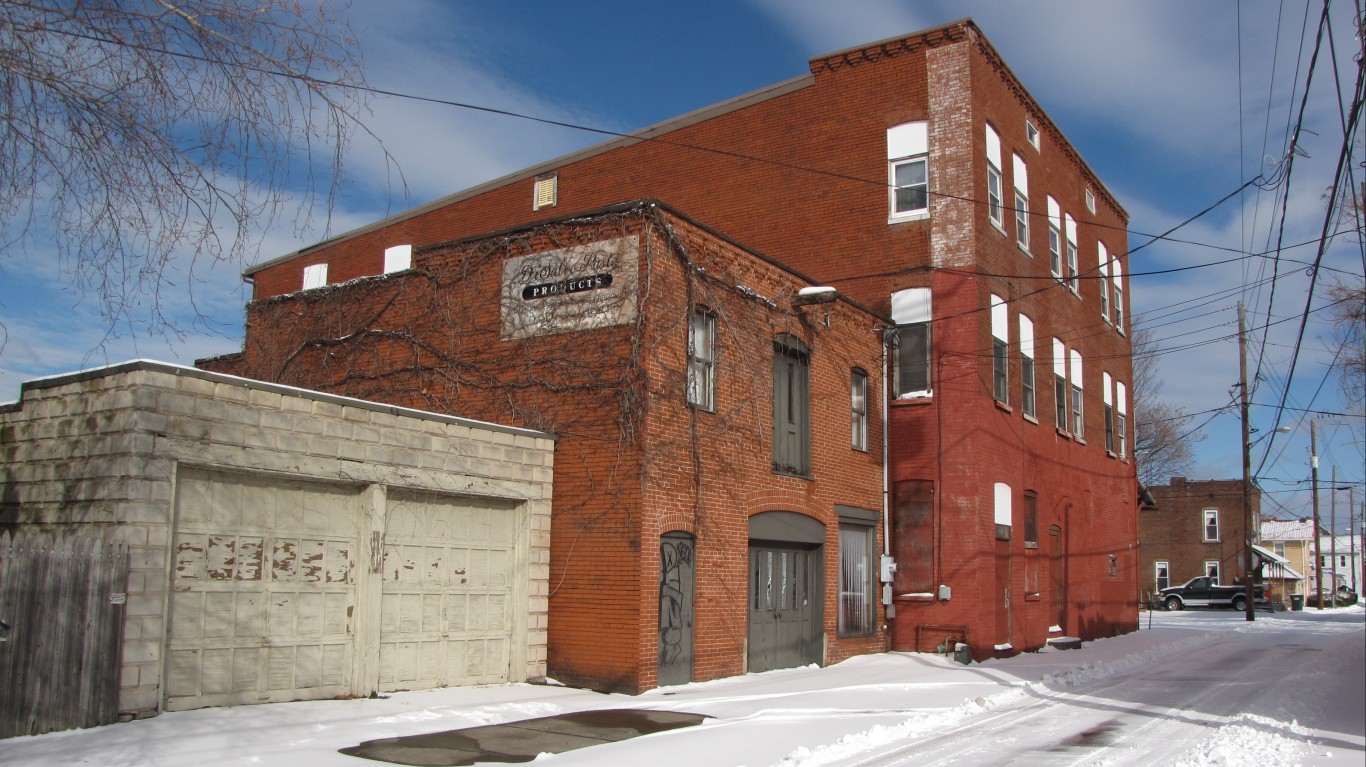
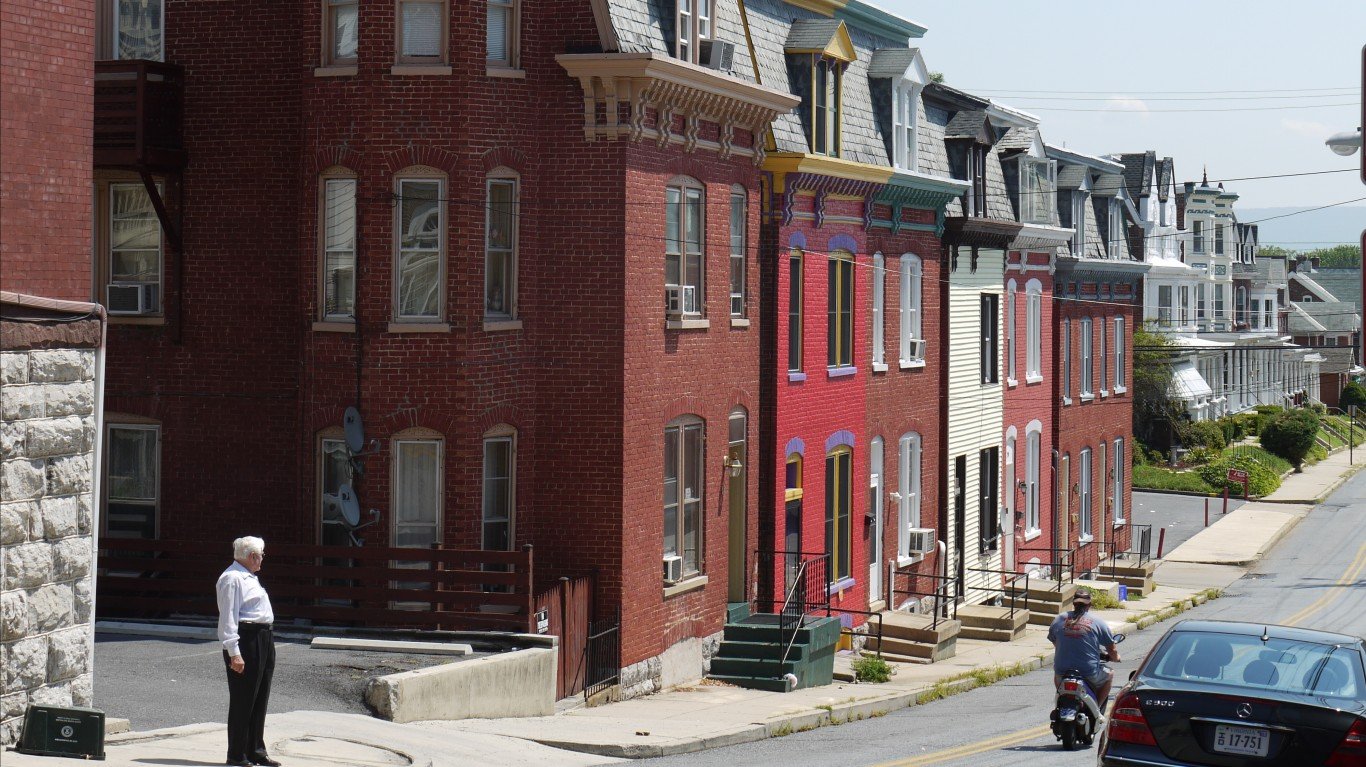
16. Williamsport, Pennsylvania
> Adults who don’t exercise: 26.8% (US avg.: 22.2%)
> Pop. with access to places for physical activity: 54.0% (US avg.: 83.9%)
> Adult obesity rate: 37.0% (US avg.: 28.5%)
> Pop. over 20 with diabetes: 9.9% (US avg.: 8.5%)
> Adults in poor or fair health: 15.6% (US avg.: 16.0%)
> Median household income: $55,045 (US median: $61,937)

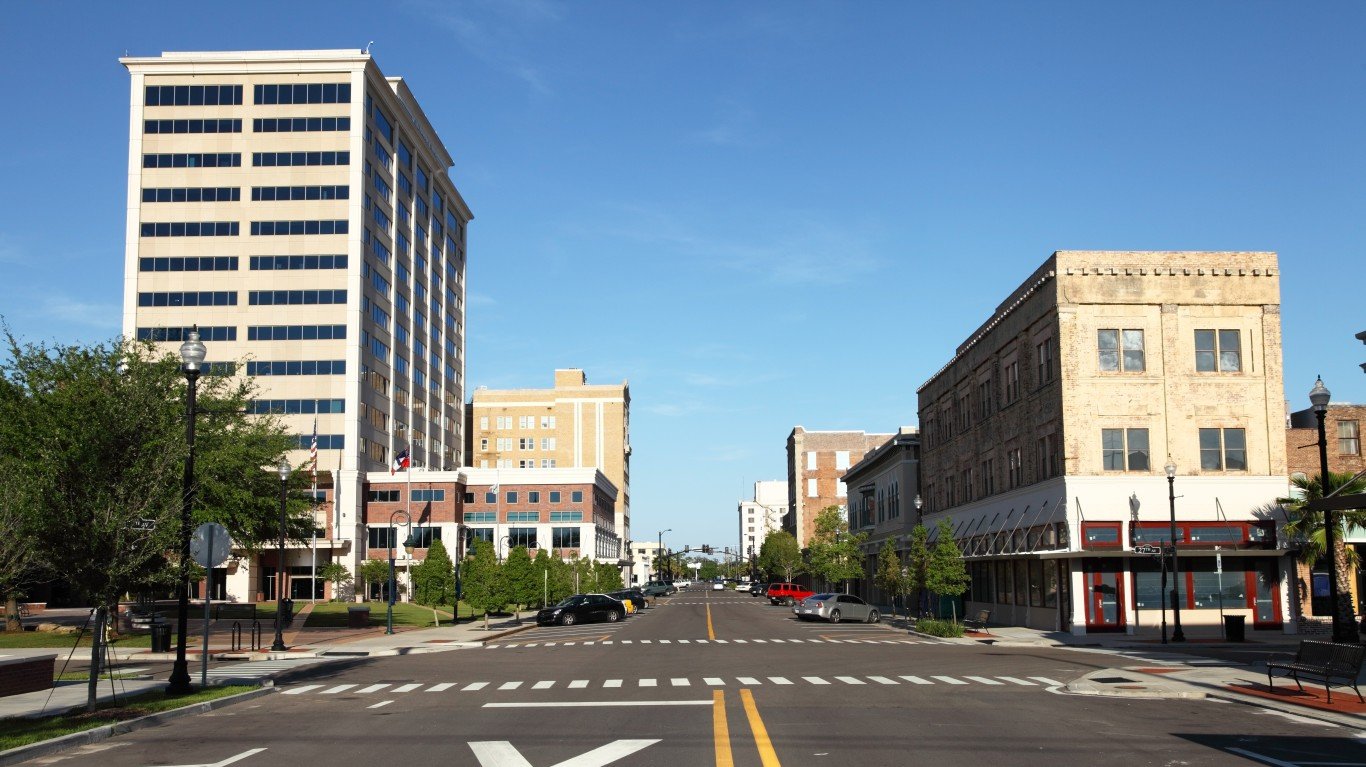
15. Beaumont-Port Arthur, Texas
> Adults who don’t exercise: 29.6% (US avg.: 22.2%)
> Pop. with access to places for physical activity: 59.9% (US avg.: 83.9%)
> Adult obesity rate: 33.7% (US avg.: 28.5%)
> Pop. over 20 with diabetes: 12.4% (US avg.: 8.5%)
> Adults in poor or fair health: 17.6% (US avg.: 16.0%)
> Median household income: $50,378 (US median: $61,937)
[in-text-ad]
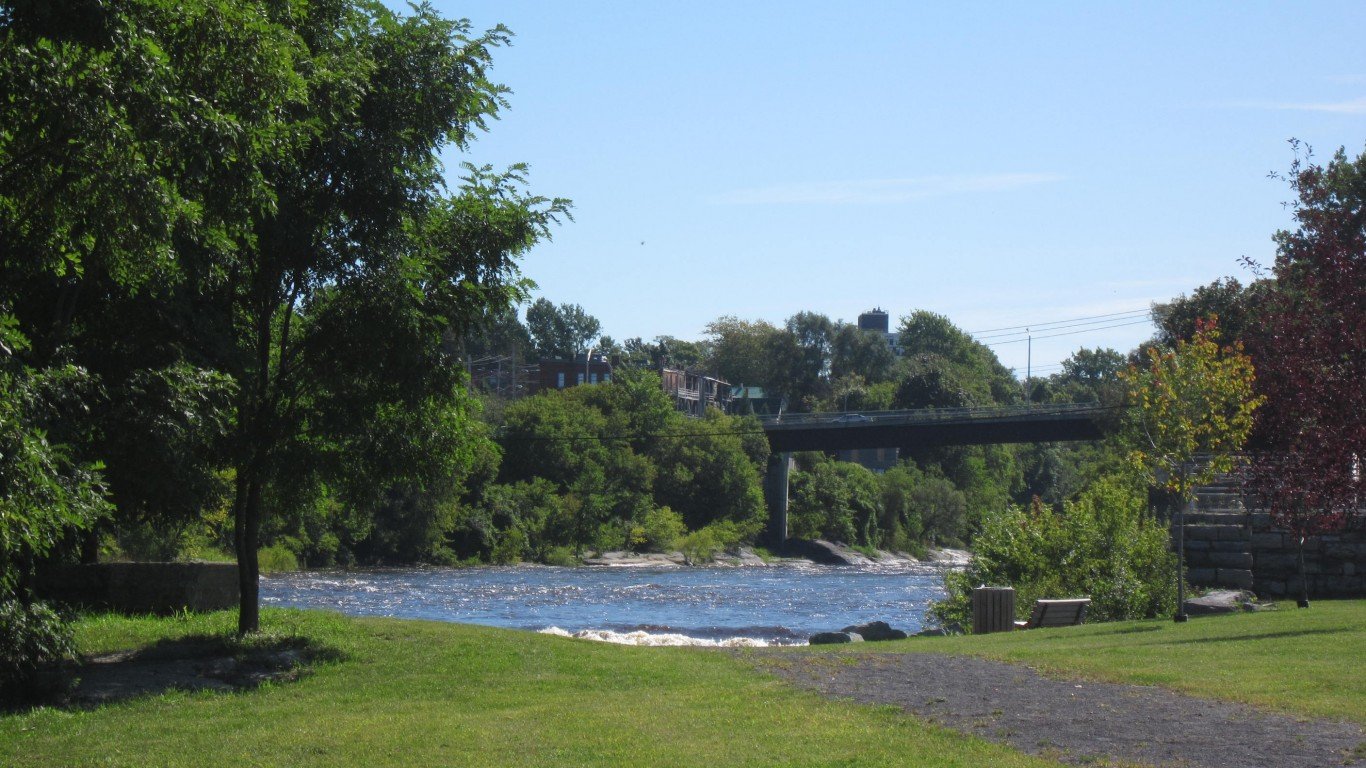
14. Watertown-Fort Drum, New York
> Adults who don’t exercise: 28.8% (US avg.: 22.2%)
> Pop. with access to places for physical activity: 58.1% (US avg.: 83.9%)
> Adult obesity rate: 32.5% (US avg.: 28.5%)
> Pop. over 20 with diabetes: 11.8% (US avg.: 8.5%)
> Adults in poor or fair health: 17.5% (US avg.: 16.0%)
> Median household income: $53,146 (US median: $61,937)
[recirclink id=637412]
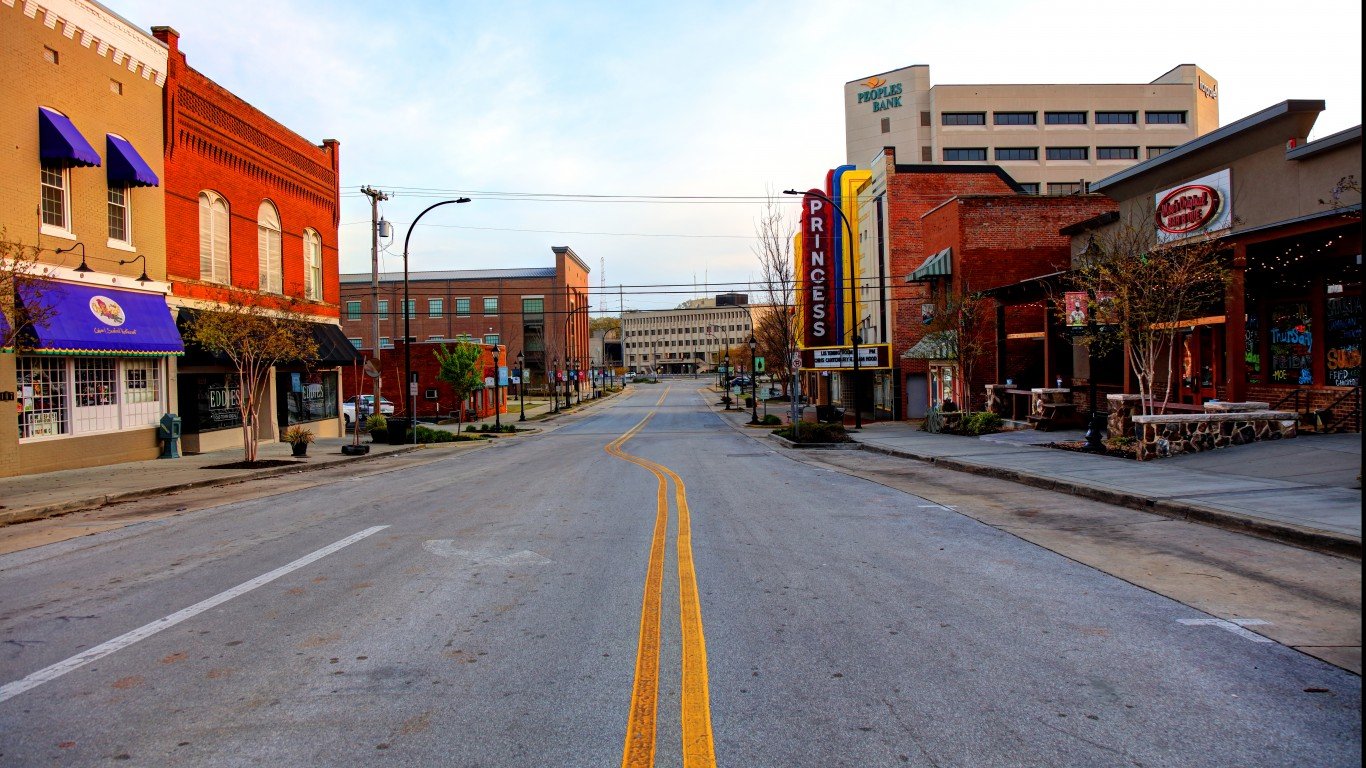
13. Florence, South Carolina
> Adults who don’t exercise: 29.8% (US avg.: 22.2%)
> Pop. with access to places for physical activity: 59.9% (US avg.: 83.9%)
> Adult obesity rate: 36.6% (US avg.: 28.5%)
> Pop. over 20 with diabetes: 13.9% (US avg.: 8.5%)
> Adults in poor or fair health: 21.6% (US avg.: 16.0%)
> Median household income: $42,612 (US median: $61,937)
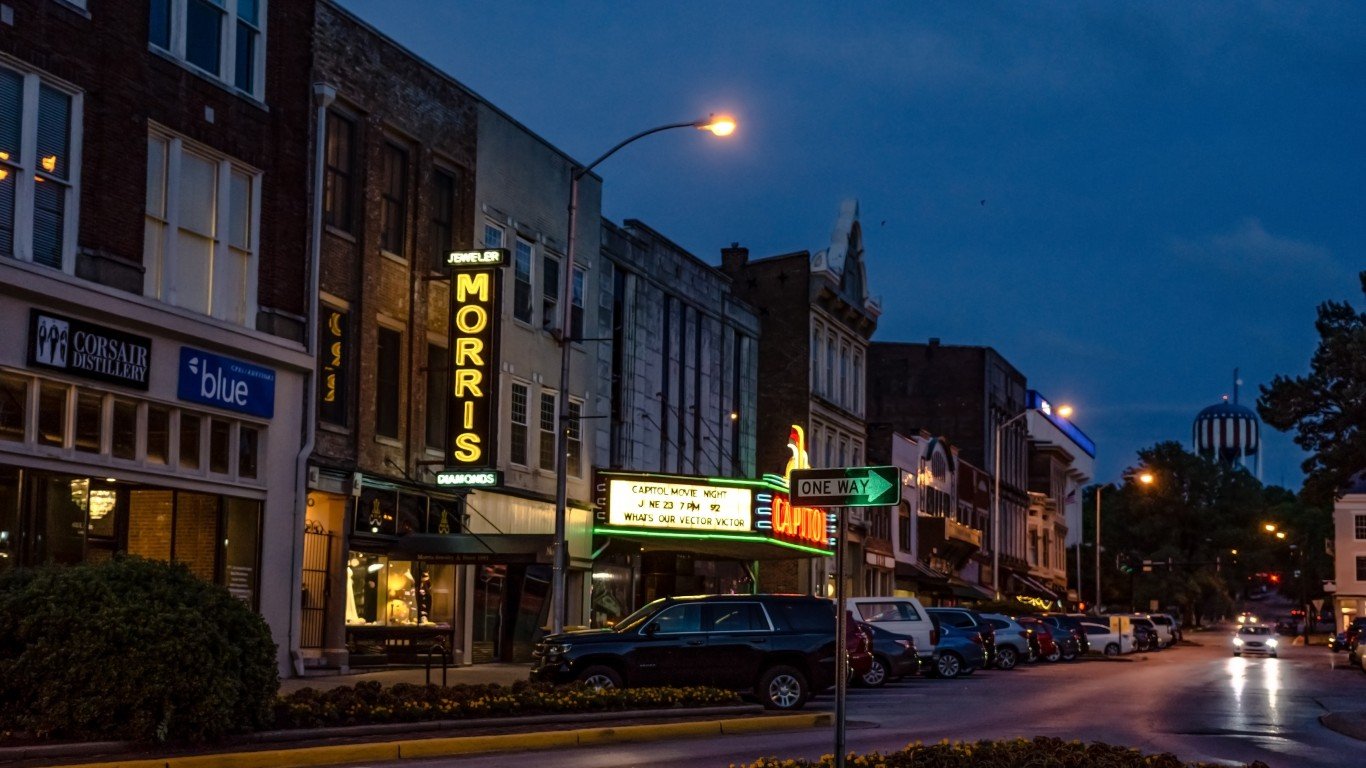
12. Bowling Green, Kentucky
> Adults who don’t exercise: 25.8% (US avg.: 22.2%)
> Pop. with access to places for physical activity: 51.0% (US avg.: 83.9%)
> Adult obesity rate: 32.1% (US avg.: 28.5%)
> Pop. over 20 with diabetes: 9.1% (US avg.: 8.5%)
> Adults in poor or fair health: 19.0% (US avg.: 16.0%)
> Median household income: $51,365 (US median: $61,937)
[in-text-ad-2]

11. Rocky Mount, North Carolina
> Adults who don’t exercise: 26.2% (US avg.: 22.2%)
> Pop. with access to places for physical activity: 51.7% (US avg.: 83.9%)
> Adult obesity rate: 36.7% (US avg.: 28.5%)
> Pop. over 20 with diabetes: 13.2% (US avg.: 8.5%)
> Adults in poor or fair health: 21.4% (US avg.: 16.0%)
> Median household income: $46,733 (US median: $61,937)
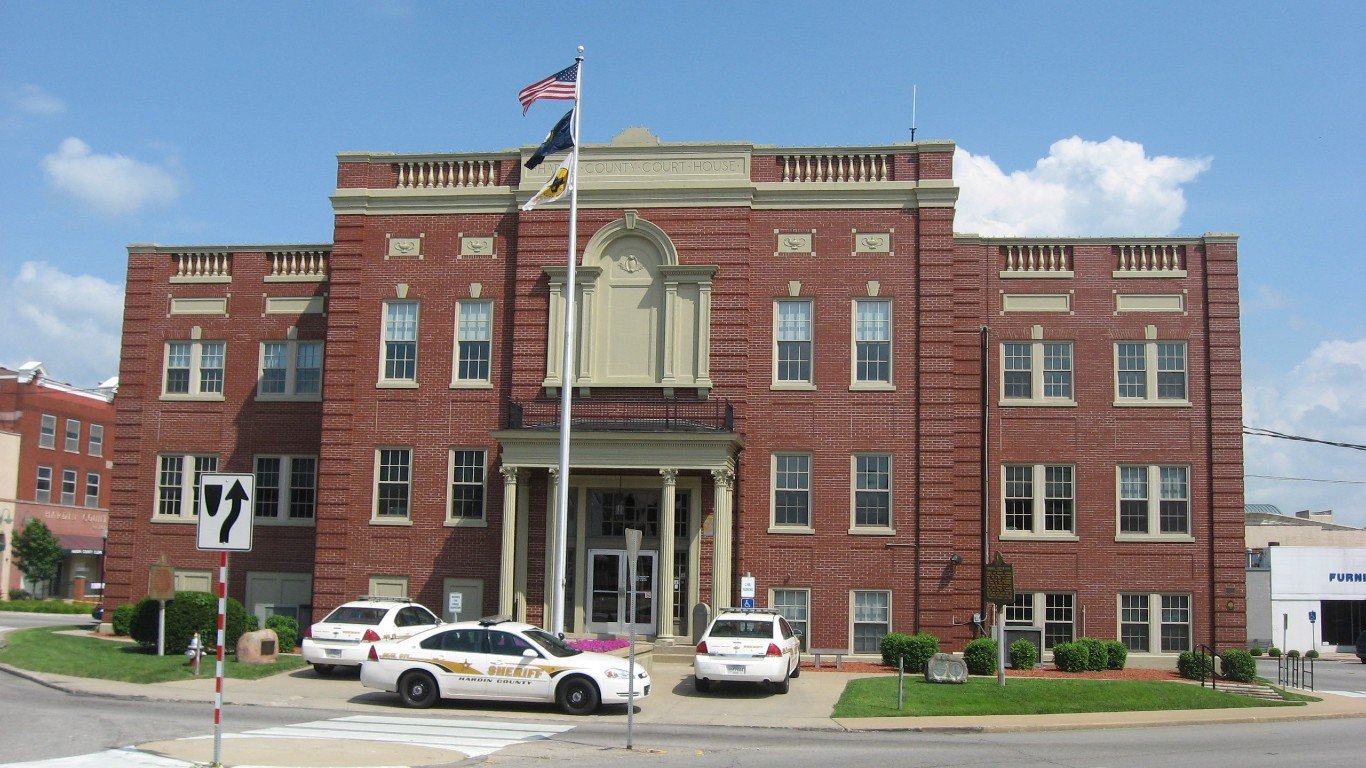
10. Elizabethtown-Fort Knox, Kentucky
> Adults who don’t exercise: 27.2% (US avg.: 22.2%)
> Pop. with access to places for physical activity: 53.9% (US avg.: 83.9%)
> Adult obesity rate: 35.8% (US avg.: 28.5%)
> Pop. over 20 with diabetes: 12.0% (US avg.: 8.5%)
> Adults in poor or fair health: 19.5% (US avg.: 16.0%)
> Median household income: $51,147 (US median: $61,937)
[in-text-ad]
9. Decatur, Alabama
> Adults who don’t exercise: 28.9% (US avg.: 22.2%)
> Pop. with access to places for physical activity: 55.4% (US avg.: 83.9%)
> Adult obesity rate: 32.3% (US avg.: 28.5%)
> Pop. over 20 with diabetes: 12.4% (US avg.: 8.5%)
> Adults in poor or fair health: 20.7% (US avg.: 16.0%)
> Median household income: $49,133 (US median: $61,937)
[recirclink id=526773]
8. Florence-Muscle Shoals, Alabama
> Adults who don’t exercise: 30.0% (US avg.: 22.2%)
> Pop. with access to places for physical activity: 57.5% (US avg.: 83.9%)
> Adult obesity rate: 33.8% (US avg.: 28.5%)
> Pop. over 20 with diabetes: 12.5% (US avg.: 8.5%)
> Adults in poor or fair health: 19.7% (US avg.: 16.0%)
> Median household income: $49,407 (US median: $61,937)
7. Goldsboro, North Carolina
> Adults who don’t exercise: 28.2% (US avg.: 22.2%)
> Pop. with access to places for physical activity: 47.5% (US avg.: 83.9%)
> Adult obesity rate: 34.6% (US avg.: 28.5%)
> Pop. over 20 with diabetes: 15.3% (US avg.: 8.5%)
> Adults in poor or fair health: 21.0% (US avg.: 16.0%)
> Median household income: $40,791 (US median: $61,937)
[in-text-ad-2]

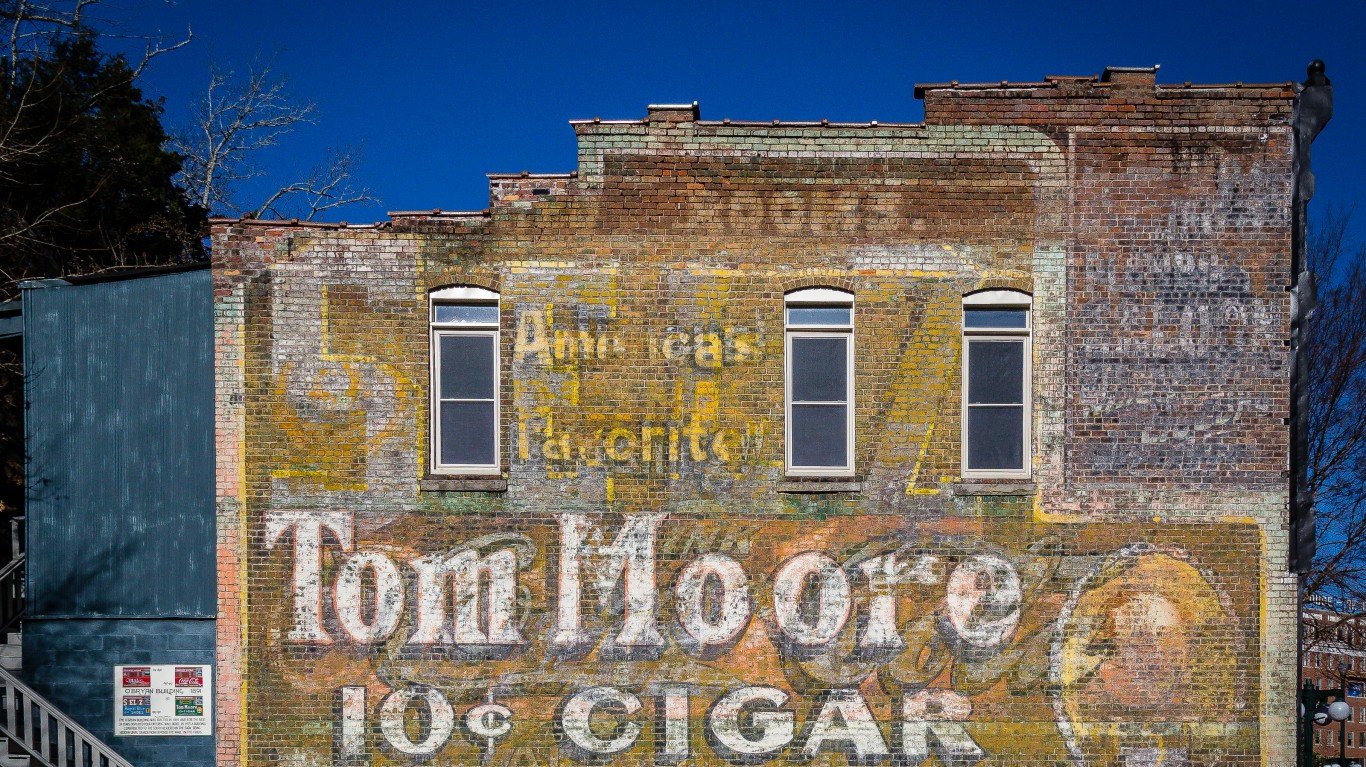
6. Jonesboro, Arkansas
> Adults who don’t exercise: 33.4% (US avg.: 22.2%)
> Pop. with access to places for physical activity: 58.1% (US avg.: 83.9%)
> Adult obesity rate: 36.6% (US avg.: 28.5%)
> Pop. over 20 with diabetes: 14.6% (US avg.: 8.5%)
> Adults in poor or fair health: 21.6% (US avg.: 16.0%)
> Median household income: $43,927 (US median: $61,937)

5. Dothan, Alabama
> Adults who don’t exercise: 29.9% (US avg.: 22.2%)
> Pop. with access to places for physical activity: 47.0% (US avg.: 83.9%)
> Adult obesity rate: 36.6% (US avg.: 28.5%)
> Pop. over 20 with diabetes: 12.5% (US avg.: 8.5%)
> Adults in poor or fair health: 23.5% (US avg.: 16.0%)
> Median household income: $45,152 (US median: $61,937)
[in-text-ad]
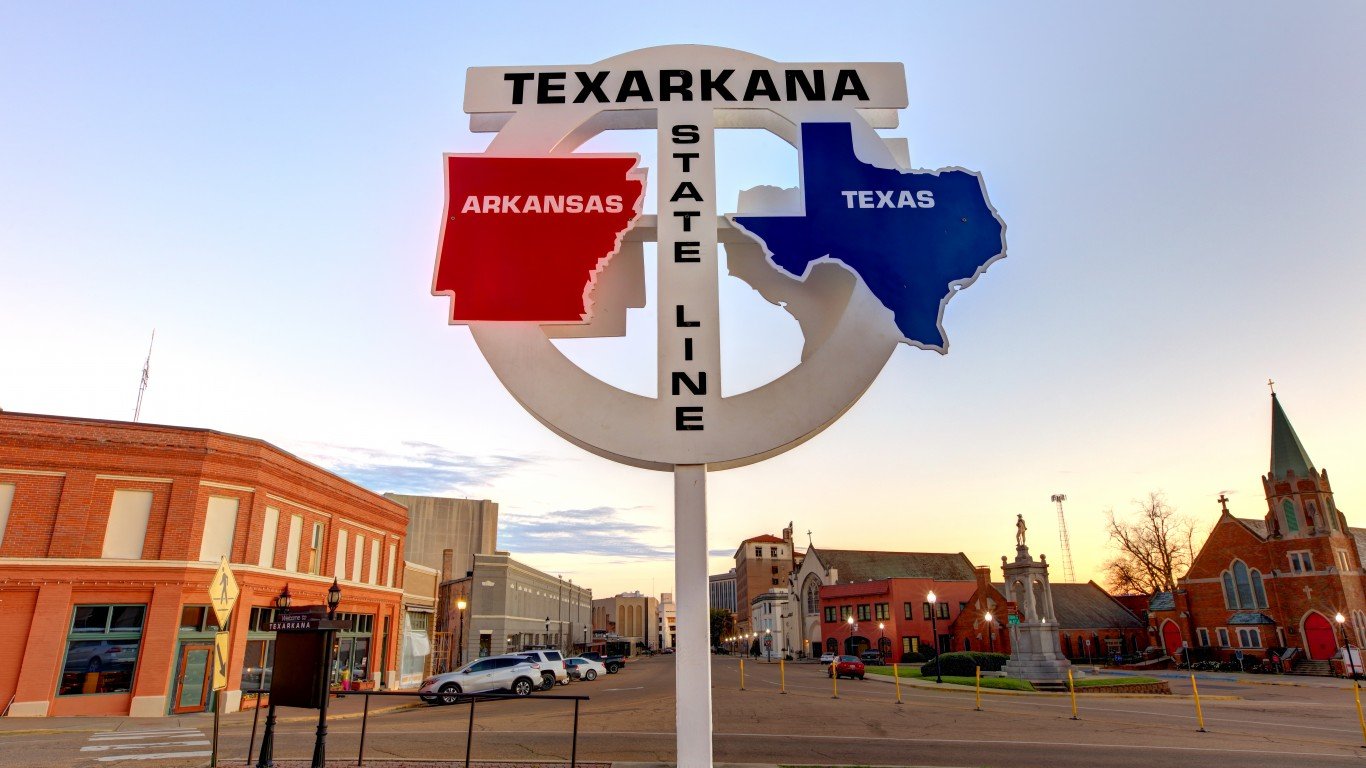
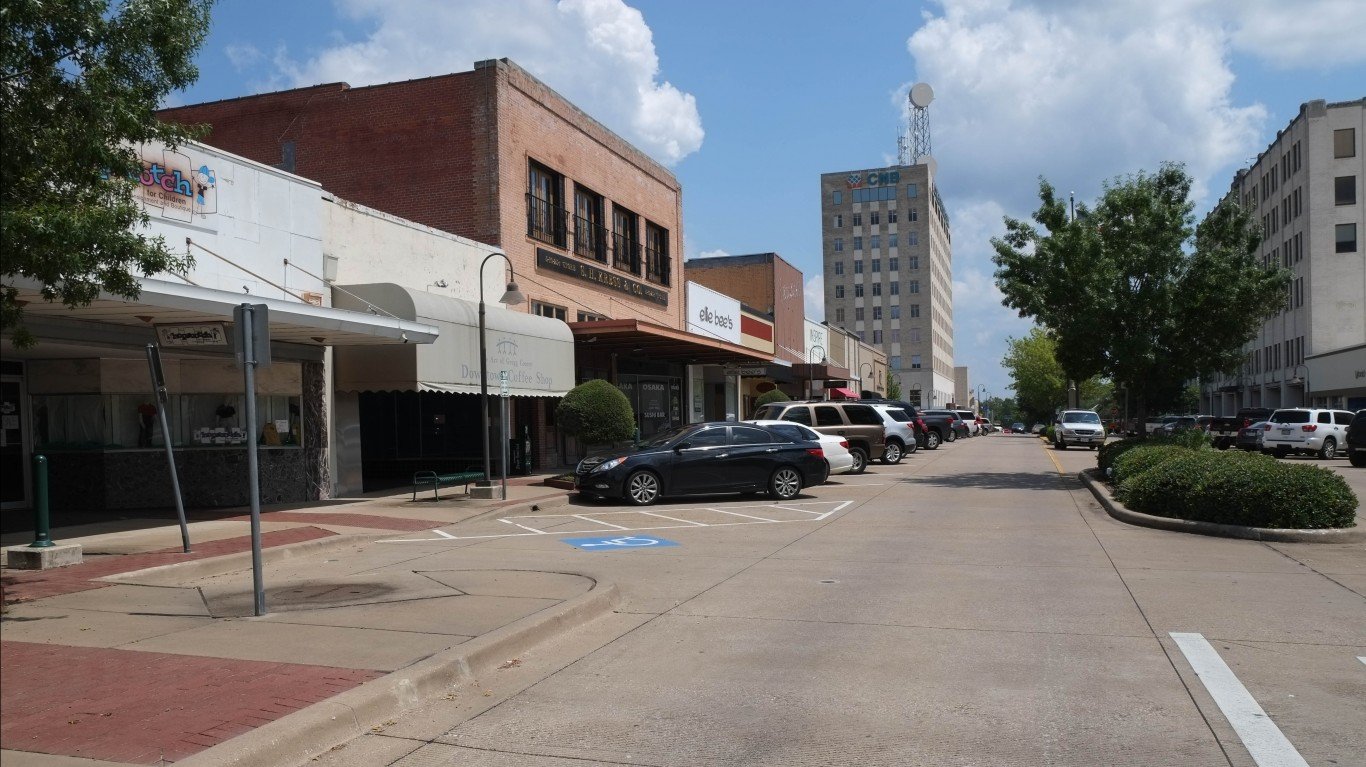
4. Texarkana, Texas
> Adults who don’t exercise: 33.0% (US avg.: 22.2%)
> Pop. with access to places for physical activity: 51.9% (US avg.: 83.9%)
> Adult obesity rate: 37.4% (US avg.: 28.5%)
> Pop. over 20 with diabetes: 13.1% (US avg.: 8.5%)
> Adults in poor or fair health: 20.0% (US avg.: 16.0%)
> Median household income: $45,212 (US median: $61,937)
[recirclink id=567425]
3. Anniston-Oxford-Jacksonville, Alabama
> Adults who don’t exercise: 30.2% (US avg.: 22.2%)
> Pop. with access to places for physical activity: 44.7% (US avg.: 83.9%)
> Adult obesity rate: 37.1% (US avg.: 28.5%)
> Pop. over 20 with diabetes: 15.6% (US avg.: 8.5%)
> Adults in poor or fair health: 19.6% (US avg.: 16.0%)
> Median household income: $45,818 (US median: $61,937)
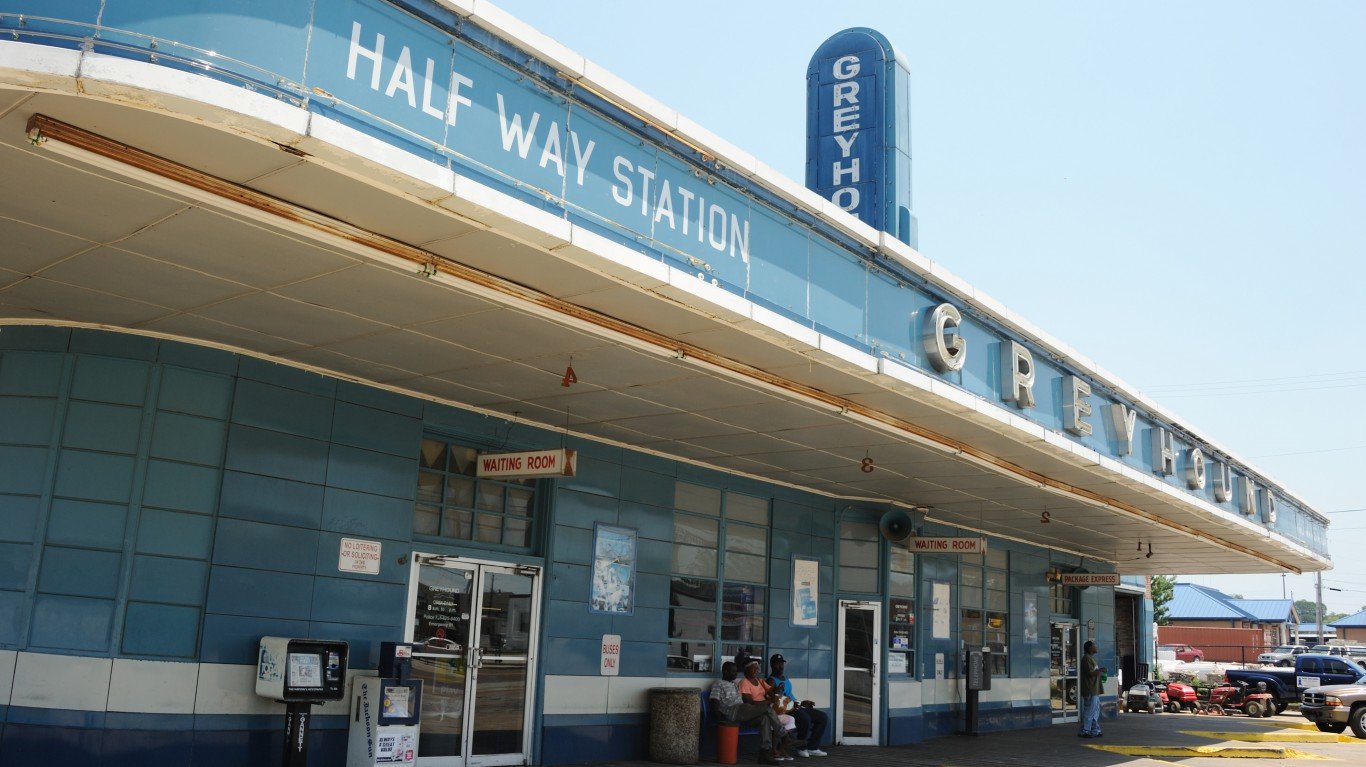
2. Pine Bluff, Arkansas
> Adults who don’t exercise: 33.9% (US avg.: 22.2%)
> Pop. with access to places for physical activity: 47.2% (US avg.: 83.9%)
> Adult obesity rate: 40.1% (US avg.: 28.5%)
> Pop. over 20 with diabetes: 14.2% (US avg.: 8.5%)
> Adults in poor or fair health: 25.7% (US avg.: 16.0%)
> Median household income: $37,314 (US median: $61,937)
[in-text-ad-2]
1. Gadsden, Alabama
> Adults who don’t exercise: 33.4% (US avg.: 22.2%)
> Pop. with access to places for physical activity: 45.2% (US avg.: 83.9%)
> Adult obesity rate: 36.1% (US avg.: 28.5%)
> Pop. over 20 with diabetes: 13.5% (US avg.: 8.5%)
> Adults in poor or fair health: 23.0% (US avg.: 16.0%)
> Median household income: $45,868 (US median: $61,937)
Methodology:
To determine the cities getting the least exercise, 24/7 Tempo created an index consisting of the share of adults who are physically active and the percentage of the population with access to places for physical activity in all 381 metro areas in the United States. Both measures came from the 2019 County Health Rankings & Roadmaps (CHR), a collaboration between the Robert Wood Johnson Foundation and the University of Wisconsin Population Health Institute.
Obesity rates — the share of adult residents who report a body mass index of 30 or greater — as well as the share of adults who have access to exercise facilities and the share of the population reporting to be in fair or poor health, also came from CHR 2019. All CHR data is for the most recent year available. The age-adjusted percentage of the total population 20 years and over diagnosed with diabetes in 2016 came from the United States Diabetes Surveillance System, provided by the CDC.
Diabetes age-adjusted rates were provided at the county level, which were then aggregated to the metropolitan level using a weighted average, based on the percentage of the 2016 5-year population of each county within each metro area. 2018 population figures, as well as median household income, and poverty rate came from the American Community Survey 2018 5-Year Estimates.
The number of fitness and recreational sports facilities that feature exercise and other active physical fitness conditioning per 100,000 people came from the Census’ County 2017 Business Patterns.
Contact [email protected] for any questions or corrections.