
The United States recorded a historic surge in homicides in 2020. According to the FBI, there were 21,570 murders nationwide in 2020, a 29% increase from 2019 – the largest single-year increase ever reported in the United States.
Though the precise reasons for the surge have yet to be determined, experts speculate that unrest following the murder of George Floyd, along with social and economic upheaval wrought by the COVID-19 pandemic, likely played a role. Gun sales also surged in 2020, and firearms were used in 77% of murder cases, up from 73% in 2019. Here is a look at the states where gun sales are surging.
Whatever the explanation, murder is now at its highest level in the U.S. since the mid-1990s – and some cities are bearing the brunt of rising levels of deadly violence.
Using data from the FBI, 24/7 Wall St. identified the 50 cities where the murder rate is rising fastest. Cities, defined as having populations greater than 25,000, are ranked by the year-over-year change in the number of murders per 100,000 people. In every city on this list, the increase the murder rate was at least seven times the national uptick of 1.5 homicides per 100,000 in 2020.
The largest share of cities that reported the largest increases in homicide are in the South. Every city on this list has a higher overall homicide rate than the national rate of 6.5 murders per 100,000 people – though 20 of them had a lower than average murder rate in 2019, including several in which no murders were reported that year.
Murder – along with rаpe, robbery, and aggravated assault – is one component of the overall violent crime category. Even though murder accounts for a small percentage of all violent crimes, most cities on this list also reported an increase in the overall violent crime rate in 2020. Here is a look at the states where crime is soaring.
Click here to see the cities where murder rate is soaring
Click here to read our detailed methodology

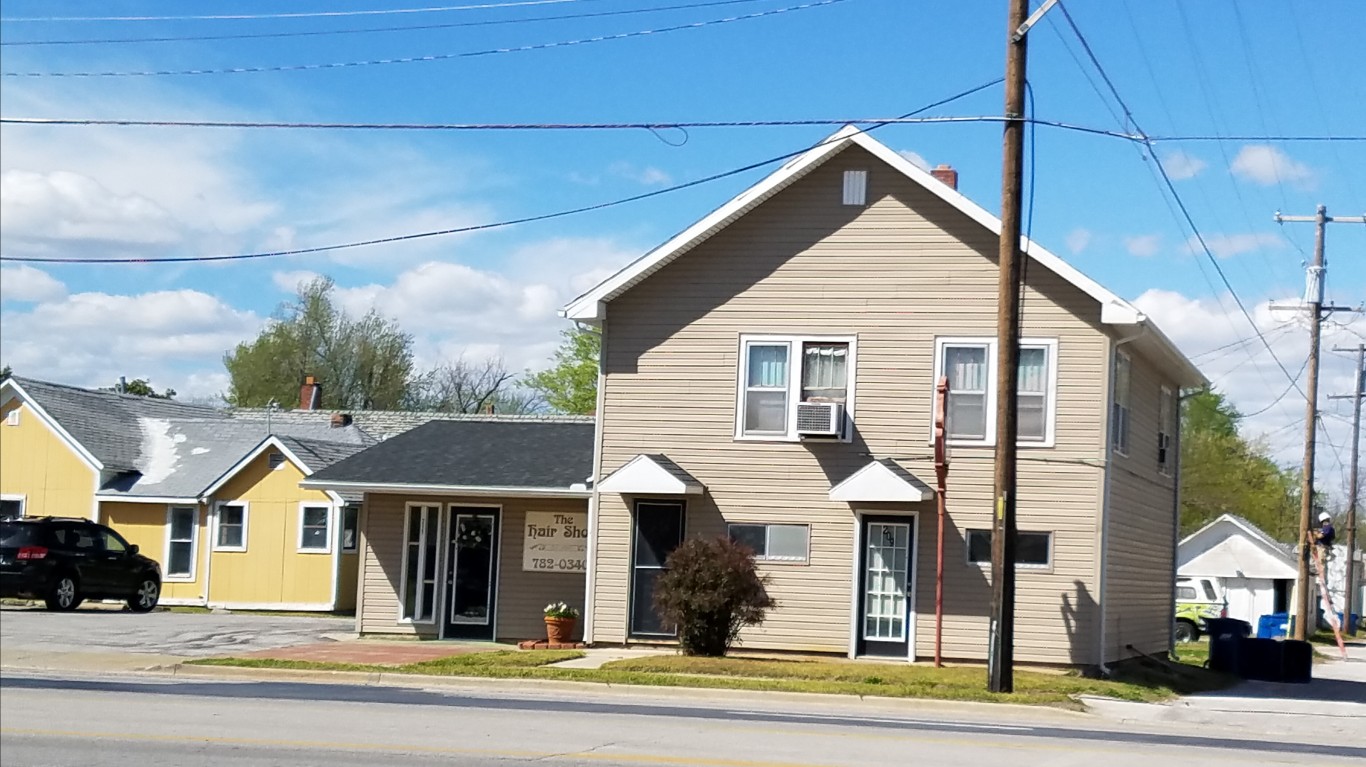
50. Marshalltown, Iowa
> 1-yr. change in reported homicides per 100K people: +11.3
> Homicides reported in 2020: 3 — 381st highest of 1,122 cities (tied)
> Homicides per 100K people in 2020: 11.3 — 171st highest of 1,122 cities
> 1-yr. change in all violent crime per 100K people: +93.0 — 129th highest of 1,119 cities
> Violent crimes per 100K people in 2020: 481.9 — 307th highest of 1,120 cities
> Population: 27,053
[in-text-ad]

49. Rapid City, South Dakota
> 1-yr. change in reported homicides per 100K people: +11.3
> Homicides reported in 2020: 13 — 137th highest of 1,122 cities (tied)
> Homicides per 100K people in 2020: 16.6 — 92nd highest of 1,122 cities
> 1-yr. change in all violent crime per 100K people: +150.1 — 61st highest of 1,119 cities
> Violent crimes per 100K people in 2020: 857.4 — 95th highest of 1,120 cities
> Population: 75,258
[recirclink id=1038777]

48. Victorville, California
> 1-yr. change in reported homicides per 100K people: +11.4
> Homicides reported in 2020: 19 — 95th highest of 1,122 cities (tied)
> Homicides per 100K people in 2020: 15.4 — 105th highest of 1,122 cities
> 1-yr. change in all violent crime per 100K people: +78.0 — 162nd highest of 1,119 cities
> Violent crimes per 100K people in 2020: 880.7 — 87th highest of 1,120 cities
> Population: 121,902

47. Canton, Ohio
> 1-yr. change in reported homicides per 100K people: +11.4
> Homicides reported in 2020: 14 — 127th highest of 1,122 cities (tied)
> Homicides per 100K people in 2020: 20.0 — 59th highest of 1,122 cities
> 1-yr. change in all violent crime per 100K people: +30.2 — 370th highest of 1,119 cities
> Violent crimes per 100K people in 2020: 1,428.9 — 20th highest of 1,120 cities
> Population: 71,243
[in-text-ad-2]

46. South Salt Lake, Utah
> 1-yr. change in reported homicides per 100K people: +11.6
> Homicides reported in 2020: 4 — 310th highest of 1,122 cities (tied)
> Homicides per 100K people in 2020: 15.5 — 104th highest of 1,122 cities
> 1-yr. change in all violent crime per 100K people: +163.7 — 52nd highest of 1,119 cities
> Violent crimes per 100K people in 2020: 964.5 — 65th highest of 1,120 cities
> Population: 25,017
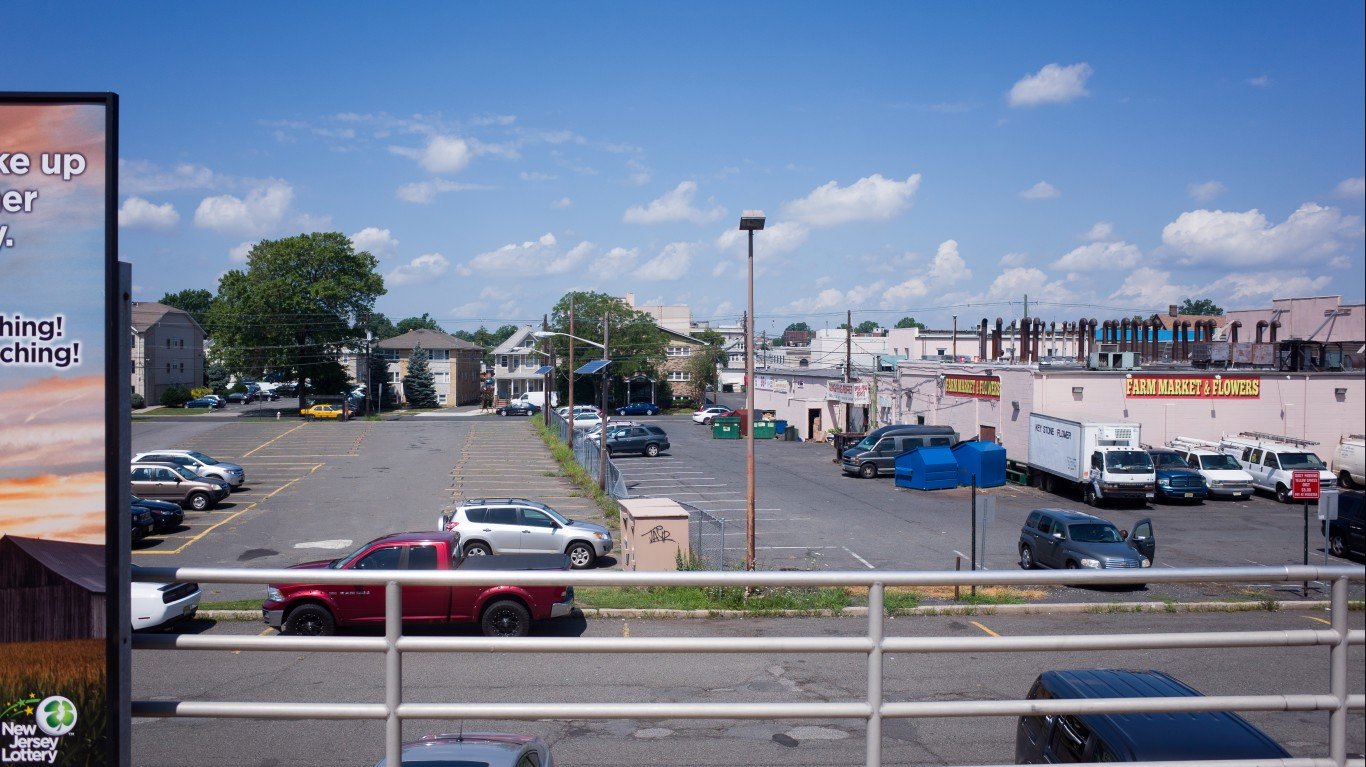
45. Linden, New Jersey
> 1-yr. change in reported homicides per 100K people: +11.8
> Homicides reported in 2020: 5 — 272nd highest of 1,122 cities (tied)
> Homicides per 100K people in 2020: 11.8 — 165th highest of 1,122 cities
> 1-yr. change in all violent crime per 100K people: -39.3 — 194th lowest of 1,119 cities
> Violent crimes per 100K people in 2020: 334.0 — 495th highest of 1,120 cities
> Population: 42,222
[in-text-ad]
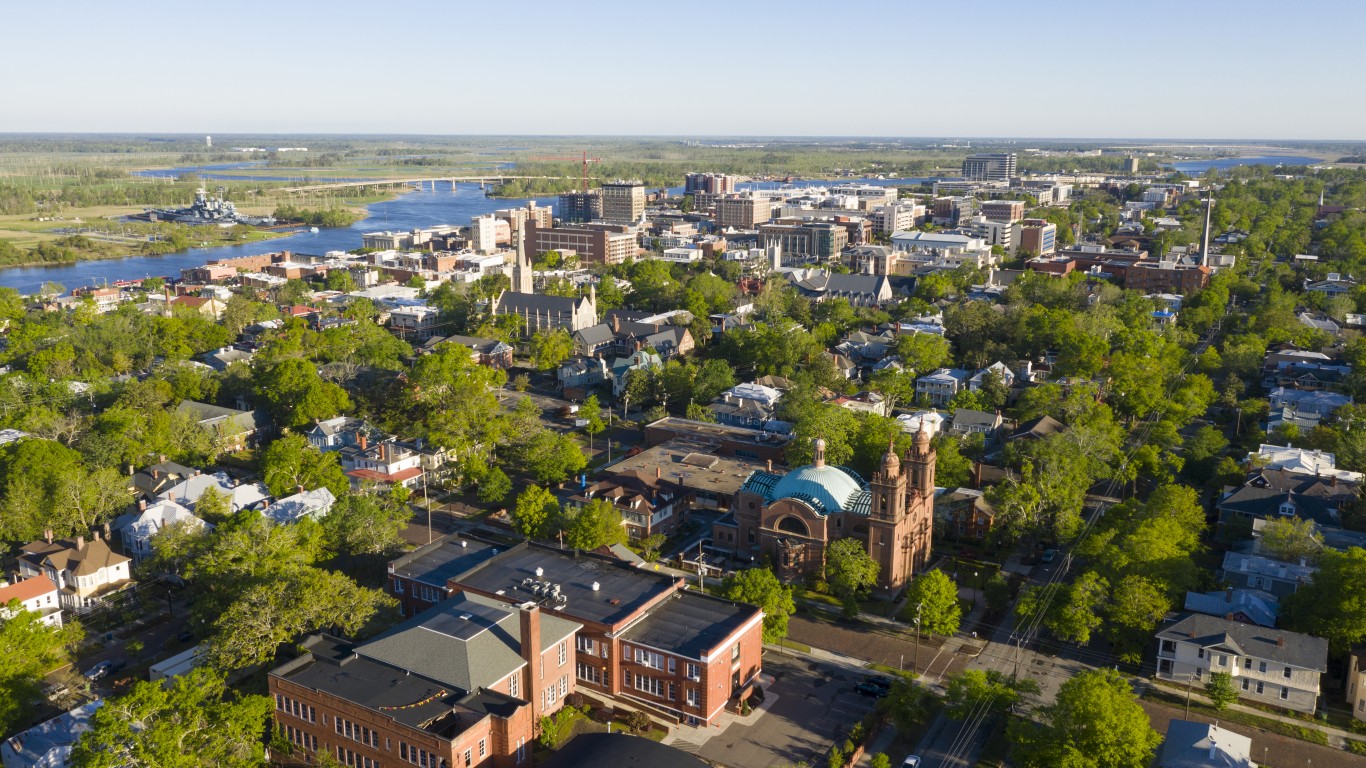
44. Wilmington, North Carolina
> 1-yr. change in reported homicides per 100K people: +11.9
> Homicides reported in 2020: 22 — 89th highest of 1,122 cities
> Homicides per 100K people in 2020: 17.5 — 84th highest of 1,122 cities
> 1-yr. change in all violent crime per 100K people: +20.4 — 437th highest of 1,119 cities
> Violent crimes per 100K people in 2020: 628.8 — 186th highest of 1,120 cities
> Population: 120,194
[recirclink id=1016354]

43. Waterloo, Iowa
> 1-yr. change in reported homicides per 100K people: +11.9
> Homicides reported in 2020: 9 — 172nd highest of 1,122 cities (tied)
> Homicides per 100K people in 2020: 13.4 — 139th highest of 1,122 cities
> 1-yr. change in all violent crime per 100K people: +171.7 — 45th highest of 1,119 cities
> Violent crimes per 100K people in 2020: 623.5 — 194th highest of 1,120 cities
> Population: 67,912

42. Copperas Cove, Texas
> 1-yr. change in reported homicides per 100K people: +12.0
> Homicides reported in 2020: 4 — 310th highest of 1,122 cities (tied)
> Homicides per 100K people in 2020: 12.0 — 163rd highest of 1,122 cities
> 1-yr. change in all violent crime per 100K people: +37.4 — 316th highest of 1,119 cities
> Violent crimes per 100K people in 2020: 432.0 — 369th highest of 1,120 cities
> Population: 32,715
[in-text-ad-2]
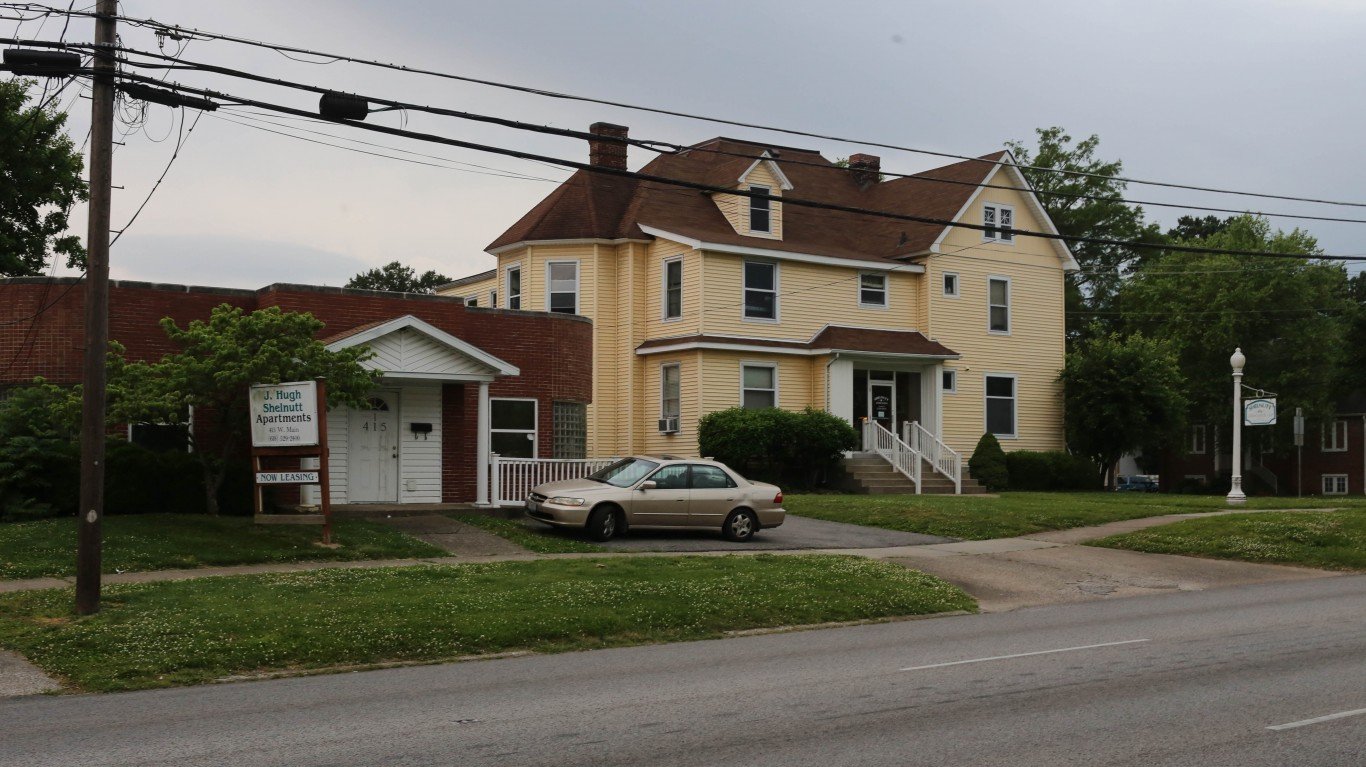
41. Carbondale, Illinois
> 1-yr. change in reported homicides per 100K people: +12.1
> Homicides reported in 2020: 4 — 310th highest of 1,122 cities (tied)
> Homicides per 100K people in 2020: 16.0 — 98th highest of 1,122 cities
> 1-yr. change in all violent crime per 100K people: N/A
> Violent crimes per 100K people in 2020: N/A
> Population: 25,597

40. North Little Rock, Arkansas
> 1-yr. change in reported homicides per 100K people: +12.1
> Homicides reported in 2020: 20 — 92nd highest of 1,122 cities (tied)
> Homicides per 100K people in 2020: 30.2 — 27th highest of 1,122 cities
> 1-yr. change in all violent crime per 100K people: +159.2 — 57th highest of 1,119 cities
> Violent crimes per 100K people in 2020: 1,003.0 — 56th highest of 1,120 cities
> Population: 66,075
[in-text-ad]

39. Mount Pleasant, Michigan
> 1-yr. change in reported homicides per 100K people: +12.2
> Homicides reported in 2020: 3 — 381st highest of 1,122 cities (tied)
> Homicides per 100K people in 2020: 12.2 — 159th highest of 1,122 cities
> 1-yr. change in all violent crime per 100K people: -3.1 — 446th lowest of 1,119 cities
> Violent crimes per 100K people in 2020: 186.5 — 361st lowest of 1,120 cities
> Population: 25,629
[recirclink id=1011842]

38. Troy, New York
> 1-yr. change in reported homicides per 100K people: +12.3
> Homicides reported in 2020: 9 — 172nd highest of 1,122 cities (tied)
> Homicides per 100K people in 2020: 18.3 — 73rd highest of 1,122 cities
> 1-yr. change in all violent crime per 100K people: +72.2 — 181st highest of 1,119 cities
> Violent crimes per 100K people in 2020: 672.8 — 169th highest of 1,120 cities
> Population: 49,458

37. Vallejo, California
> 1-yr. change in reported homicides per 100K people: +12.3
> Homicides reported in 2020: 27 — 76th highest of 1,122 cities (tied)
> Homicides per 100K people in 2020: 22.1 — 47th highest of 1,122 cities
> 1-yr. change in all violent crime per 100K people: +145.3 — 66th highest of 1,119 cities
> Violent crimes per 100K people in 2020: 990.8 — 58th highest of 1,120 cities
> Population: 121,267
[in-text-ad-2]
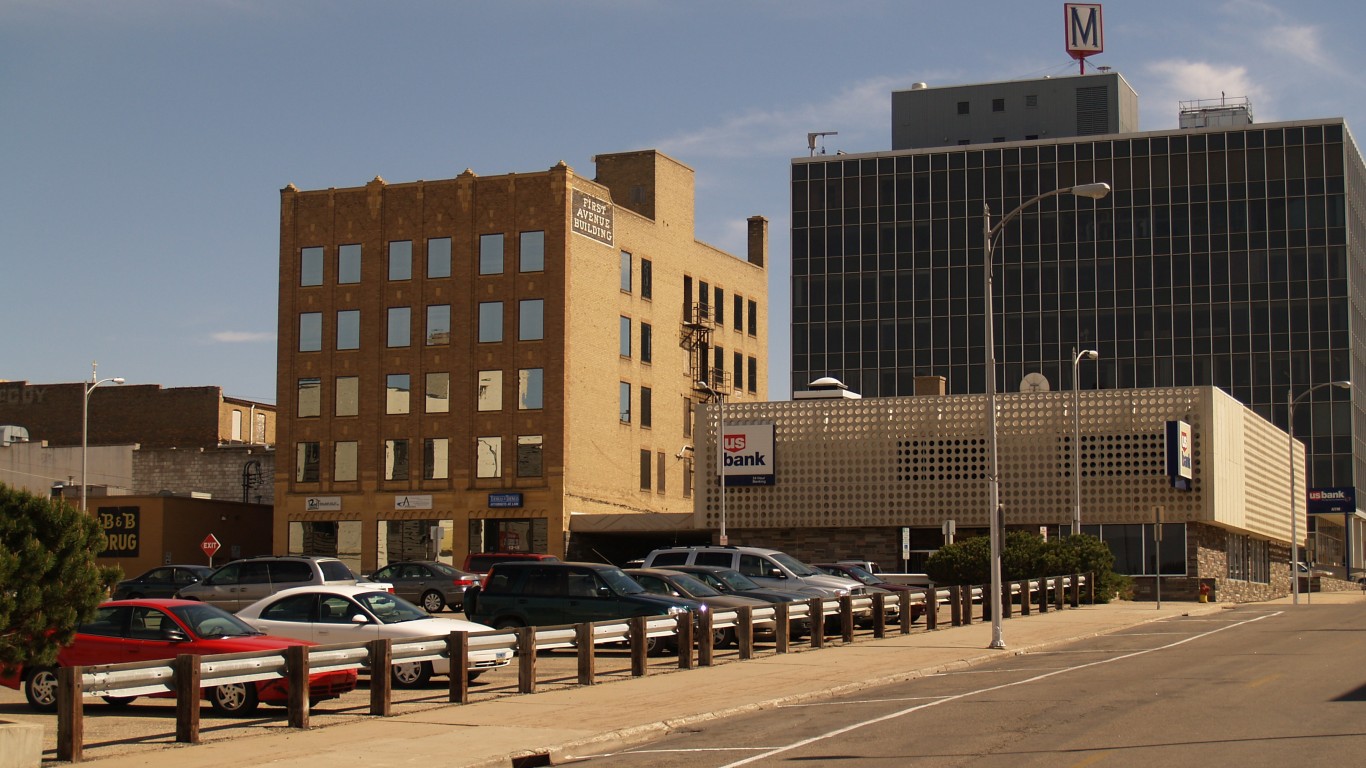
36. Minot, North Dakota
> 1-yr. change in reported homicides per 100K people: +12.5
> Homicides reported in 2020: 7 — 209th highest of 1,122 cities (tied)
> Homicides per 100K people in 2020: 14.6 — 115th highest of 1,122 cities
> 1-yr. change in all violent crime per 100K people: +52.4 — 252nd highest of 1,119 cities
> Violent crimes per 100K people in 2020: 322.2 — 516th highest of 1,120 cities
> Population: 48,261

35. Florence, South Carolina
> 1-yr. change in reported homicides per 100K people: +12.5
> Homicides reported in 2020: 12 — 146th highest of 1,122 cities (tied)
> Homicides per 100K people in 2020: 31.1 — 24th highest of 1,122 cities
> 1-yr. change in all violent crime per 100K people: +268.5 — 14th highest of 1,119 cities
> Violent crimes per 100K people in 2020: 1,456.1 — 15th highest of 1,120 cities
> Population: 38,487
[in-text-ad]

34. Albany, New York
> 1-yr. change in reported homicides per 100K people: +12.5
> Homicides reported in 2020: 16 — 113th highest of 1,122 cities (tied)
> Homicides per 100K people in 2020: 16.6 — 91st highest of 1,122 cities
> 1-yr. change in all violent crime per 100K people: +145.2 — 67th highest of 1,119 cities
> Violent crimes per 100K people in 2020: 902.2 — 82nd highest of 1,120 cities
> Population: 97,478
[recirclink id=984954]

33. Warren, Ohio
> 1-yr. change in reported homicides per 100K people: +12.8
> Homicides reported in 2020: 10 — 160th highest of 1,122 cities (tied)
> Homicides per 100K people in 2020: 26.0 — 34th highest of 1,122 cities
> 1-yr. change in all violent crime per 100K people: -107.9 — 41st lowest of 1,119 cities
> Violent crimes per 100K people in 2020: 449.8 — 348th highest of 1,120 cities
> Population: 39,307

32. Dover, Delaware
> 1-yr. change in reported homicides per 100K people: +13.0
> Homicides reported in 2020: 9 — 172nd highest of 1,122 cities (tied)
> Homicides per 100K people in 2020: 23.4 — 42nd highest of 1,122 cities
> 1-yr. change in all violent crime per 100K people: -14.5 — 332nd lowest of 1,119 cities
> Violent crimes per 100K people in 2020: 856.1 — 97th highest of 1,120 cities
> Population: 37,523
[in-text-ad-2]

31. New Bern, North Carolina
> 1-yr. change in reported homicides per 100K people: +13.3
> Homicides reported in 2020: 4 — 310th highest of 1,122 cities (tied)
> Homicides per 100K people in 2020: 13.3 — 140th highest of 1,122 cities
> 1-yr. change in all violent crime per 100K people: +218.3 — 22nd highest of 1,119 cities
> Violent crimes per 100K people in 2020: 632.3 — 182nd highest of 1,120 cities
> Population: 29,895
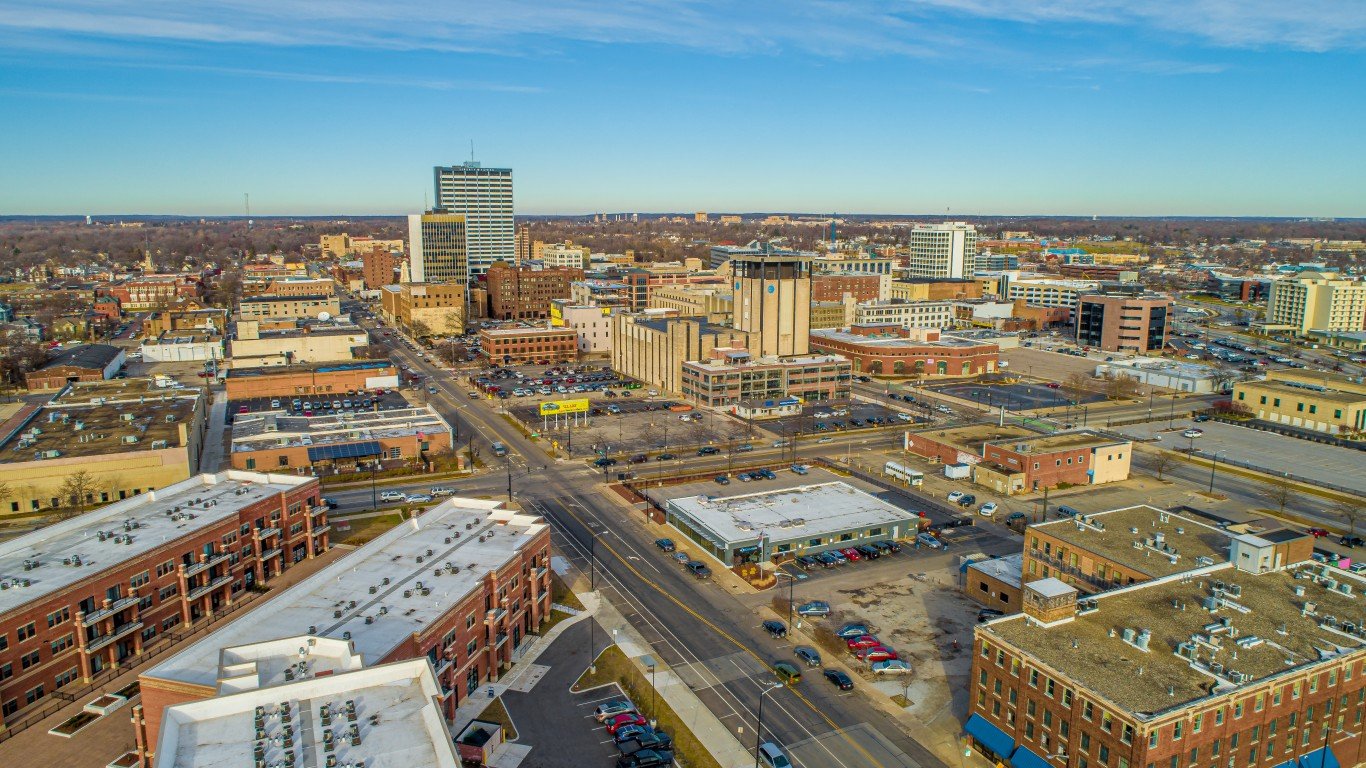
30. South Bend, Indiana
> 1-yr. change in reported homicides per 100K people: +13.7
> Homicides reported in 2020: 28 — 71st highest of 1,122 cities (tied)
> Homicides per 100K people in 2020: 27.4 — 32nd highest of 1,122 cities
> 1-yr. change in all violent crime per 100K people: +397.3 — 4th highest of 1,119 cities
> Violent crimes per 100K people in 2020: 1,728.4 — 9th highest of 1,120 cities
> Population: 102,037
[in-text-ad]
29. Lauderdale Lakes, Florida
> 1-yr. change in reported homicides per 100K people: +13.7
> Homicides reported in 2020: 7 — 209th highest of 1,122 cities (tied)
> Homicides per 100K people in 2020: 19.1 — 64th highest of 1,122 cities
> 1-yr. change in all violent crime per 100K people: -140.0 — 16th lowest of 1,119 cities
> Violent crimes per 100K people in 2020: 754.4 — 131st highest of 1,120 cities
> Population: 35,606
[recirclink id=1055273]
28. Joplin, Missouri
> 1-yr. change in reported homicides per 100K people: +13.7
> Homicides reported in 2020: 9 — 172nd highest of 1,122 cities (tied)
> Homicides per 100K people in 2020: 17.7 — 83rd highest of 1,122 cities
> 1-yr. change in all violent crime per 100K people: +57.3 — 234th highest of 1,119 cities
> Violent crimes per 100K people in 2020: 663.6 — 170th highest of 1,120 cities
> Population: 50,386

27. Cleveland Heights, Ohio
> 1-yr. change in reported homicides per 100K people: +13.7
> Homicides reported in 2020: 7 — 209th highest of 1,122 cities (tied)
> Homicides per 100K people in 2020: 16.0 — 99th highest of 1,122 cities
> 1-yr. change in all violent crime per 100K people: +47.6 — 268th highest of 1,119 cities
> Violent crimes per 100K people in 2020: 263.0 — 506th lowest of 1,120 cities
> Population: 44,571
[in-text-ad-2]

26. Salisbury, North Carolina
> 1-yr. change in reported homicides per 100K people: +14.7
> Homicides reported in 2020: 7 — 209th highest of 1,122 cities (tied)
> Homicides per 100K people in 2020: 20.6 — 52nd highest of 1,122 cities
> 1-yr. change in all violent crime per 100K people: +2.2 — 509th lowest of 1,119 cities
> Violent crimes per 100K people in 2020: 737.3 — 140th highest of 1,120 cities
> Population: 33,727
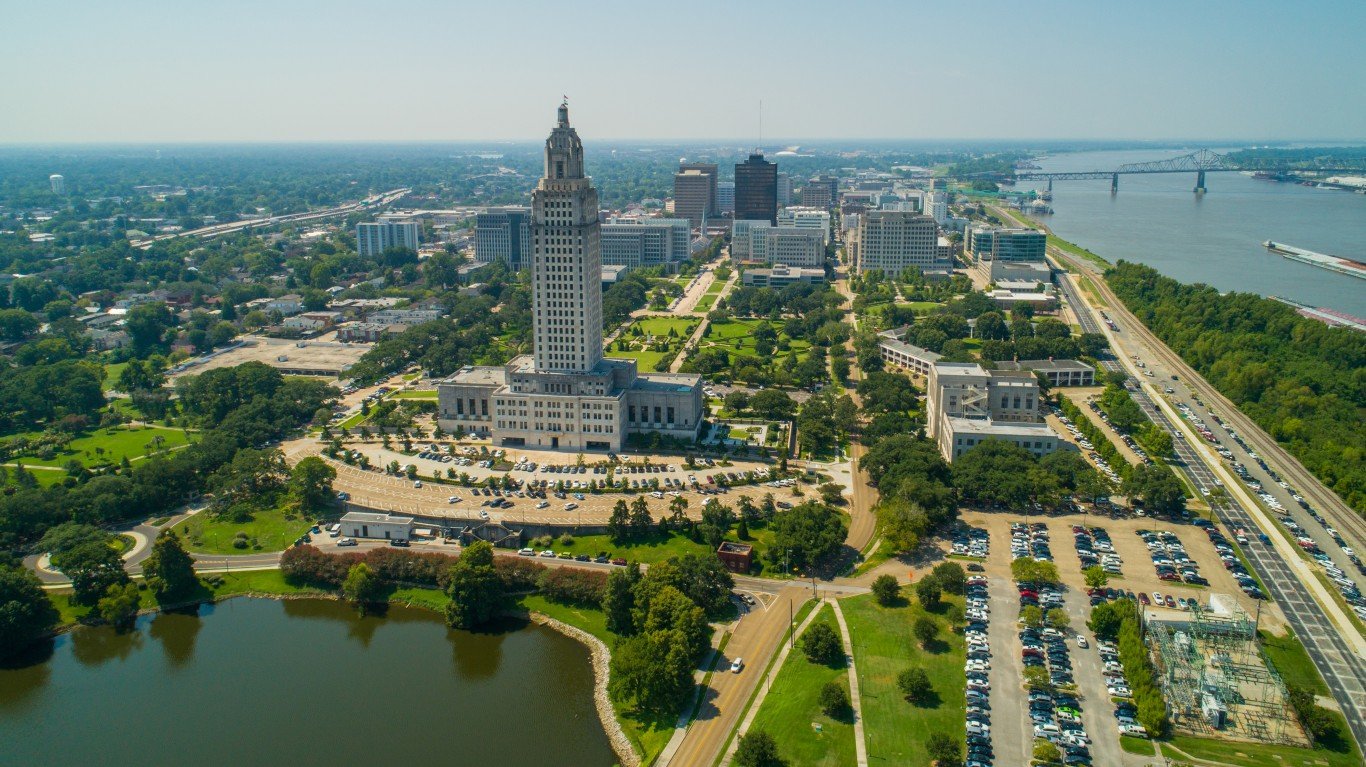
25. Baton Rouge, Louisiana
> 1-yr. change in reported homicides per 100K people: +14.8
> Homicides reported in 2020: 102 — 20th highest of 1,122 cities (tied)
> Homicides per 100K people in 2020: 46.5 — 9th highest of 1,122 cities
> 1-yr. change in all violent crime per 100K people: +15.6 — 474th highest of 1,119 cities
> Violent crimes per 100K people in 2020: 951.9 — 69th highest of 1,120 cities
> Population: 224,149
[in-text-ad]

24. Memphis, Tennessee
> 1-yr. change in reported homicides per 100K people: +15.2
> Homicides reported in 2020: 289 — 6th highest of 1,122 cities
> Homicides per 100K people in 2020: 44.4 — 12th highest of 1,122 cities
> 1-yr. change in all violent crime per 100K people: +450.6 — 3rd highest of 1,119 cities
> Violent crimes per 100K people in 2020: 2,352.0 — 2nd highest of 1,120 cities
> Population: 651,932
[recirclink id=1038777]

23. Kankakee, Illinois
> 1-yr. change in reported homicides per 100K people: +15.5
> Homicides reported in 2020: 8 — 191st highest of 1,122 cities (tied)
> Homicides per 100K people in 2020: 30.9 — 25th highest of 1,122 cities
> 1-yr. change in all violent crime per 100K people: +31.2 — 362nd highest of 1,119 cities
> Violent crimes per 100K people in 2020: 943.4 — 71st highest of 1,120 cities
> Population: 25,830

22. Mauldin, South Carolina
> 1-yr. change in reported homicides per 100K people: +15.6
> Homicides reported in 2020: 4 — 310th highest of 1,122 cities (tied)
> Homicides per 100K people in 2020: 15.6 — 103rd highest of 1,122 cities
> 1-yr. change in all violent crime per 100K people: +37.1 — 317th highest of 1,119 cities
> Violent crimes per 100K people in 2020: 261.1 — 503rd lowest of 1,120 cities
> Population: 25,217
[in-text-ad-2]
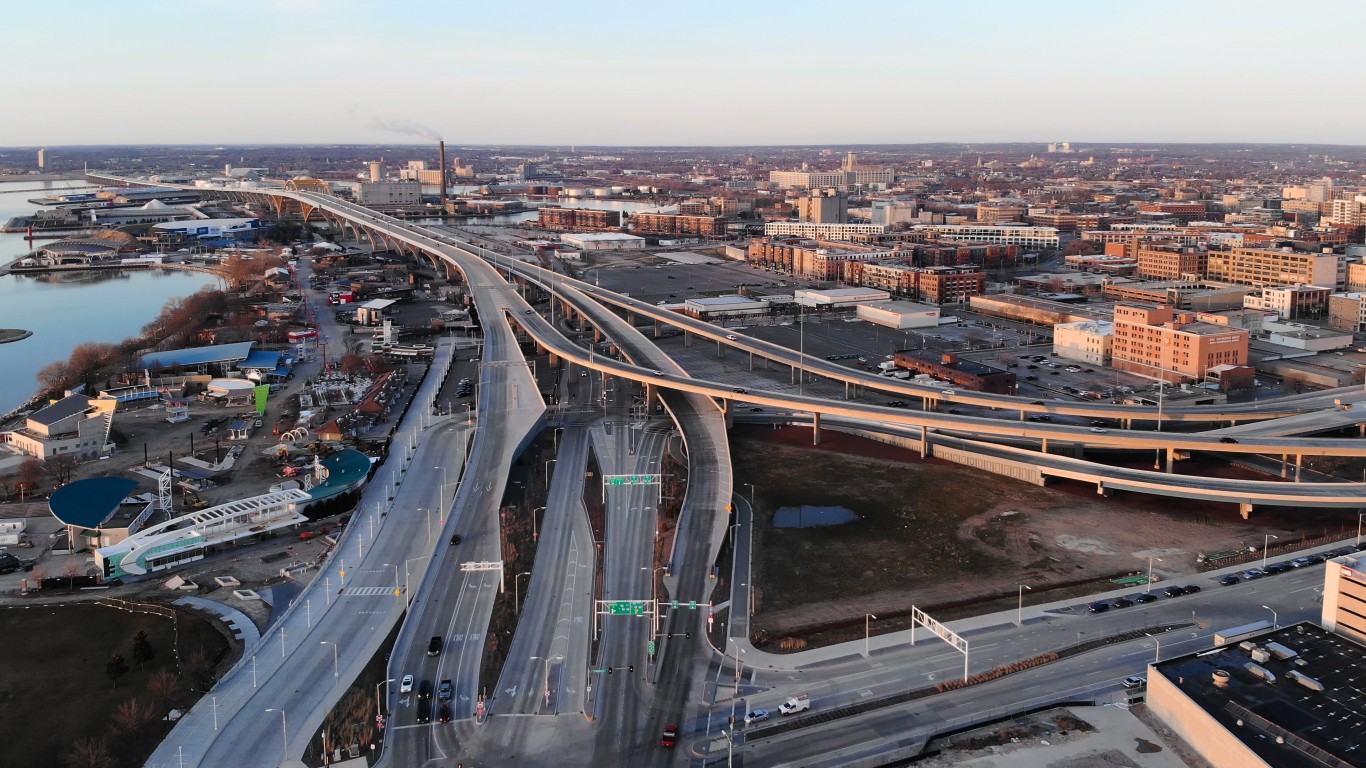
21. Milwaukee, Wisconsin
> 1-yr. change in reported homicides per 100K people: +16.0
> Homicides reported in 2020: 191 — 11th highest of 1,122 cities
> Homicides per 100K people in 2020: 32.4 — 21st highest of 1,122 cities
> 1-yr. change in all violent crime per 100K people: +264.3 — 15th highest of 1,119 cities
> Violent crimes per 100K people in 2020: 1,596.8 — 12th highest of 1,120 cities
> Population: 594,548

20. Petersburg, Virginia
> 1-yr. change in reported homicides per 100K people: +16.2
> Homicides reported in 2020: 24 — 79th highest of 1,122 cities (tied)
> Homicides per 100K people in 2020: 76.9 — 2nd highest of 1,122 cities
> 1-yr. change in all violent crime per 100K people: -116.7 — 33rd lowest of 1,119 cities
> Violent crimes per 100K people in 2020: 631.5 — 183rd highest of 1,120 cities
> Population: 31,362
[in-text-ad]
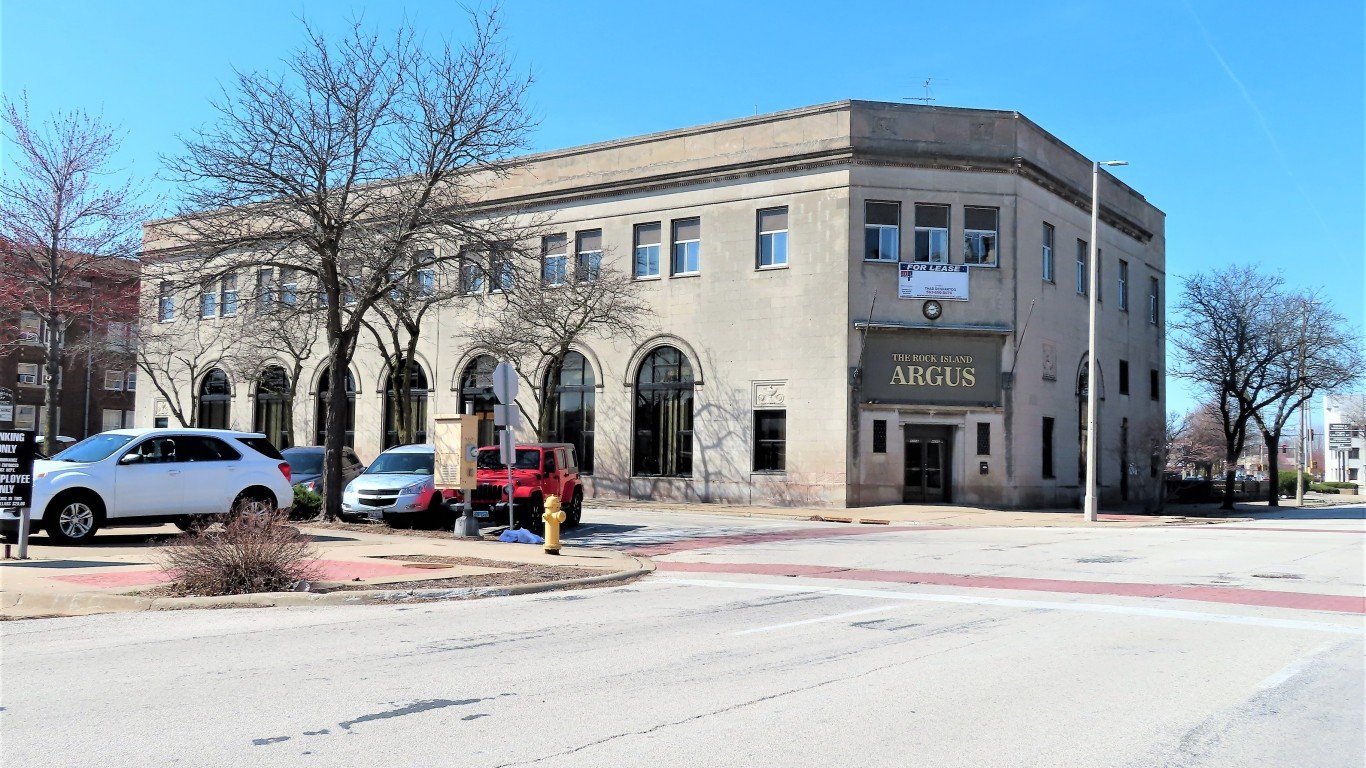
19. Rock Island, Illinois
> 1-yr. change in reported homicides per 100K people: +16.3
> Homicides reported in 2020: 7 — 209th highest of 1,122 cities (tied)
> Homicides per 100K people in 2020: 18.9 — 66th highest of 1,122 cities
> 1-yr. change in all violent crime per 100K people: +205.5 — 28th highest of 1,119 cities
> Violent crimes per 100K people in 2020: 576.0 — 216th highest of 1,120 cities
> Population: 38,111
[recirclink id=1016354]
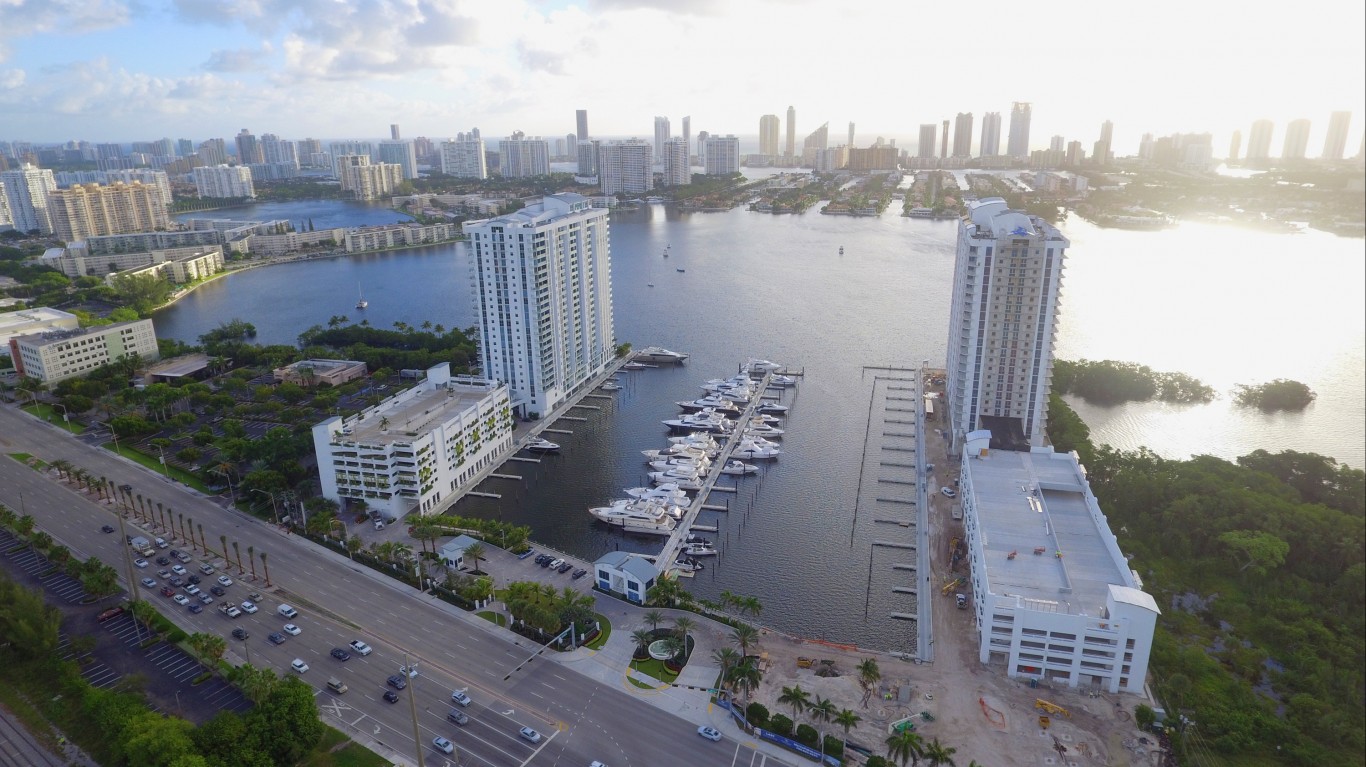
18. North Miami Beach, Florida
> 1-yr. change in reported homicides per 100K people: +16.3
> Homicides reported in 2020: 8 — 191st highest of 1,122 cities (tied)
> Homicides per 100K people in 2020: 18.5 — 72nd highest of 1,122 cities
> 1-yr. change in all violent crime per 100K people: +132.4 — 80th highest of 1,119 cities
> Violent crimes per 100K people in 2020: 734.9 — 144th highest of 1,120 cities
> Population: 42,971

17. Los Banos, California
> 1-yr. change in reported homicides per 100K people: +16.7
> Homicides reported in 2020: 9 — 172nd highest of 1,122 cities (tied)
> Homicides per 100K people in 2020: 21.6 — 50th highest of 1,122 cities
> 1-yr. change in all violent crime per 100K people: +176.3 — 43rd highest of 1,119 cities
> Violent crimes per 100K people in 2020: 528.5 — 257th highest of 1,120 cities
> Population: 38,914
[in-text-ad-2]
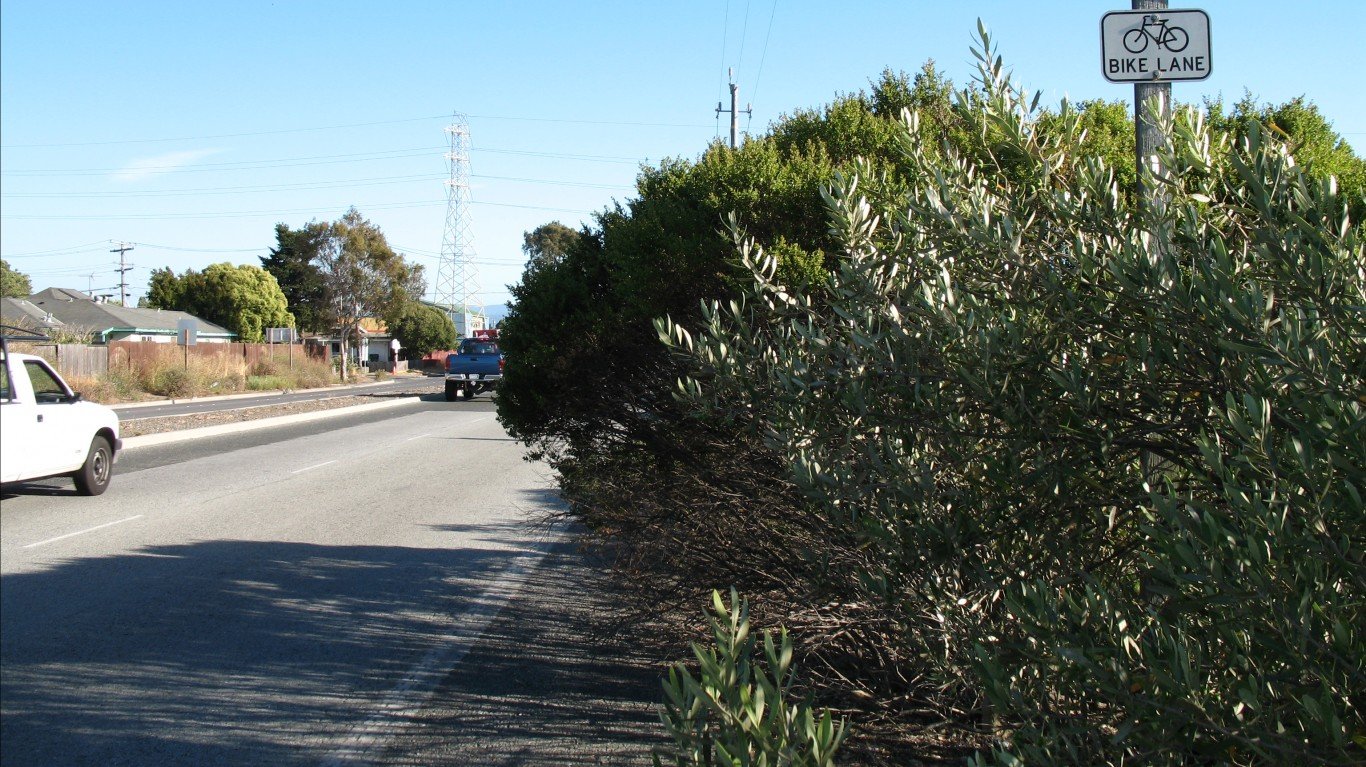
16. East Palo Alto, California
> 1-yr. change in reported homicides per 100K people: +17.0
> Homicides reported in 2020: 6 — 243rd highest of 1,122 cities (tied)
> Homicides per 100K people in 2020: 20.4 — 53rd highest of 1,122 cities
> 1-yr. change in all violent crime per 100K people: +10.9 — 520th highest of 1,119 cities
> Violent crimes per 100K people in 2020: 495.9 — 295th highest of 1,120 cities
> Population: 29,593

15. Cleveland, Ohio
> 1-yr. change in reported homicides per 100K people: +18.1
> Homicides reported in 2020: 160 — 15th highest of 1,122 cities
> Homicides per 100K people in 2020: 42.2 — 14th highest of 1,122 cities
> 1-yr. change in all violent crime per 100K people: +140.1 — 72nd highest of 1,119 cities
> Violent crimes per 100K people in 2020: 1,656.7 — 11th highest of 1,120 cities
> Population: 385,282
[in-text-ad]

14. Dania Beach, Florida
> 1-yr. change in reported homicides per 100K people: +18.4
> Homicides reported in 2020: 8 — 191st highest of 1,122 cities (tied)
> Homicides per 100K people in 2020: 24.6 — 38th highest of 1,122 cities
> 1-yr. change in all violent crime per 100K people: -54.5 — 129th lowest of 1,119 cities
> Violent crimes per 100K people in 2020: 623.5 — 193rd highest of 1,120 cities
> Population: 32,008
[recirclink id=1011842]

13. Shreveport, Louisiana
> 1-yr. change in reported homicides per 100K people: +18.5
> Homicides reported in 2020: 69 — 28th highest of 1,122 cities
> Homicides per 100K people in 2020: 37.2 — 17th highest of 1,122 cities
> 1-yr. change in all violent crime per 100K people: +143.5 — 68th highest of 1,119 cities
> Violent crimes per 100K people in 2020: 923.0 — 74th highest of 1,120 cities
> Population: 192,035

12. Portsmouth, Virginia
> 1-yr. change in reported homicides per 100K people: +19.1
> Homicides reported in 2020: 34 — 62nd highest of 1,122 cities
> Homicides per 100K people in 2020: 36.1 — 18th highest of 1,122 cities
> 1-yr. change in all violent crime per 100K people: -25.5 — 249th lowest of 1,119 cities
> Violent crimes per 100K people in 2020: 920.3 — 78th highest of 1,120 cities
> Population: 95,097
[in-text-ad-2]
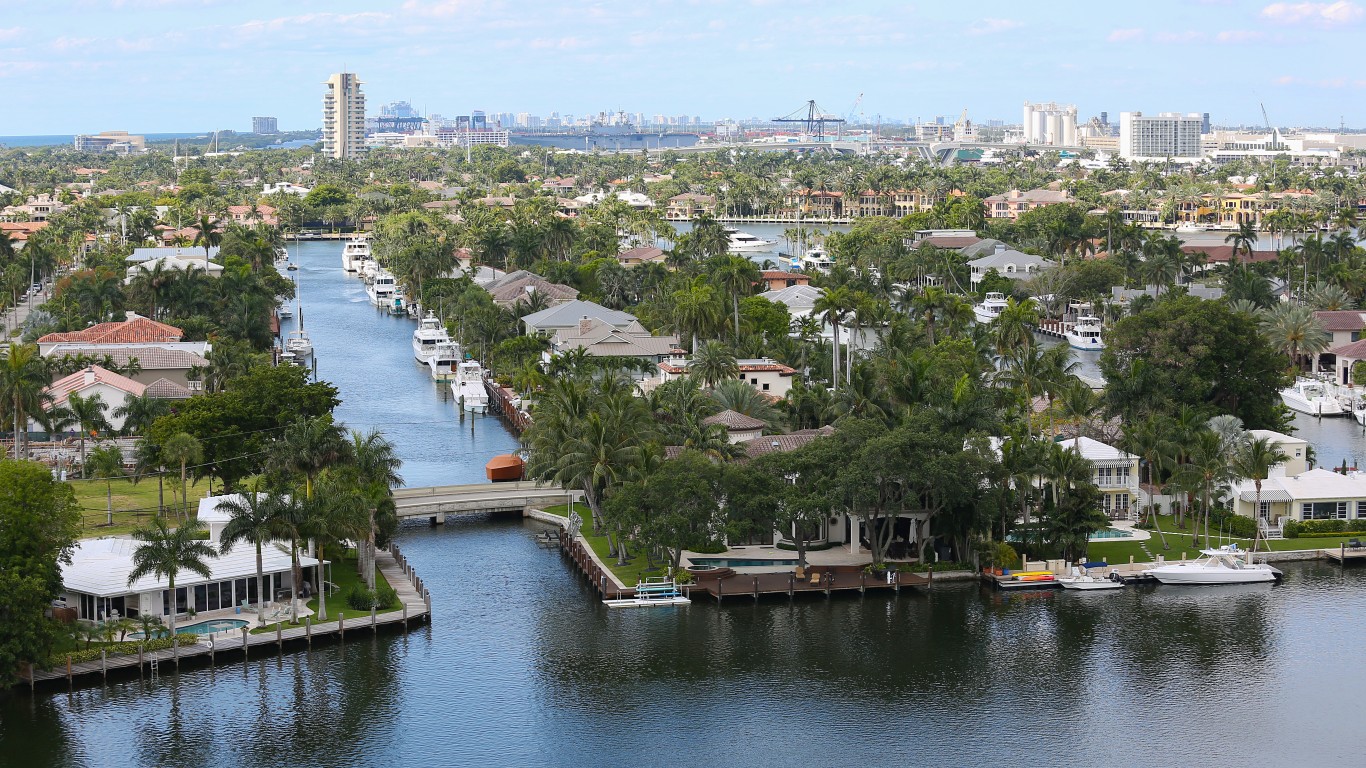
11. Hallandale Beach, Florida
> 1-yr. change in reported homicides per 100K people: +19.9
> Homicides reported in 2020: 10 — 160th highest of 1,122 cities (tied)
> Homicides per 100K people in 2020: 24.9 — 36th highest of 1,122 cities
> 1-yr. change in all violent crime per 100K people: +56.4 — 239th highest of 1,119 cities
> Violent crimes per 100K people in 2020: 498.1 — 292nd highest of 1,120 cities
> Population: 39,656

10. Harrisburg, Pennsylvania
> 1-yr. change in reported homicides per 100K people: +20.3
> Homicides reported in 2020: 23 — 85th highest of 1,122 cities (tied)
> Homicides per 100K people in 2020: 46.7 — 8th highest of 1,122 cities
> 1-yr. change in all violent crime per 100K people: -43.5 — 176th lowest of 1,119 cities
> Violent crimes per 100K people in 2020: 857.0 — 96th highest of 1,120 cities
> Population: 49,209
[in-text-ad]

9. New Orleans, Louisiana
> 1-yr. change in reported homicides per 100K people: +20.4
> Homicides reported in 2020: 201 — 9th highest of 1,122 cities
> Homicides per 100K people in 2020: 51.0 — 4th highest of 1,122 cities
> 1-yr. change in all violent crime per 100K people: +179.6 — 41st highest of 1,119 cities
> Violent crimes per 100K people in 2020: 1,324.3 — 26th highest of 1,120 cities
> Population: 390,845
[recirclink id=984954]

8. Monroe, Louisiana
> 1-yr. change in reported homicides per 100K people: +21.5
> Homicides reported in 2020: 19 — 95th highest of 1,122 cities (tied)
> Homicides per 100K people in 2020: 40.3 — 16th highest of 1,122 cities
> 1-yr. change in all violent crime per 100K people: +1,203.5 — the highest of 1,119 cities
> Violent crimes per 100K people in 2020: 2,969.1 — the highest of 1,120 cities
> Population: 48,241

7. Alexandria, Louisiana
> 1-yr. change in reported homicides per 100K people: +22.0
> Homicides reported in 2020: 19 — 95th highest of 1,122 cities (tied)
> Homicides per 100K people in 2020: 41.3 — 15th highest of 1,122 cities
> 1-yr. change in all violent crime per 100K people: +278.6 — 12th highest of 1,119 cities
> Violent crimes per 100K people in 2020: 1,848.4 — 7th highest of 1,120 cities
> Population: 47,012
[in-text-ad-2]

6. Flint, Michigan
> 1-yr. change in reported homicides per 100K people: +22.2
> Homicides reported in 2020: 44 — 46th highest of 1,122 cities (tied)
> Homicides per 100K people in 2020: 46.4 — 10th highest of 1,122 cities
> 1-yr. change in all violent crime per 100K people: -298.4 — the lowest of 1,119 cities
> Violent crimes per 100K people in 2020: 1,050.2 — 49th highest of 1,120 cities
> Population: 96,559

5. St. Louis, Missouri
> 1-yr. change in reported homicides per 100K people: +23.6
> Homicides reported in 2020: 263 — 7th highest of 1,122 cities
> Homicides per 100K people in 2020: 88.1 — the highest of 1,122 cities
> 1-yr. change in all violent crime per 100K people: +89.0 — 138th highest of 1,119 cities
> Violent crimes per 100K people in 2020: 2,016.3 — 5th highest of 1,120 cities
> Population: 308,174
[in-text-ad]

4. Riviera Beach, Florida
> 1-yr. change in reported homicides per 100K people: +24.8
> Homicides reported in 2020: 16 — 113th highest of 1,122 cities (tied)
> Homicides per 100K people in 2020: 44.7 — 11th highest of 1,122 cities
> 1-yr. change in all violent crime per 100K people: +210.7 — 25th highest of 1,119 cities
> Violent crimes per 100K people in 2020: 1,195.6 — 34th highest of 1,120 cities
> Population: 34,702
[recirclink id=1055273]

3. Jacksonville, Arkansas
> 1-yr. change in reported homicides per 100K people: +28.4
> Homicides reported in 2020: 8 — 191st highest of 1,122 cities (tied)
> Homicides per 100K people in 2020: 28.4 — 29th highest of 1,122 cities
> 1-yr. change in all violent crime per 100K people: +200.4 — 29th highest of 1,119 cities
> Violent crimes per 100K people in 2020: 1,158.9 — 39th highest of 1,120 cities
> Population: 28,456

2. Trenton, New Jersey
> 1-yr. change in reported homicides per 100K people: +30.3
> Homicides reported in 2020: 40 — 51st highest of 1,122 cities (tied)
> Homicides per 100K people in 2020: 48.2 — 7th highest of 1,122 cities
> 1-yr. change in all violent crime per 100K people: +46.0 — 275th highest of 1,119 cities
> Violent crimes per 100K people in 2020: 1,168.8 — 37th highest of 1,120 cities
> Population: 83,412
[in-text-ad-2]

1. Saginaw, Michigan
> 1-yr. change in reported homicides per 100K people: +31.5
> Homicides reported in 2020: 24 — 79th highest of 1,122 cities (tied)
> Homicides per 100K people in 2020: 50.2 — 5th highest of 1,122 cities
> 1-yr. change in all violent crime per 100K people: +679.9 — 2nd highest of 1,119 cities
> Violent crimes per 100K people in 2020: 2,154.2 — 4th highest of 1,120 cities
> Population: 48,650
Methodology
To determine the cities where the murder rate is rising, 24/7 Wall St. reviewed the change in murder rate per 100,000 people from the FBI’s 2019 and 2020 Uniform Crime Reports.
We included cities that have more than 25,000 people based on five-year estimates from the U.S. Census Bureau’s 2019 American Community Survey. Limited data was available in the 2020 UCR for areas in Alabama, Maryland, Pennsylvania, and Illinois, though cities in these states were not excluded from analysis. Because some state and local agencies changed reporting practices between 2019 and 2020, the figures are not comparable, and these areas were excluded.
Population figures are five-year estimates from the U.S. Census Bureau’s 2019 American Community Survey. However, these estimates were not used to calculate crime rates. Crime rates per 100,000 people were calculated using population figures provided by the FBI in the 2020 and 2019 UCR.
Contact [email protected] for any questions or corrections.