
The United States recorded a historic surge in homicides in 2020. According to the FBI, there were 21,570 murders nationwide in 2020, a 29% increase from 2019 – the largest single-year increase ever reported in the United States.
Though the precise reasons for the surge have yet to be determined, experts speculate that unrest following the murder of George Floyd, along with social and economic upheaval wrought by the COVID-19 pandemic, likely played a role. Gun sales also surged in 2020, and firearms were used in 77% of murder cases, up from 73% in 2019. Here is a look at the states where gun sales are surging.
The spike in deadly violence has pushed the number of murders in the U.S. to its highest level since the mid-1990s. Not all parts of the country followed the national trend, however, and some major metropolitan areas reported a year-over-year decline in the homicide rate.
Using data from the FBI, 24/7 Wall St. identified the 50 metro areas where the murder rate is falling fastest. Metro areas are ranked by the year-over-year change in the number of murders per 100,000 people in 2020. Among the metro areas on this list, the murder rate fell anywhere from 0.2 homicides to 5.2 homicides per 100,000 people. Meanwhile, the national murder rate climbed by 1.5 homicides per 100,000 people in 2020.
Murder – along with rаpe, robbery, and aggravated assault – is one component of the overall violent crime category. Even though murder accounts for a small percentage of all violent crimes, just over half of the metro areas on this list also reported an decline in the overall violent crime rate in 2020.
The largest share of metro areas that reported the largest declines in homicide are in the South, including 10 in Florida alone. Most of the metro areas on this list have a lower overall homicide rate than the national rate of 6.5 murders per 100,000 people. Here is a look at the city with the lowest murder rate in every state.
Click here to see the metros where murder rate is falling
Click here to read our detailed methodology

50. Salinas, CA
> 1-yr. change in reported homicides per 100K people: -0.2
> Homicides reported in 2020: 14 — 98th highest of 211 metros (tied)
> Homicides per 100K people in 2020: 3.2 — 65th lowest of 211 metros
> 1-yr. change in all violent crime per 100K people: +12.9 — 104th lowest of 209 metros
> Violent crimes per 100K people in 2020: 342.8 — 99th lowest of 210 metros
> Population: 434,061
[in-text-ad]
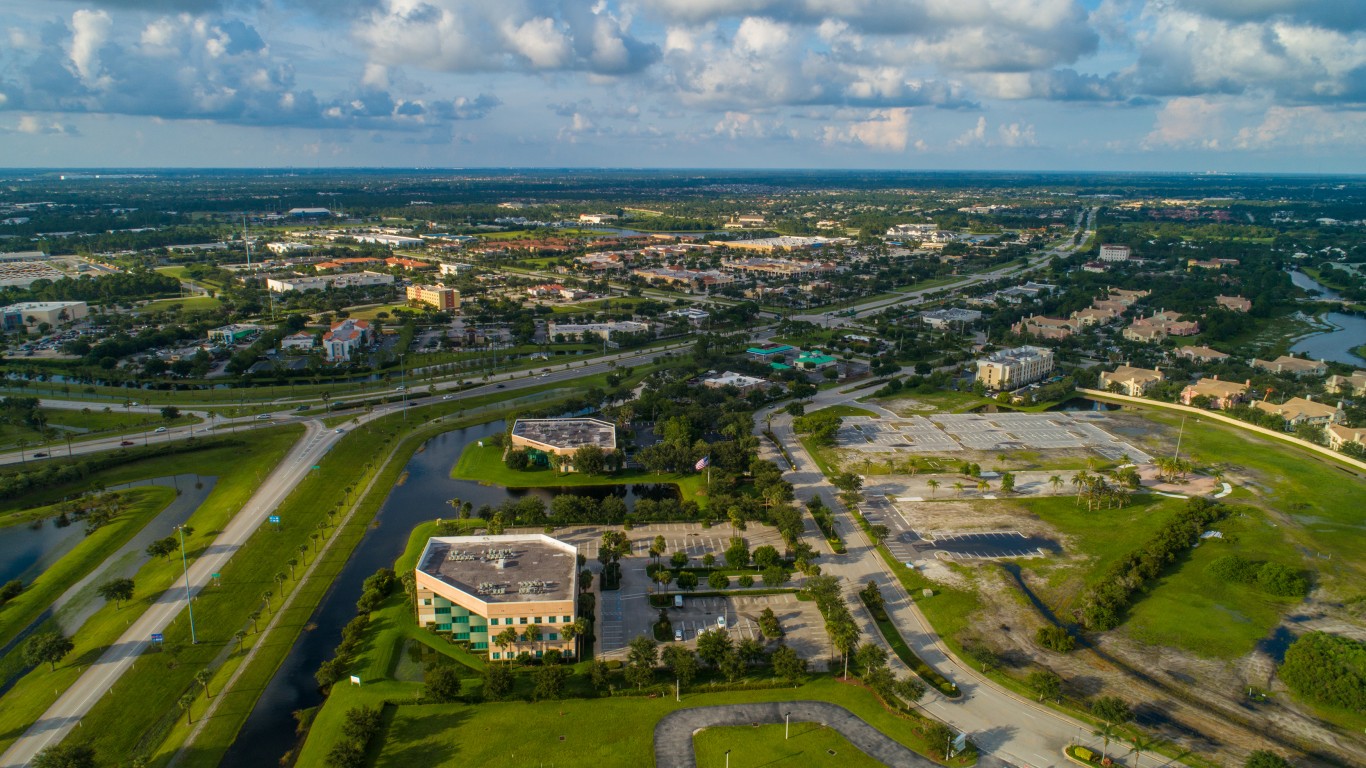
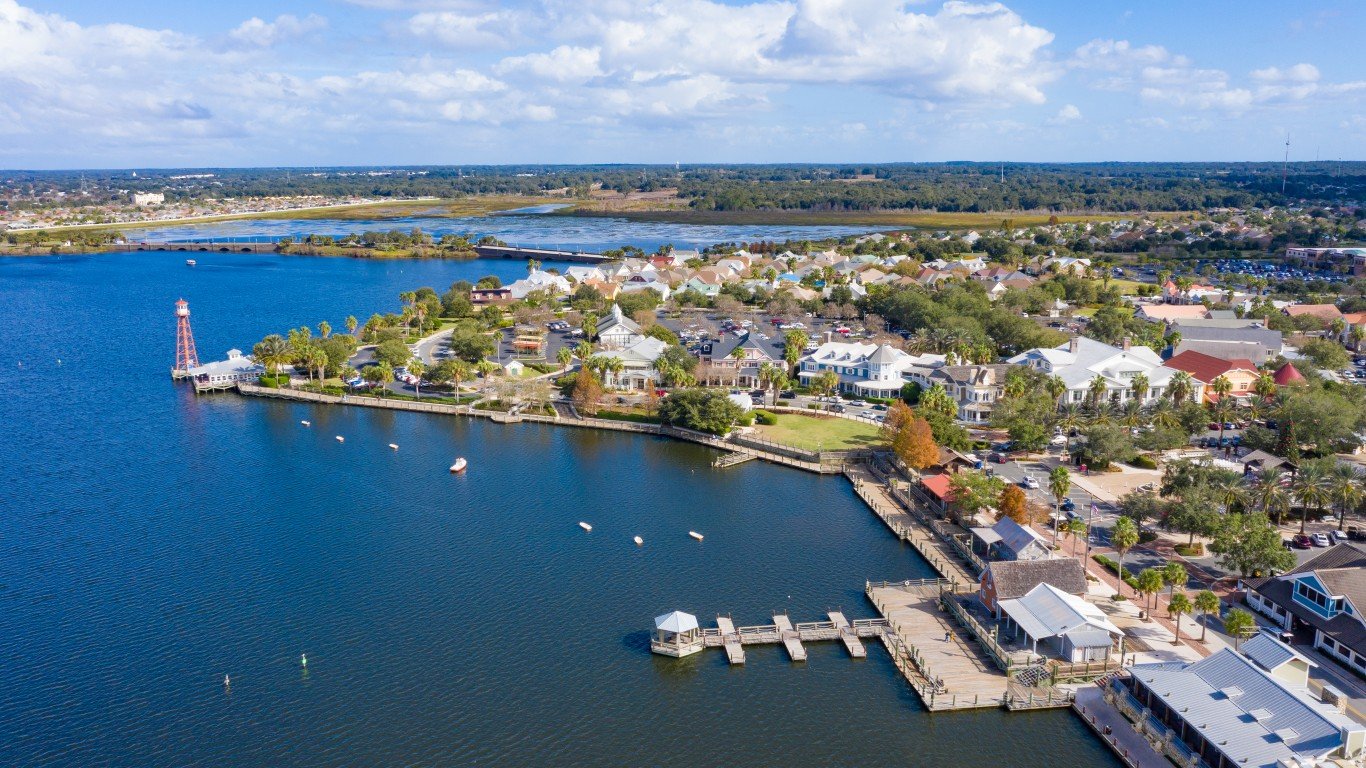
49. Port St. Lucie, FL
> 1-yr. change in reported homicides per 100K people: -0.3
> Homicides reported in 2020: 23 — 70th highest of 211 metros (tied)
> Homicides per 100K people in 2020: 4.6 — 96th lowest of 211 metros
> 1-yr. change in all violent crime per 100K people: -2.7 — 68th lowest of 209 metros
> Violent crimes per 100K people in 2020: 236.1 — 51st lowest of 210 metros
> Population: 489,297
[recirclink id=1038777]
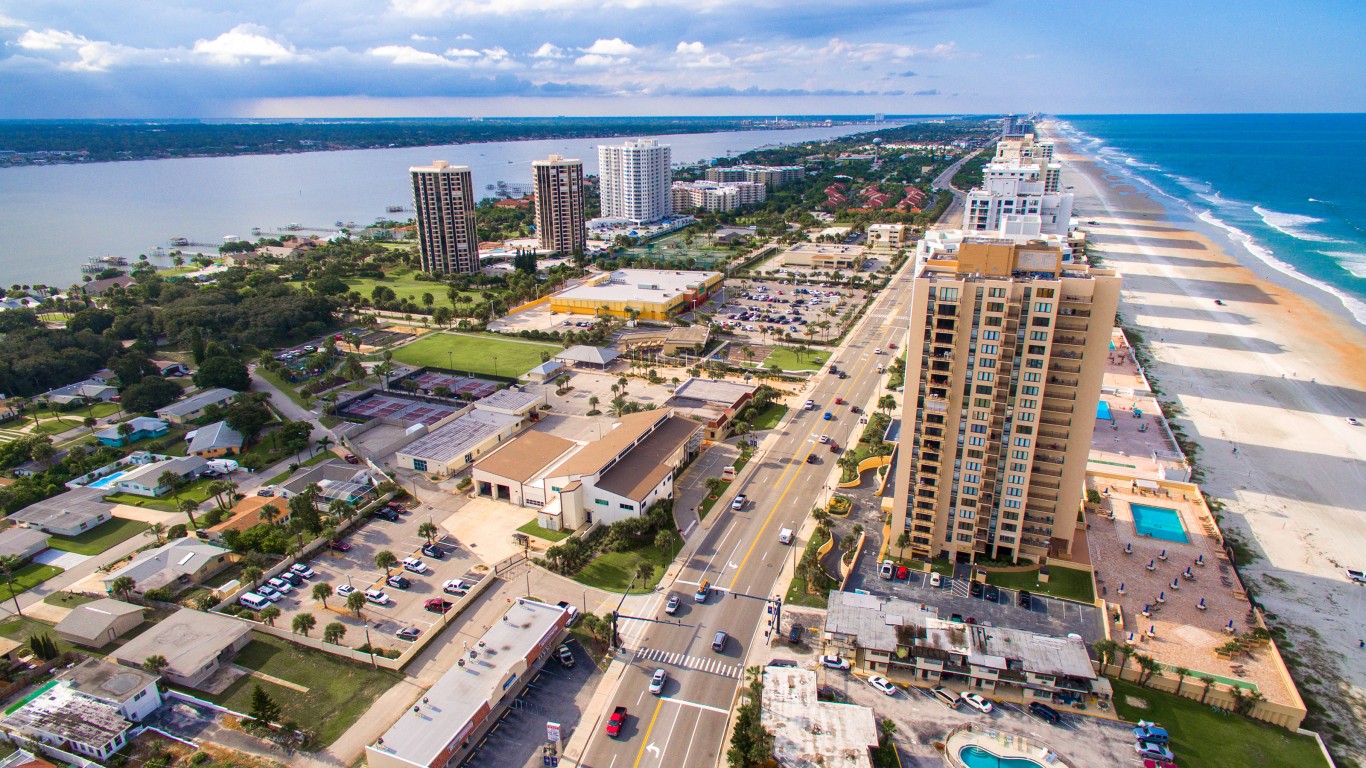
48. Deltona-Daytona Beach-Ormond Beach, FL
> 1-yr. change in reported homicides per 100K people: -0.4
> Homicides reported in 2020: 26 — 63rd highest of 211 metros (tied)
> Homicides per 100K people in 2020: 3.8 — 78th lowest of 211 metros
> 1-yr. change in all violent crime per 100K people: +18.2 — 94th highest of 209 metros
> Violent crimes per 100K people in 2020: 337.5 — 96th lowest of 210 metros
> Population: 668,365

47. Lynchburg, VA
> 1-yr. change in reported homicides per 100K people: -0.4
> Homicides reported in 2020: 9 — 77th lowest of 211 metros (tied)
> Homicides per 100K people in 2020: 3.4 — 68th lowest of 211 metros
> 1-yr. change in all violent crime per 100K people: +13.5 — 103rd highest of 209 metros
> Violent crimes per 100K people in 2020: 244.2 — 55th lowest of 210 metros
> Population: 266,186
[in-text-ad-2]

46. Springfield, MA
> 1-yr. change in reported homicides per 100K people: -0.4
> Homicides reported in 2020: 28 — 61st highest of 211 metros (tied)
> Homicides per 100K people in 2020: 4.0 — 86th lowest of 211 metros
> 1-yr. change in all violent crime per 100K people: -8.3 — 53rd lowest of 209 metros
> Violent crimes per 100K people in 2020: 463.4 — 57th highest of 210 metros
> Population: 697,382

45. Appleton, WI
> 1-yr. change in reported homicides per 100K people: -0.4
> Homicides reported in 2020: 3 — 20th lowest of 211 metros (tied)
> Homicides per 100K people in 2020: 1.3 — 18th lowest of 211 metros
> 1-yr. change in all violent crime per 100K people: +6.4 — 90th lowest of 209 metros
> Violent crimes per 100K people in 2020: 170.6 — 17th lowest of 210 metros
> Population: 237,974
[in-text-ad]

44. Oxnard-Thousand Oaks-Ventura, CA
> 1-yr. change in reported homicides per 100K people: -0.5
> Homicides reported in 2020: 20 — 80th highest of 211 metros (tied)
> Homicides per 100K people in 2020: 2.4 — 41st lowest of 211 metros
> 1-yr. change in all violent crime per 100K people: -15.3 — 40th lowest of 209 metros
> Violent crimes per 100K people in 2020: 200.7 — 33rd lowest of 210 metros
> Population: 846,006
[recirclink id=1016354]

43. Worcester, MA-CT
> 1-yr. change in reported homicides per 100K people: -0.5
> Homicides reported in 2020: 13 — 101st lowest of 211 metros (tied)
> Homicides per 100K people in 2020: 1.5 — 21st lowest of 211 metros
> 1-yr. change in all violent crime per 100K people: -6.7 — 60th lowest of 209 metros
> Violent crimes per 100K people in 2020: 303.7 — 82nd lowest of 210 metros
> Population: 947,404

42. Prescott Valley-Prescott, AZ
> 1-yr. change in reported homicides per 100K people: -0.5
> Homicides reported in 2020: 8 — 70th lowest of 211 metros (tied)
> Homicides per 100K people in 2020: 3.3 — 67th lowest of 211 metros
> 1-yr. change in all violent crime per 100K people: -34.2 — 19th lowest of 209 metros
> Violent crimes per 100K people in 2020: 242.9 — 54th lowest of 210 metros
> Population: 235,099
[in-text-ad-2]

41. Bend, OR
> 1-yr. change in reported homicides per 100K people: -0.5
> Homicides reported in 2020: 0 reported — the lowest of 211 metros (tied)
> Homicides per 100K people in 2020: 0.0 reported — the lowest of 211 metros (tied)
> 1-yr. change in all violent crime per 100K people: +13.0 — 105th highest of 209 metros
> Violent crimes per 100K people in 2020: 178.5 — 19th lowest of 210 metros
> Population: 197,692

40. North Port-Sarasota-Bradenton, FL
> 1-yr. change in reported homicides per 100K people: -0.5
> Homicides reported in 2020: 22 — 74th highest of 211 metros (tied)
> Homicides per 100K people in 2020: 2.6 — 48th lowest of 211 metros
> 1-yr. change in all violent crime per 100K people: +7.0 — 92nd lowest of 209 metros
> Violent crimes per 100K people in 2020: 335.4 — 95th lowest of 210 metros
> Population: 836,995
[in-text-ad]
39. Punta Gorda, FL
> 1-yr. change in reported homicides per 100K people: -0.5
> Homicides reported in 2020: 1 — 6th lowest of 211 metros (tied)
> Homicides per 100K people in 2020: 0.5 — 6th lowest of 211 metros
> 1-yr. change in all violent crime per 100K people: -44.0 — 12th lowest of 209 metros
> Violent crimes per 100K people in 2020: 152.2 — 10th lowest of 210 metros
> Population: 188,910
[recirclink id=1011842]

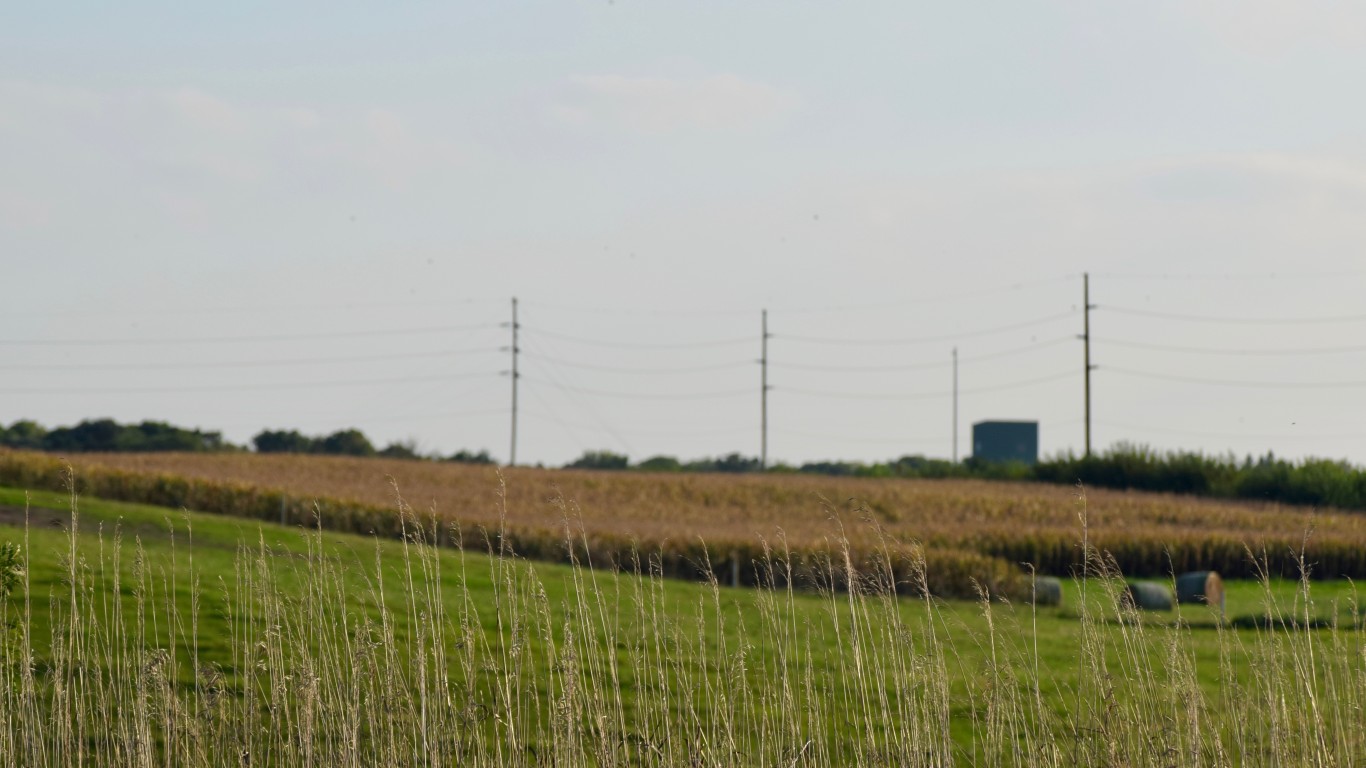
38. Iowa City, IA
> 1-yr. change in reported homicides per 100K people: -0.6
> Homicides reported in 2020: 3 — 20th lowest of 211 metros (tied)
> Homicides per 100K people in 2020: 1.7 — 26th lowest of 211 metros
> 1-yr. change in all violent crime per 100K people: -5.7 — 62nd lowest of 209 metros
> Violent crimes per 100K people in 2020: 271.0 — 70th lowest of 210 metros
> Population: 173,105

37. Elizabethtown-Fort Knox, KY
> 1-yr. change in reported homicides per 100K people: -0.7
> Homicides reported in 2020: 5 — 41st lowest of 211 metros (tied)
> Homicides per 100K people in 2020: 3.2 — 64th lowest of 211 metros
> 1-yr. change in all violent crime per 100K people: +0.7 — 79th lowest of 209 metros
> Violent crimes per 100K people in 2020: 100.5 — 2nd lowest of 210 metros
> Population: 154,713
[in-text-ad-2]

36. Olympia-Lacey-Tumwater, WA
> 1-yr. change in reported homicides per 100K people: -0.7
> Homicides reported in 2020: 3 — 20th lowest of 211 metros (tied)
> Homicides per 100K people in 2020: 1.0 — 12th lowest of 211 metros
> 1-yr. change in all violent crime per 100K people: -23.2 — 31st lowest of 209 metros
> Violent crimes per 100K people in 2020: 223.4 — 43rd lowest of 210 metros
> Population: 290,536

35. Albuquerque, NM
> 1-yr. change in reported homicides per 100K people: -0.7
> Homicides reported in 2020: 87 — 23rd highest of 211 metros
> Homicides per 100K people in 2020: 9.4 — 32nd highest of 211 metros
> 1-yr. change in all violent crime per 100K people: -37.1 — 16th lowest of 209 metros
> Violent crimes per 100K people in 2020: 1,006.4 — 5th highest of 210 metros
> Population: 914,480
[in-text-ad]

34. Pittsfield, MA
> 1-yr. change in reported homicides per 100K people: -0.8
> Homicides reported in 2020: 1 — 6th lowest of 211 metros (tied)
> Homicides per 100K people in 2020: 0.8 — 10th lowest of 211 metros
> 1-yr. change in all violent crime per 100K people: +50.5 — 45th highest of 209 metros
> Violent crimes per 100K people in 2020: 431.2 — 67th highest of 210 metros
> Population: 124,944
[recirclink id=984954]
33. Ames, IA
> 1-yr. change in reported homicides per 100K people: -0.8
> Homicides reported in 2020: 1 — 6th lowest of 211 metros (tied)
> Homicides per 100K people in 2020: 0.8 — 9th lowest of 211 metros
> 1-yr. change in all violent crime per 100K people: -15.5 — 39th lowest of 209 metros
> Violent crimes per 100K people in 2020: 183.8 — 21st lowest of 210 metros
> Population: 123,351
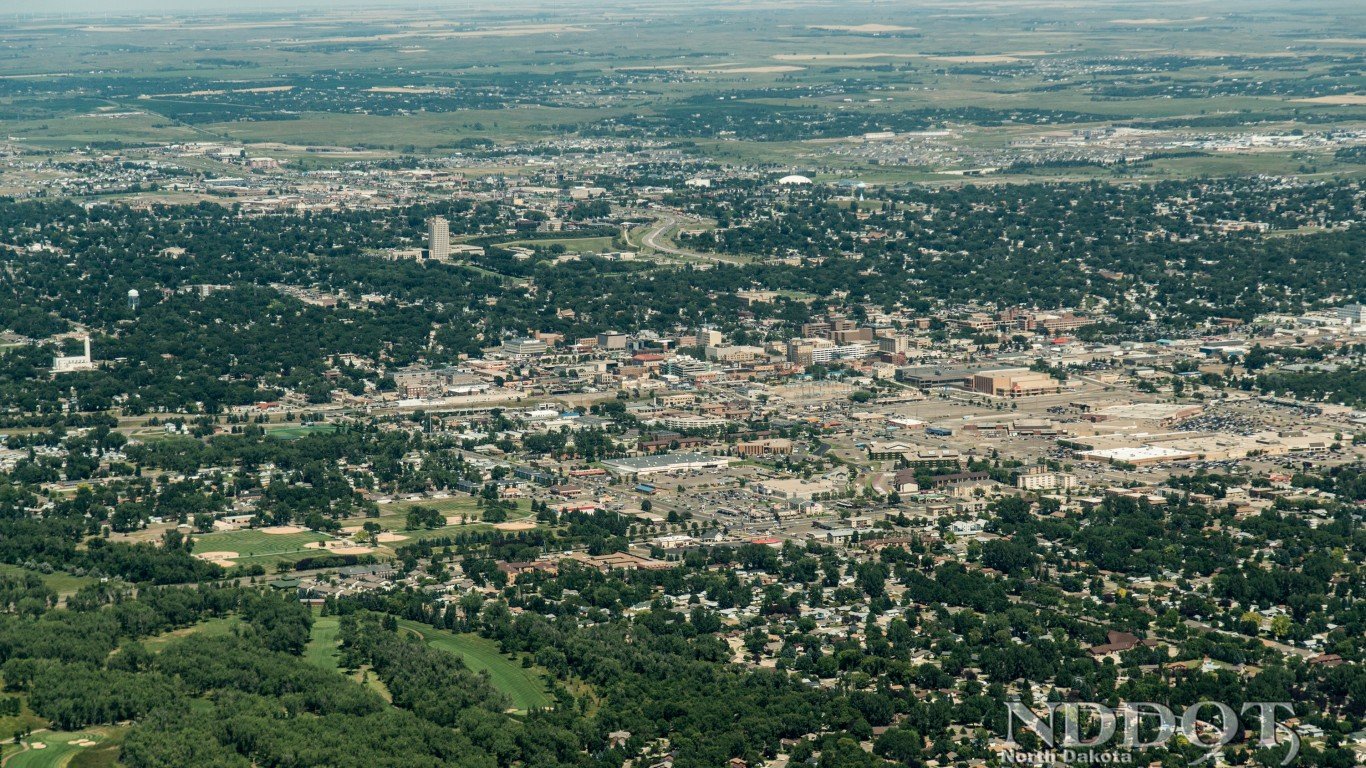
32. Bismarck, ND
> 1-yr. change in reported homicides per 100K people: -0.8
> Homicides reported in 2020: 4 — 34th lowest of 211 metros (tied)
> Homicides per 100K people in 2020: 3.1 — 60th lowest of 211 metros
> 1-yr. change in all violent crime per 100K people: +28.2 — 78th highest of 209 metros
> Violent crimes per 100K people in 2020: 333.9 — 93rd lowest of 210 metros
> Population: 129,115
[in-text-ad-2]

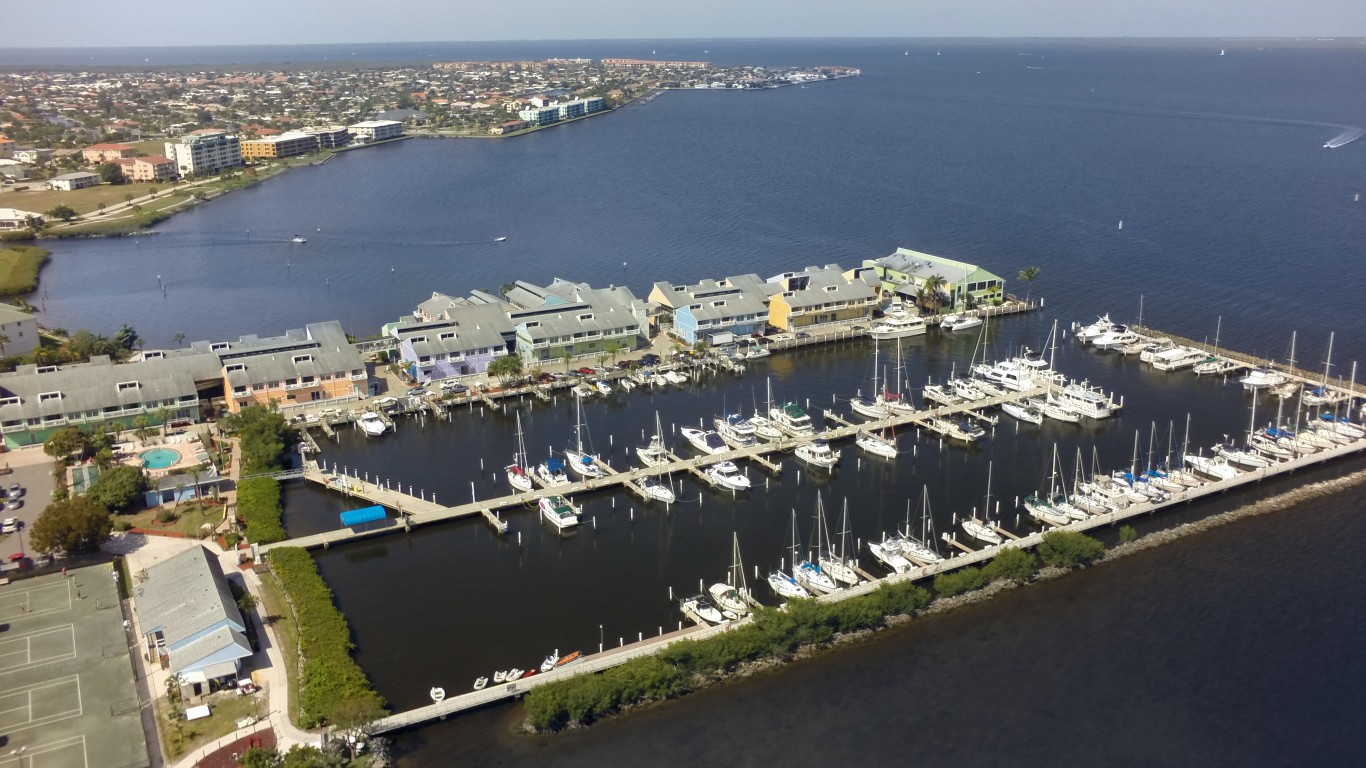
31. Naples-Marco Island, FL
> 1-yr. change in reported homicides per 100K people: -0.8
> Homicides reported in 2020: 6 — 53rd lowest of 211 metros (tied)
> Homicides per 100K people in 2020: 1.5 — 22nd lowest of 211 metros
> 1-yr. change in all violent crime per 100K people: -9.9 — 49th lowest of 209 metros
> Violent crimes per 100K people in 2020: 223.8 — 45th lowest of 210 metros
> Population: 384,902

30. Wenatchee, WA
> 1-yr. change in reported homicides per 100K people: -0.8
> Homicides reported in 2020: 1 — 6th lowest of 211 metros (tied)
> Homicides per 100K people in 2020: 0.8 — 11th lowest of 211 metros
> 1-yr. change in all violent crime per 100K people: +10.1 — 96th lowest of 209 metros
> Violent crimes per 100K people in 2020: 116.2 — 3rd lowest of 210 metros
> Population: 120,629
[in-text-ad]

29. Ithaca, NY
> 1-yr. change in reported homicides per 100K people: -1.0
> Homicides reported in 2020: 0 reported — the lowest of 211 metros (tied)
> Homicides per 100K people in 2020: 0.0 reported — the lowest of 211 metros (tied)
> 1-yr. change in all violent crime per 100K people: +36.4 — 64th highest of 209 metros
> Violent crimes per 100K people in 2020: 160.5 — 12th lowest of 210 metros
> Population: 102,180
[recirclink id=1055273]

28. Victoria, TX
> 1-yr. change in reported homicides per 100K people: -1.0
> Homicides reported in 2020: 6 — 53rd lowest of 211 metros (tied)
> Homicides per 100K people in 2020: 6.0 — 80th highest of 211 metros
> 1-yr. change in all violent crime per 100K people: -15.6 — 38th lowest of 209 metros
> Violent crimes per 100K people in 2020: 448.8 — 62nd highest of 210 metros
> Population: 99,090

27. Pocatello, ID
> 1-yr. change in reported homicides per 100K people: -1.0
> Homicides reported in 2020: 0 reported — the lowest of 211 metros (tied)
> Homicides per 100K people in 2020: 0.0 reported — the lowest of 211 metros (tied)
> 1-yr. change in all violent crime per 100K people: -30.6 — 23rd lowest of 209 metros
> Violent crimes per 100K people in 2020: 268.8 — 66th lowest of 210 metros
> Population: 94,588
[in-text-ad-2]

26. Hot Springs, AR
> 1-yr. change in reported homicides per 100K people: -1.1
> Homicides reported in 2020: 9 — 77th lowest of 211 metros (tied)
> Homicides per 100K people in 2020: 9.0 — 37th highest of 211 metros
> 1-yr. change in all violent crime per 100K people: +59.4 — 36th highest of 209 metros
> Violent crimes per 100K people in 2020: 583.4 — 30th highest of 210 metros
> Population: 99,386

25. Crestview-Fort Walton Beach-Destin, FL
> 1-yr. change in reported homicides per 100K people: -1.2
> Homicides reported in 2020: 10 — 86th lowest of 211 metros (tied)
> Homicides per 100K people in 2020: 3.4 — 70th lowest of 211 metros
> 1-yr. change in all violent crime per 100K people: -44.3 — 11th lowest of 209 metros
> Violent crimes per 100K people in 2020: 268.9 — 67th lowest of 210 metros
> Population: 284,809
[in-text-ad]

24. Bloomington, IL
> 1-yr. change in reported homicides per 100K people: -1.2
> Homicides reported in 2020: 1 — 6th lowest of 211 metros (tied)
> Homicides per 100K people in 2020: 0.6 — 7th lowest of 211 metros
> 1-yr. change in all violent crime per 100K people: -71.0 — 5th lowest of 209 metros
> Violent crimes per 100K people in 2020: 282.8 — 73rd lowest of 210 metros
> Population: 171,517
[recirclink id=1038777]

23. Eau Claire, WI
> 1-yr. change in reported homicides per 100K people: -1.2
> Homicides reported in 2020: 3 — 20th lowest of 211 metros (tied)
> Homicides per 100K people in 2020: 1.8 — 27th lowest of 211 metros
> 1-yr. change in all violent crime per 100K people: -22.6 — 33rd lowest of 209 metros
> Violent crimes per 100K people in 2020: 191.7 — 29th lowest of 210 metros
> Population: 169,304

22. Grand Island, NE
> 1-yr. change in reported homicides per 100K people: -1.3
> Homicides reported in 2020: 0 reported — the lowest of 211 metros (tied)
> Homicides per 100K people in 2020: 0.0 reported — the lowest of 211 metros (tied)
> 1-yr. change in all violent crime per 100K people: -35.2 — 18th lowest of 209 metros
> Violent crimes per 100K people in 2020: 340.5 — 98th lowest of 210 metros
> Population: 75,553
[in-text-ad-2]

21. Burlington, NC
> 1-yr. change in reported homicides per 100K people: -1.3
> Homicides reported in 2020: 12 — 95th lowest of 211 metros (tied)
> Homicides per 100K people in 2020: 7.0 — 63rd highest of 211 metros
> 1-yr. change in all violent crime per 100K people: +70.1 — 27th highest of 209 metros
> Violent crimes per 100K people in 2020: 477.7 — 52nd highest of 210 metros
> Population: 169,509

20. Morristown, TN
> 1-yr. change in reported homicides per 100K people: -1.4
> Homicides reported in 2020: 2 — 15th lowest of 211 metros (tied)
> Homicides per 100K people in 2020: 1.4 — 19th lowest of 211 metros
> 1-yr. change in all violent crime per 100K people: -25.8 — 26th lowest of 209 metros
> Violent crimes per 100K people in 2020: 361.9 — 102nd highest of 210 metros
> Population: 142,749
[in-text-ad]

19. Manchester-Nashua, NH
> 1-yr. change in reported homicides per 100K people: -1.4
> Homicides reported in 2020: 5 — 41st lowest of 211 metros (tied)
> Homicides per 100K people in 2020: 1.2 — 15th lowest of 211 metros
> 1-yr. change in all violent crime per 100K people: -12.1 — 44th lowest of 209 metros
> Violent crimes per 100K people in 2020: 217.7 — 40th lowest of 210 metros
> Population: 417,025
[recirclink id=1016354]
18. The Villages, FL
> 1-yr. change in reported homicides per 100K people: -1.6
> Homicides reported in 2020: 3 — 20th lowest of 211 metros (tied)
> Homicides per 100K people in 2020: 2.2 — 37th lowest of 211 metros
> 1-yr. change in all violent crime per 100K people: +16.1 — 98th highest of 209 metros
> Violent crimes per 100K people in 2020: 203.5 — 36th lowest of 210 metros
> Population: 132,420

17. Jonesboro, AR
> 1-yr. change in reported homicides per 100K people: -1.6
> Homicides reported in 2020: 13 — 101st lowest of 211 metros (tied)
> Homicides per 100K people in 2020: 9.6 — 30th highest of 211 metros
> 1-yr. change in all violent crime per 100K people: +103.6 — 17th highest of 209 metros
> Violent crimes per 100K people in 2020: 659.6 — 23rd highest of 210 metros
> Population: 133,860
[in-text-ad-2]

16. Owensboro, KY
> 1-yr. change in reported homicides per 100K people: -1.7
> Homicides reported in 2020: 6 — 53rd lowest of 211 metros (tied)
> Homicides per 100K people in 2020: 5.0 — 104th lowest of 211 metros
> 1-yr. change in all violent crime per 100K people: +31.0 — 69th highest of 209 metros
> Violent crimes per 100K people in 2020: 164.4 — 15th lowest of 210 metros
> Population: 121,128

15. Peoria, IL
> 1-yr. change in reported homicides per 100K people: -1.7
> Homicides reported in 2020: 23 — 70th highest of 211 metros (tied)
> Homicides per 100K people in 2020: 5.8 — 87th highest of 211 metros
> 1-yr. change in all violent crime per 100K people: -26.3 — 25th lowest of 209 metros
> Violent crimes per 100K people in 2020: 425.7 — 73rd highest of 210 metros
> Population: 400,912
[in-text-ad]

14. Bellingham, WA
> 1-yr. change in reported homicides per 100K people: -1.8
> Homicides reported in 2020: 5 — 41st lowest of 211 metros (tied)
> Homicides per 100K people in 2020: 2.2 — 36th lowest of 211 metros
> 1-yr. change in all violent crime per 100K people: -35.4 — 17th lowest of 209 metros
> Violent crimes per 100K people in 2020: 184.7 — 23rd lowest of 210 metros
> Population: 229,247
[recirclink id=1011842]
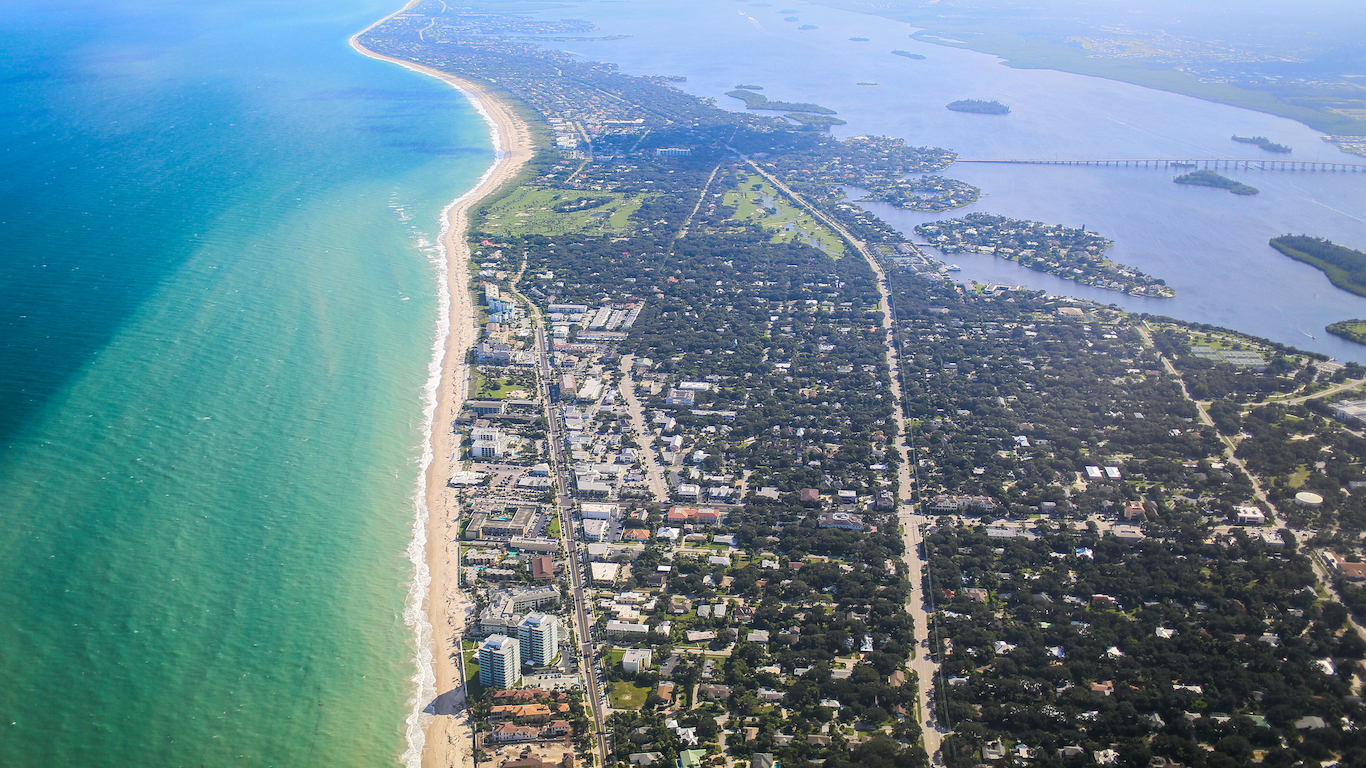
13. Sebastian-Vero Beach, FL
> 1-yr. change in reported homicides per 100K people: -1.9
> Homicides reported in 2020: 3 — 20th lowest of 211 metros (tied)
> Homicides per 100K people in 2020: 1.9 — 32nd lowest of 211 metros
> 1-yr. change in all violent crime per 100K people: -86.5 — 4th lowest of 209 metros
> Violent crimes per 100K people in 2020: 135.1 — 4th lowest of 210 metros
> Population: 159,923

12. Yuma, AZ
> 1-yr. change in reported homicides per 100K people: -2.0
> Homicides reported in 2020: 20 — 80th highest of 211 metros (tied)
> Homicides per 100K people in 2020: 9.2 — 33rd highest of 211 metros
> 1-yr. change in all violent crime per 100K people: +52.9 — 42nd highest of 209 metros
> Violent crimes per 100K people in 2020: 330.7 — 92nd lowest of 210 metros
> Population: 213,787
[in-text-ad-2]

11. Jackson, TN
> 1-yr. change in reported homicides per 100K people: -2.3
> Homicides reported in 2020: 17 — 89th highest of 211 metros (tied)
> Homicides per 100K people in 2020: 9.5 — 31st highest of 211 metros
> 1-yr. change in all violent crime per 100K people: +11.0 — 97th lowest of 209 metros
> Violent crimes per 100K people in 2020: 624.6 — 24th highest of 210 metros
> Population: 178,644

10. Yuba City, CA
> 1-yr. change in reported homicides per 100K people: -2.3
> Homicides reported in 2020: 7 — 63rd lowest of 211 metros (tied)
> Homicides per 100K people in 2020: 4.0 — 84th lowest of 211 metros
> 1-yr. change in all violent crime per 100K people: +39.6 — 59th highest of 209 metros
> Violent crimes per 100K people in 2020: 408.9 — 81st highest of 210 metros
> Population: 175,639
[in-text-ad]

9. Longview, WA
> 1-yr. change in reported homicides per 100K people: -2.8
> Homicides reported in 2020: 2 — 15th lowest of 211 metros (tied)
> Homicides per 100K people in 2020: 1.8 — 28th lowest of 211 metros
> 1-yr. change in all violent crime per 100K people: -7.5 — 58th lowest of 209 metros
> Violent crimes per 100K people in 2020: 187.1 — 26th lowest of 210 metros
> Population: 110,593
[recirclink id=984954]

8. Sebring-Avon Park, FL
> 1-yr. change in reported homicides per 100K people: -2.9
> Homicides reported in 2020: 8 — 70th lowest of 211 metros (tied)
> Homicides per 100K people in 2020: 7.5 — 55th highest of 211 metros
> 1-yr. change in all violent crime per 100K people: +11.9 — 99th lowest of 209 metros
> Violent crimes per 100K people in 2020: 277.2 — 72nd lowest of 210 metros
> Population: 106,221

7. Walla Walla, WA
> 1-yr. change in reported homicides per 100K people: -3.3
> Homicides reported in 2020: 1 — 6th lowest of 211 metros (tied)
> Homicides per 100K people in 2020: 1.6 — 25th lowest of 211 metros
> 1-yr. change in all violent crime per 100K people: -25.6 — 27th lowest of 209 metros
> Violent crimes per 100K people in 2020: 212.3 — 38th lowest of 210 metros
> Population: 60,760
[in-text-ad-2]
6. Ocala, FL
> 1-yr. change in reported homicides per 100K people: -3.4
> Homicides reported in 2020: 19 — 84th highest of 211 metros (tied)
> Homicides per 100K people in 2020: 5.2 — 105th highest of 211 metros
> 1-yr. change in all violent crime per 100K people: -8.4 — 51st lowest of 209 metros
> Violent crimes per 100K people in 2020: 422.5 — 75th highest of 210 metros
> Population: 365,579

5. Grand Junction, CO
> 1-yr. change in reported homicides per 100K people: -3.9
> Homicides reported in 2020: 3 — 20th lowest of 211 metros (tied)
> Homicides per 100K people in 2020: 1.9 — 34th lowest of 211 metros
> 1-yr. change in all violent crime per 100K people: +83.1 — 22nd highest of 209 metros
> Violent crimes per 100K people in 2020: 366.6 — 96th highest of 210 metros
> Population: 154,210
[in-text-ad]

4. Muskegon, MI
> 1-yr. change in reported homicides per 100K people: -4.0
> Homicides reported in 2020: 10 — 86th lowest of 211 metros (tied)
> Homicides per 100K people in 2020: 5.8 — 88th highest of 211 metros
> 1-yr. change in all violent crime per 100K people: -41.1 — 15th lowest of 209 metros
> Violent crimes per 100K people in 2020: 412.3 — 80th highest of 210 metros
> Population: 173,566
[recirclink id=1055273]

3. Pine Bluff, AR
> 1-yr. change in reported homicides per 100K people: -4.1
> Homicides reported in 2020: 24 — 67th highest of 211 metros (tied)
> Homicides per 100K people in 2020: 27.7 — the highest of 211 metros
> 1-yr. change in all violent crime per 100K people: +202.4 — 2nd highest of 209 metros
> Violent crimes per 100K people in 2020: 1,097.8 — 3rd highest of 210 metros
> Population: 89,437

2. Spartanburg, SC
> 1-yr. change in reported homicides per 100K people: -4.5
> Homicides reported in 2020: 9 — 77th lowest of 211 metros (tied)
> Homicides per 100K people in 2020: 2.8 — 51st lowest of 211 metros
> 1-yr. change in all violent crime per 100K people: +3.6 — 85th lowest of 209 metros
> Violent crimes per 100K people in 2020: 506.6 — 42nd highest of 210 metros
> Population: 319,785
[in-text-ad-2]

1. Anchorage, AK
> 1-yr. change in reported homicides per 100K people: -5.2
> Homicides reported in 2020: 18 — 86th highest of 211 metros (tied)
> Homicides per 100K people in 2020: 5.9 — 84th highest of 211 metros
> 1-yr. change in all violent crime per 100K people: -23.1 — 32nd lowest of 209 metros
> Violent crimes per 100K people in 2020: 1,171.5 — 2nd highest of 210 metros
> Population: 396,317
Methodology
To determine the metro areas where the murder rate is falling, 24/7 Wall St. reviewed the change in murder rate per 100,000 people from the FBI’s 2019 and 2020 Uniform Crime Reports.
Limited data was available in the 2020 UCR for areas in Alabama, Maryland, Pennsylvania, and Illinois, though metro areas in these states were not excluded from analysis. Only metro areas for which the boundaries defined by the FBI match the boundaries as defined by the U.S. Census Bureau were considered. Because some state and local agencies changed reporting practices between 2019 and 2020, the figures are not comparable, and the areas were excluded.
Population figures are one-year estimates from the U.S. Census Bureau’s 2019 American Community Survey. However, these estimates were not used to calculate crime rates. Crime rates per 100,000 people were calculated using population figures provided by the FBI in the 2020 and 2019 UCR.
Contact [email protected] for any questions or corrections.