
The COVID-19 pandemic upended just about every aspect of everyday life. Seemingly within the blink of an eye in March 2020, schools and businesses shut down, social distancing became de rigueur, many people began working remotely, and we shifted our focus to “flattening the curve.” With this upheaval, some people began rethinking their living situation and decided to relocate.
To identify metro areas that shrunk the most in the last year, 24/7 Wall St. reviewed population change data from the U.S. Census Bureau. We ranked all U.S. metro areas on the percent change in residents from July 1, 2020 to July 1, 2021. The population of the fastest shrinking metros declined anywhere from 0.5% to 5.3% during the pandemic. (See also: The 16 states where the population shrank since the pandemic started.)
The components of population change are net migration – the number of people who moved to a given metro area less the number of people who move out – and natural population change, which is the number of births less the number of deaths. (Due to margins of error in census estimates, the raw population change number is close to, but not precisely equal to, the sum of net migration and natural population change.)
People decide to move for a wide variety of reasons. Some are simply looking to upgrade to a nicer house or apartment. Some start a new job. Some grow their family. Some move in order to send their kids to better schools or to escape to a more hospitable climate.
From March to November 2020, at the height of the pandemic, about 5% of Americans moved either permanently or temporarily, according to a study by the Pew Research Center. A full third of those people moved for financial reasons, 17% moved to be near family or a partner, and 14% moved to a place with a lower coronavirus risk.
During the first year of the pandemic, it might have seemed as if lots of people moved, but in reality, overall moves plummeted to the lowest levels since 1947, with only 8.2% of residents moving, down from 9.0% the year before, according to Census Bureau data. The percentage of people who move has actually been consistently declining since the 1960s, when about one-fifth of Americans changed residences annually.
Quite a few of the metro areas on this list are among the very large, highly densely-populated, and most expensive (for housing and general cost of living) metropolitans. The Los Angeles, New York, San Jose, San Francisco, Chicago, Pittsburgh, New Orleans, Boston, and Miami metro areas are all in the list. Some also happen to be on the list: the most expensive metro to buy a home in every state.
Click here to these metro areas shrunk the most in the last year

50. Utica-Rome, NY
> Net population change, 2020-2021: -0.5% (-1,491 people)
> Net change from migration: -766 people
> Natural population change: -761
> Total population, 2021: 290,211
[in-text-ad]

49. Dubuque, IA
> Net population change, 2020-2021: -0.5% (-511 people)
> Net change from migration: -530 people
> Natural population change: +12
> Total population, 2021: 98,718
[recirclink id=1056694]

48. Erie, PA
> Net population change, 2020-2021: -0.5% (-1,416 people)
> Net change from migration: -619 people
> Natural population change: -842
> Total population, 2021: 269,011

47. Sumter, SC
> Net population change, 2020-2021: -0.5% (-728 people)
> Net change from migration: -548 people
> Natural population change: -187
> Total population, 2021: 135,782
[in-text-ad-2]

46. Binghamton, NY
> Net population change, 2020-2021: -0.5% (-1,334 people)
> Net change from migration: -695 people
> Natural population change: -683
> Total population, 2021: 245,220

45. San Angelo, TX
> Net population change, 2020-2021: -0.5% (-666 people)
> Net change from migration: -890 people
> Natural population change: +223
> Total population, 2021: 122,344
[in-text-ad]

44. Parkersburg-Vienna, WV
> Net population change, 2020-2021: -0.6% (-492 people)
> Net change from migration: -46 people
> Natural population change: -462
> Total population, 2021: 88,687
[recirclink id=1041933]

43. Alexandria, LA
> Net population change, 2020-2021: -0.6% (-846 people)
> Net change from migration: -665 people
> Natural population change: -201
> Total population, 2021: 150,890

42. Rockford, IL
> Net population change, 2020-2021: -0.6% (-1,906 people)
> Net change from migration: -1,828 people
> Natural population change: -121
> Total population, 2021: 336,278
[in-text-ad-2]

41. Miami-Fort Lauderdale-Pompano Beach, FL
> Net population change, 2020-2021: -0.6% (-34,694 people)
> Net change from migration: -32,541 people
> Natural population change: -2,111
> Total population, 2021: 6,091,747

40. Jackson, MS
> Net population change, 2020-2021: -0.6% (-3,424 people)
> Net change from migration: -3,571 people
> Natural population change: +141
> Total population, 2021: 587,202
[in-text-ad]

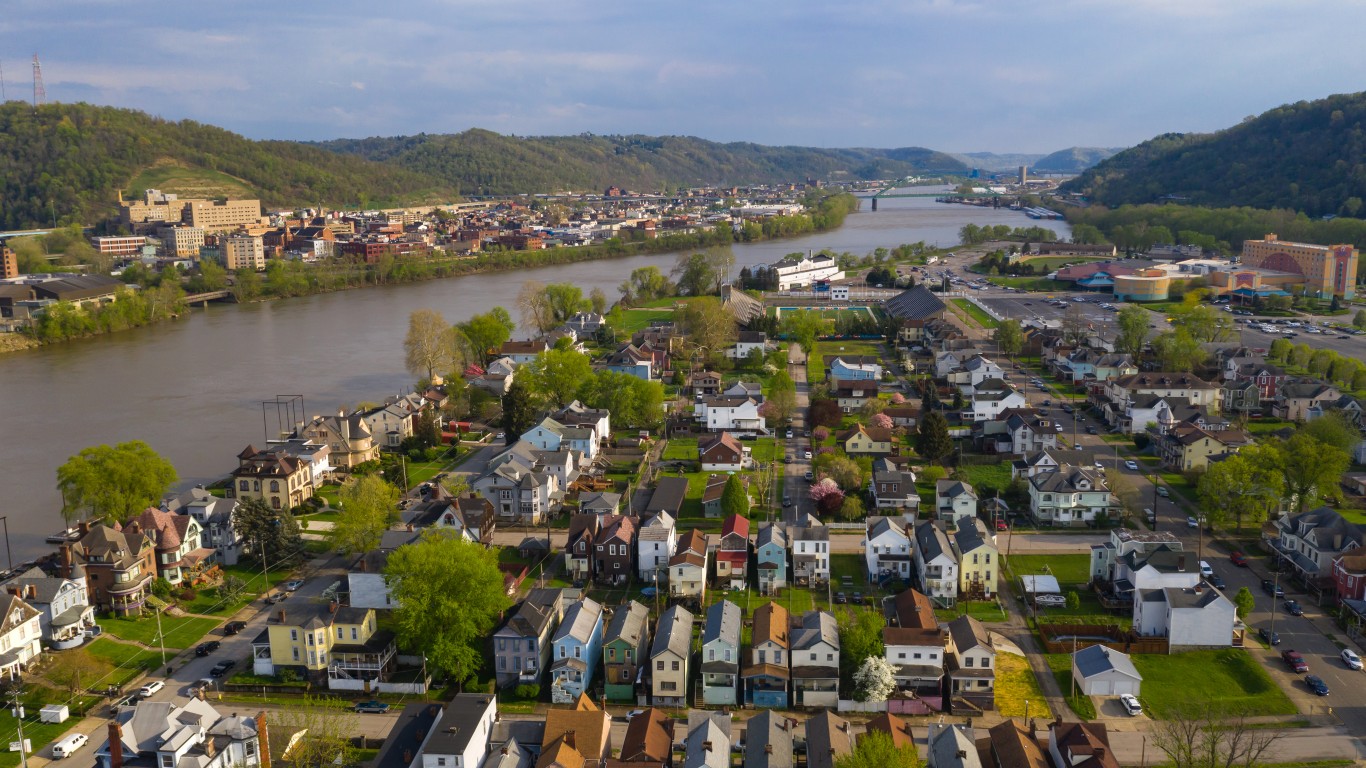
39. Pittsburgh, PA
> Net population change, 2020-2021: -0.6% (-13,755 people)
> Net change from migration: -3,128 people
> Natural population change: -10,838
> Total population, 2021: 2,353,538
[recirclink id=1041475]

38. Bay City, MI
> Net population change, 2020-2021: -0.6% (-609 people)
> Net change from migration: +19 people
> Natural population change: -646
> Total population, 2021: 102,985

37. Kankakee, IL
> Net population change, 2020-2021: -0.6% (-635 people)
> Net change from migration: -491 people
> Natural population change: -159
> Total population, 2021: 106,601
[in-text-ad-2]

36. Johnstown, PA
> Net population change, 2020-2021: -0.6% (-790 people)
> Net change from migration: +116 people
> Natural population change: -922
> Total population, 2021: 132,167

35. Ann Arbor, MI
> Net population change, 2020-2021: -0.6% (-2,266 people)
> Net change from migration: -2,644 people
> Natural population change: +347
> Total population, 2021: 369,390
[in-text-ad]

34. Altoona, PA
> Net population change, 2020-2021: -0.6% (-751 people)
> Net change from migration: -72 people
> Natural population change: -701
> Total population, 2021: 121,767
[recirclink id=1032143]

33. St. Joseph, MO-KS
> Net population change, 2020-2021: -0.6% (-757 people)
> Net change from migration: -625 people
> Natural population change: -138
> Total population, 2021: 120,424

32. Grand Forks, ND-MN
> Net population change, 2020-2021: -0.6% (-651 people)
> Net change from migration: -894 people
> Natural population change: +237
> Total population, 2021: 103,462
[in-text-ad-2]

31. Niles, MI
> Net population change, 2020-2021: -0.6% (-994 people)
> Net change from migration: -546 people
> Natural population change: -463
> Total population, 2021: 153,101

30. Springfield, IL
> Net population change, 2020-2021: -0.7% (-1,379 people)
> Net change from migration: -906 people
> Natural population change: -504
> Total population, 2021: 206,898
[in-text-ad]

29. New Orleans-Metairie, LA
> Net population change, 2020-2021: -0.7% (-8,640 people)
> Net change from migration: -8,583 people
> Natural population change: +96
> Total population, 2021: 1,261,726
[recirclink id=1060074]

28. Huntington-Ashland, WV-KY-OH
> Net population change, 2020-2021: -0.7% (-2,519 people)
> Net change from migration: -751 people
> Natural population change: -1,817
> Total population, 2021: 356,581

27. Peoria, IL
> Net population change, 2020-2021: -0.7% (-2,936 people)
> Net change from migration: -2,295 people
> Natural population change: -671
> Total population, 2021: 398,224
[in-text-ad-2]

26. Boston-Cambridge-Newton, MA-NH
> Net population change, 2020-2021: -0.7% (-36,579 people)
> Net change from migration: -37,535 people
> Natural population change: +1,036
> Total population, 2021: 4,899,932

25. Monroe, LA
> Net population change, 2020-2021: -0.8% (-1,673 people)
> Net change from migration: -1,409 people
> Natural population change: -281
> Total population, 2021: 204,884
[in-text-ad]

24. Casper, WY
> Net population change, 2020-2021: -0.8% (-674 people)
> Net change from migration: -650 people
> Natural population change: -29
> Total population, 2021: 79,555
[recirclink id=1056694]

23. Chico, CA
> Net population change, 2020-2021: -0.8% (-1,774 people)
> Net change from migration: -1,439 people
> Natural population change: -361
> Total population, 2021: 208,309
22. Shreveport-Bossier City, LA
> Net population change, 2020-2021: -0.9% (-3,370 people)
> Net change from migration: -3,180 people
> Natural population change: -189
> Total population, 2021: 389,155
[in-text-ad-2]
21. Wheeling, WV-OH
> Net population change, 2020-2021: -0.9% (-1,203 people)
> Net change from migration: -269 people
> Natural population change: -954
> Total population, 2021: 137,740

20. Weirton-Steubenville, WV-OH
> Net population change, 2020-2021: -0.9% (-1,010 people)
> Net change from migration: -169 people
> Natural population change: -856
> Total population, 2021: 115,585
[in-text-ad]

19. Beckley, WV
> Net population change, 2020-2021: -0.9% (-1,009 people)
> Net change from migration: -85 people
> Natural population change: -941
> Total population, 2021: 113,698
[recirclink id=1041933]

18. Grand Island, NE
> Net population change, 2020-2021: -0.9% (-710 people)
> Net change from migration: -854 people
> Natural population change: +151
> Total population, 2021: 76,175

17. Pine Bluff, AR
> Net population change, 2020-2021: -0.9% (-822 people)
> Net change from migration: -541 people
> Natural population change: -281
> Total population, 2021: 86,412
[in-text-ad-2]

16. Santa Cruz-Watsonville, CA
> Net population change, 2020-2021: -0.9% (-2,561 people)
> Net change from migration: -2,602 people
> Natural population change: +32
> Total population, 2021: 267,792

15. Chicago-Naperville-Elgin, IL-IN-WI
> Net population change, 2020-2021: -1.0% (-91,671 people)
> Net change from migration: -102,613 people
> Natural population change: +11,138
> Total population, 2021: 9,509,934
[in-text-ad]

14. Elmira, NY
> Net population change, 2020-2021: -1.0% (-837 people)
> Net change from migration: -491 people
> Natural population change: -354
> Total population, 2021: 83,045
[recirclink id=1041475]

13. Napa, CA
> Net population change, 2020-2021: -1.0% (-1,401 people)
> Net change from migration: -1,222 people
> Natural population change: -185
> Total population, 2021: 136,207

12. Danville, IL
> Net population change, 2020-2021: -1.1% (-788 people)
> Net change from migration: -559 people
> Natural population change: -230
> Total population, 2021: 73,095
[in-text-ad-2]

11. Charleston, WV
> Net population change, 2020-2021: -1.1% (-2,820 people)
> Net change from migration: -1,058 people
> Natural population change: -1,780
> Total population, 2021: 255,020

10. Enid, OK
> Net population change, 2020-2021: -1.1% (-703 people)
> Net change from migration: -691 people
> Natural population change: -13
> Total population, 2021: 61,926
[in-text-ad]

9. Decatur, IL
> Net population change, 2020-2021: -1.2% (-1,215 people)
> Net change from migration: -976 people
> Natural population change: -239
> Total population, 2021: 102,432
[recirclink id=1032143]

8. Urban Honolulu, HI
> Net population change, 2020-2021: -1.2% (-12,337 people)
> Net change from migration: -13,686 people
> Natural population change: +1,468
> Total population, 2021: 1,000,890

7. Midland, TX
> Net population change, 2020-2021: -1.3% (-2,291 people)
> Net change from migration: -3,763 people
> Natural population change: +1,507
> Total population, 2021: 173,180
[in-text-ad-2]

6. Los Angeles-Long Beach-Anaheim, CA
> Net population change, 2020-2021: -1.3% (-175,913 people)
> Net change from migration: -199,539 people
> Natural population change: +24,605
> Total population, 2021: 12,997,353

5. New York-Newark-Jersey City, NY-NJ-PA
> Net population change, 2020-2021: -1.6% (-327,955 people)
> Net change from migration: -361,774 people
> Natural population change: +38,347
> Total population, 2021: 19,768,458
[in-text-ad]

4. San Jose-Sunnyvale-Santa Clara, CA
> Net population change, 2020-2021: -2.2% (-42,920 people)
> Net change from migration: -49,412 people
> Natural population change: +7,204
> Total population, 2021: 1,952,185
[recirclink id=1060074]

3. San Francisco-Oakland-Berkeley, CA
> Net population change, 2020-2021: -2.5% (-116,385 people)
> Net change from migration: -123,885 people
> Natural population change: +9,052
> Total population, 2021: 4,623,264

2. Odessa, TX
> Net population change, 2020-2021: -2.6% (-4,376 people)
> Net change from migration: -5,878 people
> Natural population change: +1,592
> Total population, 2021: 161,091
[in-text-ad-2]

1. Lake Charles, LA
> Net population change, 2020-2021: -5.3% (-11,673 people)
> Net change from migration: -11,824 people
> Natural population change: +362
> Total population, 2021: 210,362
Contact [email protected] for any questions or corrections.