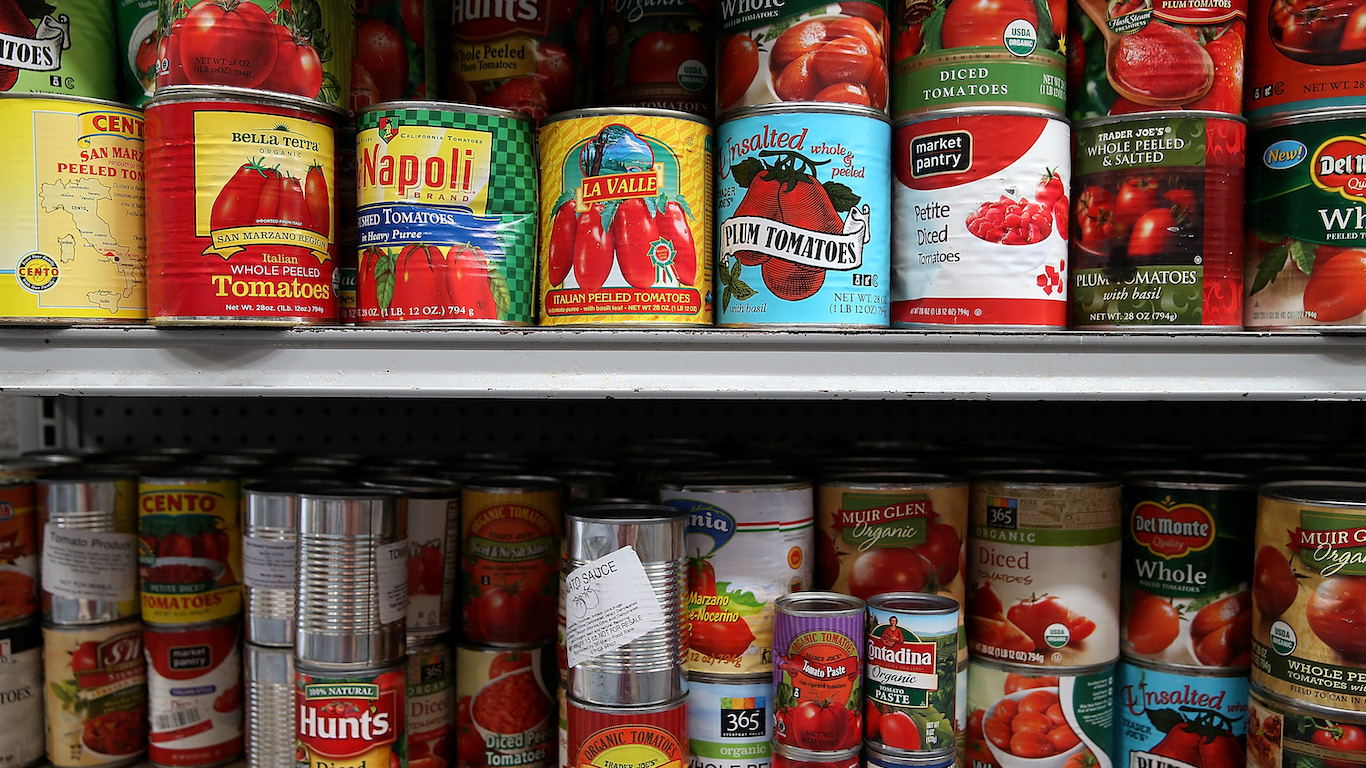
Inflation is surging in the United States – in large part because of rising food prices. In cities across the country, food today is 8% more expensive on average than it was a year ago, and consumers are feeling the pinch.
According to the Economic Policy Institute, a nonprofit think tank, a single adult can expect to pay an estimated $3,404 on food in 2022. This amount varies across the country, however. In some states food costs are far lower than the national average, while in others, Americans are paying thousands more. Here is a look at the countries with the most and least affordable groceries.
Using data from the EPI’s Family Budget Calculator, 24/7 Wall St. identified the states where Americans pay the most for food. States are ranked on estimated food expenditure in 2022, assuming a nutritionally adequate diet for a single adult where almost all food is bought at a grocery store and prepared at home.
Depending on the state, food costs range from less than $3,000 a year to over $5,000. Most of the states with the highest food costs are in the Northeast, while the states with the lowest food cost estimates are concentrated in the Midwest. This variation in cost is partially a reflection of what residents can afford, as states with higher food costs also often have higher than average household incomes, and vice-versa. Here is a look at the income needed to be middle class in each state.
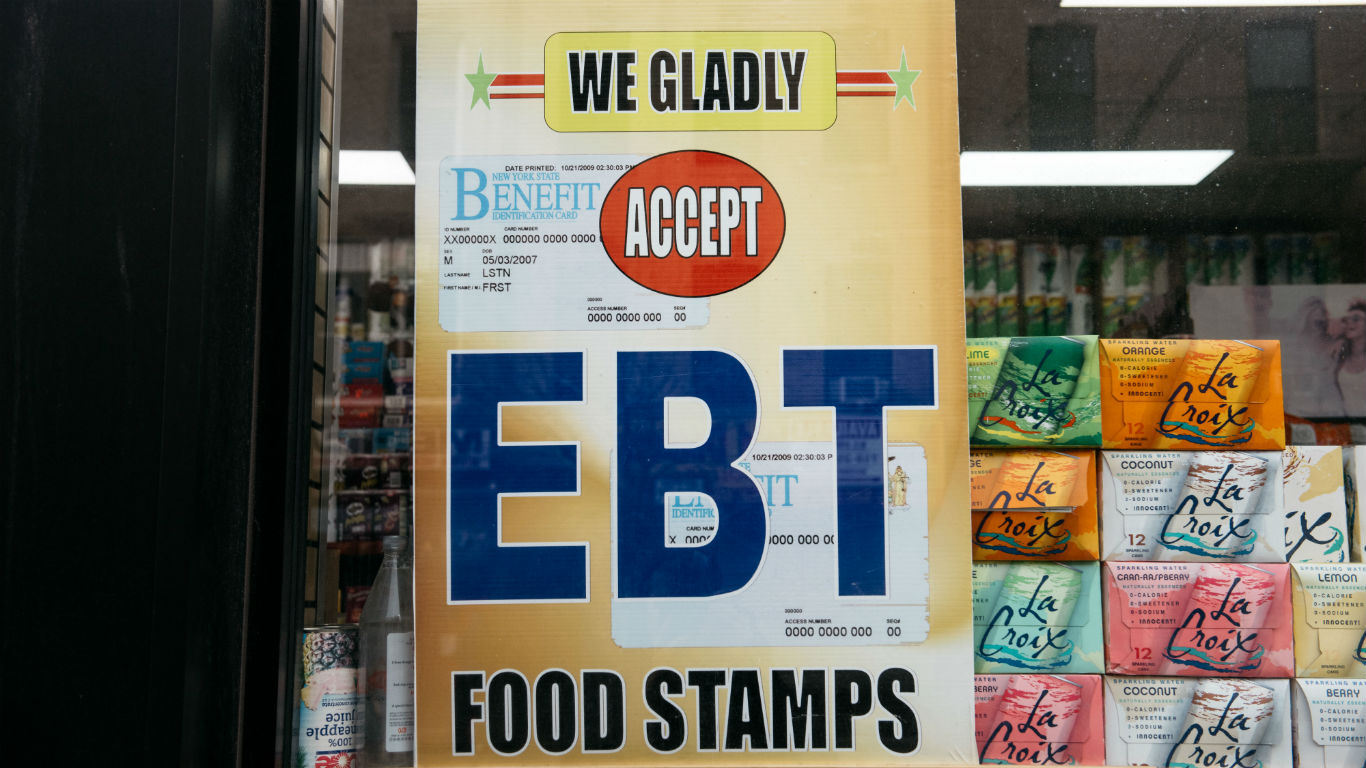
It is important to note that food costs do not vary as much from state to state as income does, and partially as a result, households in states with relatively high food prices are not necessarily more likely to receive government assistance in the form of SNAP benefits or food stamps. Additionally, residents of states with high food costs are typically less likely to experience food insecurity – defined as not always being able to afford or otherwise access well-balanced meals – suggesting that higher incomes tend to offset high food costs.
Click here to see the states where single people pay the most for food
Click here to read our detailed methodology

50. Kentucky
> Est. annual food costs: $2,951
> Median household income: $52,238 (7th lowest)
> Food stamp recipiency rate: 13.6% (11th highest)
> Food insecurity rate: 5.6% (21st lowest)
[in-text-ad]

49. Indiana
> Est. annual food costs: $2,957
> Median household income: $58,235 (16th lowest)
> Food stamp recipiency rate: 9.8% (12th lowest)
> Food insecurity rate: 6.9% (21st highest)
[recirclink id=1066858]

48. West Virginia
> Est. annual food costs: $2,988
> Median household income: $48,037 (2nd lowest)
> Food stamp recipiency rate: 17.1% (2nd highest)
> Food insecurity rate: 6.6% (25th highest)

47. Texas
> Est. annual food costs: $2,997
> Median household income: $63,826 (21st highest)
> Food stamp recipiency rate: 12.1% (25th highest)
> Food insecurity rate: 8.7% (10th highest)
[in-text-ad-2]

46. Arkansas
> Est. annual food costs: $3,058
> Median household income: $49,475 (3rd lowest)
> Food stamp recipiency rate: 12.2% (24th highest)
> Food insecurity rate: 8.7% (8th highest)

45. Iowa
> Est. annual food costs: $3,075
> Median household income: $61,836 (24th lowest)
> Food stamp recipiency rate: 10.6% (16th lowest)
> Food insecurity rate: 5.6% (20th lowest)
[in-text-ad]

44. Ohio
> Est. annual food costs: $3,081
> Median household income: $58,116 (15th lowest)
> Food stamp recipiency rate: 13.3% (15th highest)
> Food insecurity rate: 6.8% (23rd highest)
[recirclink id=1067232]

43. Michigan
> Est. annual food costs: $3,135
> Median household income: $59,234 (18th lowest)
> Food stamp recipiency rate: 13.5% (12th highest)
> Food insecurity rate: 6.3% (25th lowest)

42. Wisconsin
> Est. annual food costs: $3,135
> Median household income: $63,293 (24th highest)
> Food stamp recipiency rate: 10.9% (18th lowest)
> Food insecurity rate: 4.8% (14th lowest)
[in-text-ad-2]

41. Nebraska
> Est. annual food costs: $3,143
> Median household income: $63,015 (25th highest)
> Food stamp recipiency rate: 8.7% (9th lowest)
> Food insecurity rate: 5.6% (23rd lowest)

40. South Carolina
> Est. annual food costs: $3,144
> Median household income: $54,864 (10th lowest)
> Food stamp recipiency rate: 11.7% (23rd lowest)
> Food insecurity rate: 9.1% (6th highest)
[in-text-ad]

39. Missouri
> Est. annual food costs: $3,150
> Median household income: $57,290 (13th lowest)
> Food stamp recipiency rate: 11.1% (19th lowest)
> Food insecurity rate: 6.8% (22nd highest)
[recirclink id=1068988]

38. Oklahoma
> Est. annual food costs: $3,192
> Median household income: $53,840 (8th lowest)
> Food stamp recipiency rate: 13.4% (14th highest)
> Food insecurity rate: 8.6% (11th highest)

37. Utah
> Est. annual food costs: $3,197
> Median household income: $74,197 (12th highest)
> Food stamp recipiency rate: 6.9% (2nd lowest)
> Food insecurity rate: 5.8% (24th lowest)
[in-text-ad-2]

36. North Carolina
> Est. annual food costs: $3,207
> Median household income: $56,642 (12th lowest)
> Food stamp recipiency rate: 12.5% (22nd highest)
> Food insecurity rate: 6.7% (24th highest)

35. Illinois
> Est. annual food costs: $3,209
> Median household income: $68,428 (17th highest)
> Food stamp recipiency rate: 13.1% (16th highest)
> Food insecurity rate: 4.5% (10th lowest)
[in-text-ad]

34. New Mexico
> Est. annual food costs: $3,217
> Median household income: $51,243 (5th lowest)
> Food stamp recipiency rate: 17.7% (the highest)
> Food insecurity rate: 14.0% (the highest)
[recirclink id=1074786]

33. Arizona
> Est. annual food costs: $3,231
> Median household income: $61,529 (23rd lowest)
> Food stamp recipiency rate: 11.2% (20th lowest)
> Food insecurity rate: 7.5% (16th highest)

32. Kansas
> Est. annual food costs: $3,232
> Median household income: $61,091 (21st lowest)
> Food stamp recipiency rate: 7.8% (5th lowest)
> Food insecurity rate: 8.3% (14th highest)
[in-text-ad-2]

31. Mississippi
> Est. annual food costs: $3,236
> Median household income: $46,511 (the lowest)
> Food stamp recipiency rate: 15.2% (7th highest)
> Food insecurity rate: 10.7% (2nd highest)

30. Georgia
> Est. annual food costs: $3,290
> Median household income: $61,224 (22nd lowest)
> Food stamp recipiency rate: 12.8% (19th highest)
> Food insecurity rate: 9.0% (7th highest)
[in-text-ad]

29. South Dakota
> Est. annual food costs: $3,303
> Median household income: $59,896 (20th lowest)
> Food stamp recipiency rate: 9.5% (11th lowest)
> Food insecurity rate: 10.5% (3rd highest)
[recirclink id=1076681]

28. Tennessee
> Est. annual food costs: $3,320
> Median household income: $54,833 (9th lowest)
> Food stamp recipiency rate: 13.1% (17th highest)
> Food insecurity rate: 8.5% (12th highest)

27. Alabama
> Est. annual food costs: $3,333
> Median household income: $52,035 (6th lowest)
> Food stamp recipiency rate: 13.7% (10th highest)
> Food insecurity rate: 7.9% (15th highest)
[in-text-ad-2]

26. Alaska
> Est. annual food costs: $3,344
> Median household income: $77,790 (8th highest)
> Food stamp recipiency rate: 12.9% (18th highest)
> Food insecurity rate: 9.2% (5th highest)

25. Louisiana
> Est. annual food costs: $3,373
> Median household income: $50,800 (4th lowest)
> Food stamp recipiency rate: 15.8% (5th highest)
> Food insecurity rate: 9.5% (4th highest)
[in-text-ad]

24. Montana
> Est. annual food costs: $3,385
> Median household income: $56,539 (11th lowest)
> Food stamp recipiency rate: 10.1% (14th lowest)
> Food insecurity rate: 8.3% (13th highest)
[recirclink id=1066858]

23. Idaho
> Est. annual food costs: $3,386
> Median household income: $58,915 (17th lowest)
> Food stamp recipiency rate: 10.0% (13th lowest)
> Food insecurity rate: 7.1% (18th highest)

22. North Dakota
> Est. annual food costs: $3,399
> Median household income: $65,315 (19th highest)
> Food stamp recipiency rate: 7.3% (3rd lowest)
> Food insecurity rate: 7.0% (19th highest)
[in-text-ad-2]

21. Pennsylvania
> Est. annual food costs: $3,427
> Median household income: $63,627 (22nd highest)
> Food stamp recipiency rate: 13.9% (8th highest)
> Food insecurity rate: 4.6% (11th lowest)

20. Wyoming
> Est. annual food costs: $3,432
> Median household income: $65,304 (20th highest)
> Food stamp recipiency rate: 5.9% (the lowest)
> Food insecurity rate: 8.7% (9th highest)
[in-text-ad]

19. Minnesota
> Est. annual food costs: $3,438
> Median household income: $73,382 (13th highest)
> Food stamp recipiency rate: 8.4% (7th lowest)
> Food insecurity rate: 5.6% (22nd lowest)
[recirclink id=1067232]

18. Nevada
> Est. annual food costs: $3,457
> Median household income: $62,043 (25th lowest)
> Food stamp recipiency rate: 12.7% (20th highest)
> Food insecurity rate: 5.4% (16th lowest)

17. Virginia
> Est. annual food costs: $3,483
> Median household income: $76,398 (10th highest)
> Food stamp recipiency rate: 8.5% (8th lowest)
> Food insecurity rate: 4.3% (8th lowest)
[in-text-ad-2]

16. Delaware
> Est. annual food costs: $3,519
> Median household income: $69,110 (16th highest)
> Food stamp recipiency rate: 11.5% (22nd lowest)
> Food insecurity rate: 4.7% (12th lowest)

15. Oregon
> Est. annual food costs: $3,521
> Median household income: $65,667 (18th highest)
> Food stamp recipiency rate: 16.0% (3rd highest)
> Food insecurity rate: 5.4% (17th lowest)
[in-text-ad]

14. Maryland
> Est. annual food costs: $3,562
> Median household income: $87,063 (the highest)
> Food stamp recipiency rate: 10.8% (17th lowest)
> Food insecurity rate: 3.4% (4th lowest)
[recirclink id=1068988]

13. Colorado
> Est. annual food costs: $3,593
> Median household income: $75,231 (11th highest)
> Food stamp recipiency rate: 8.0% (6th lowest)
> Food insecurity rate: 5.5% (18th lowest)

12. Florida
> Est. annual food costs: $3,594
> Median household income: $57,703 (14th lowest)
> Food stamp recipiency rate: 13.9% (9th highest)
> Food insecurity rate: 7.2% (17th highest)
[in-text-ad-2]

11. Washington
> Est. annual food costs: $3,642
> Median household income: $77,006 (9th highest)
> Food stamp recipiency rate: 12.0% (25th lowest)
> Food insecurity rate: 5.5% (19th lowest)

10. California
> Est. annual food costs: $3,648
> Median household income: $78,672 (6th highest)
> Food stamp recipiency rate: 10.2% (15th lowest)
> Food insecurity rate: 3.3% (2nd lowest)
[in-text-ad]

9. New Jersey
> Est. annual food costs: $3,720
> Median household income: $85,245 (2nd highest)
> Food stamp recipiency rate: 9.1% (10th lowest)
> Food insecurity rate: 3.6% (5th lowest)
[recirclink id=1074786]

8. New Hampshire
> Est. annual food costs: $3,748
> Median household income: $77,923 (7th highest)
> Food stamp recipiency rate: 7.4% (4th lowest)
> Food insecurity rate: 5.0% (15th lowest)

7. Rhode Island
> Est. annual food costs: $3,749
> Median household income: $70,305 (15th highest)
> Food stamp recipiency rate: 15.9% (4th highest)
> Food insecurity rate: 4.7% (13th lowest)
[in-text-ad-2]

6. Connecticut
> Est. annual food costs: $3,775
> Median household income: $79,855 (5th highest)
> Food stamp recipiency rate: 12.4% (23rd highest)
> Food insecurity rate: 4.3% (9th lowest)

5. New York
> Est. annual food costs: $3,869
> Median household income: $71,117 (14th highest)
> Food stamp recipiency rate: 15.2% (6th highest)
> Food insecurity rate: 2.3% (the lowest)
[in-text-ad]

4. Vermont
> Est. annual food costs: $3,955
> Median household income: $63,477 (23rd highest)
> Food stamp recipiency rate: 11.5% (21st lowest)
> Food insecurity rate: 3.3% (3rd lowest)
[recirclink id=1076681]

3. Maine
> Est. annual food costs: $3,973
> Median household income: $59,489 (19th lowest)
> Food stamp recipiency rate: 13.5% (13th highest)
> Food insecurity rate: 3.8% (6th lowest)

2. Massachusetts
> Est. annual food costs: $4,040
> Median household income: $84,385 (3rd highest)
> Food stamp recipiency rate: 12.5% (21st highest)
> Food insecurity rate: 4.1% (7th lowest)
[in-text-ad-2]

1. Hawaii
> Est. annual food costs: $5,016
> Median household income: $83,173 (4th highest)
> Food stamp recipiency rate: 11.8% (24th lowest)
> Food insecurity rate: 6.9% (20th highest)
Methodology
To determine the states with the highest food costs for a single person, 24/7 Wall St. reviewed data from the Economic Policy Institute’s 2022 Family Budget Calculator.
In the Family Budget Calculator, the EPI estimates the annual food budget necessary for families to maintain a modest yet adequate standard of living. The budgets are created for 10 family types for U.S. counties and metro areas. We used estimates for a single person with no children.
State-level food cost estimates are aggregated from the county level using five-year estimates of total households from the U.S. Census Bureau’s 2020 American Community Survey.
States were ranked based on the EPI’s annual food cost estimates. The food insecurity rate – or the share of the population that lacks adequate access to food – is from the Robert Wood Johnson Foundation and the University of Wisconsin Population Health Institute joint program’s 2021 County Health Rankings & Roadmaps report.
Additional information on median household income and the share of households that receive benefits from the Supplemental Nutrition Assistance Program – formerly known as food stamps – are from the U.S. Census Bureau’s 2020 American Community Survey. Because the Census Bureau did not release one-year estimates for 2020 due to data collection issues caused by the COVID-19 pandemic, all ACS data are five-year estimates.
Contact [email protected] for any questions or corrections.