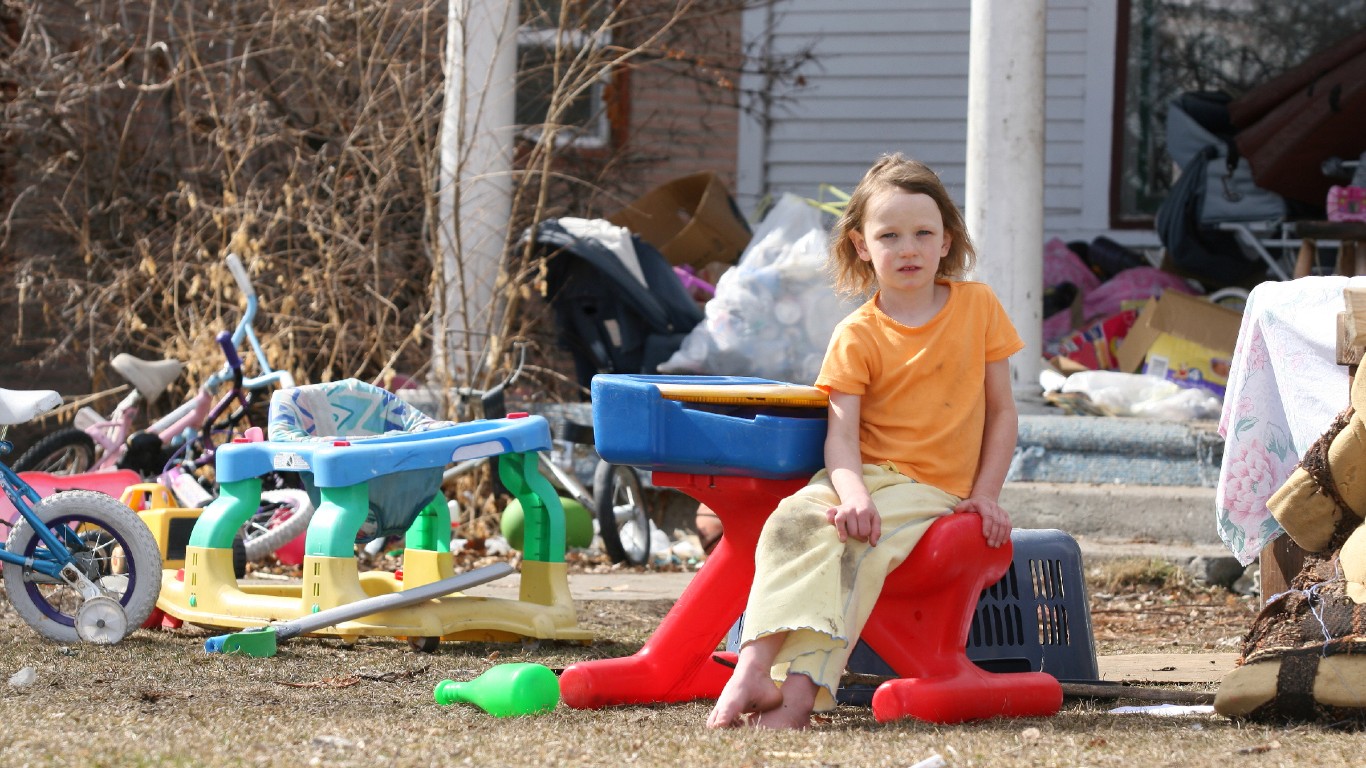
The official poverty rate — the share of Americans whose incomes fall below a certain threshold — is one of the most widely-cited measures of the health of the U.S. economy. Developed in 1963, poverty status is a way of determining eligibility for certain federal assistance programs. While an important measure, the official poverty threshold has flaws, both as a tool for determining eligibility for government subsidies, and as a statistical tool for understanding the prevalence of serious financial hardship in a given area.
The poverty line varies depending on the number of people in a household. The income threshold is $12,140 for an individual and $25,100 for a family of four in the contiguous 48 states.
Perhaps the most significant shortcoming of the official poverty rate is its failure to account for regional differences in cost of living. From New York City to San Francisco, and from Fargo, North Dakota to the Mississippi Delta, the poverty line is the same. Meanwhile, costs of living can vary by as much as 32% from one state to another, and by even more from city to city.
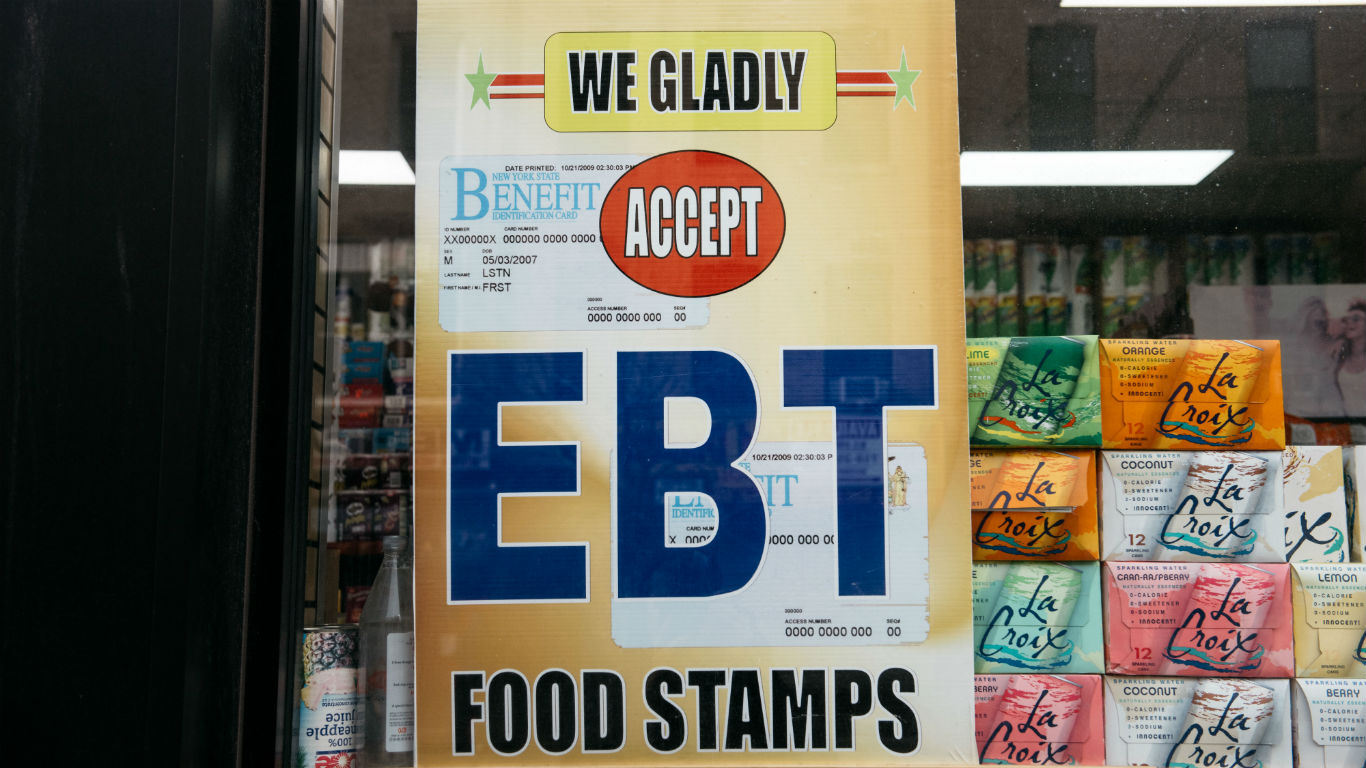
The official poverty rate also does not account for certain government programs intended to help the poor. Such programs include Medicaid, public housing, and SNAP – formerly known as food stamps. The poverty rate is further skewed by not factoring in income from other sources, like capital gains.
First published by the U.S. Census Bureau in 2011, the Supplemental Poverty Measure, or SPM, accounts for these variables and more. For this reason, many argue the SPM is a more accurate way to determine the extent to which Americans in any given region are struggling financially. Not surprisingly, the SPM often tells a very different story than the official poverty rate.
Nationwide, 12.9% of the population, or 41.2 million Americans, live below the poverty line. However, according to the more nuanced SPM, 14.1% of the population, or 45.3 million Americans, are facing serious financial hardship — a difference of 4.1 million people.
24/7 Wall St. calculated the difference between the official poverty rate and the SPM to identify the states where poverty is worse than you think.
In many high-income states with seemingly healthy economies, a far larger share of residents are struggling financially than the official poverty rate suggests. Meanwhile, in states where large shares of residents are living on poverty-level incomes, federal assistance programs appear to be meaningfully reducing financial hardship.

1. California
> Supplemental poverty rate: 19.0% (the highest)
> Official poverty rate: 13.4% (16th highest)
> Cost of living: 14.4% more than national avg. (3rd highest)
> SNAP recipiency: 8.9% (12th lowest)
> Median household income: $71,805 (8th highest)
[in-text-ad]

2. Maryland
> Supplemental poverty rate: 13.6% (19th highest)
> Official poverty rate: 8.2% (2nd lowest)
> Cost of living: 9.5% more than national avg. (5th highest)
> SNAP recipiency: 10.3% (17th lowest)
> Median household income: $80,776 (the highest)
[recirclink id=488456]

3. New Jersey
> Supplemental poverty rate: 15.1% (9th highest)
> Official poverty rate: 9.7% (6th lowest)
> Cost of living: 13.2% more than national avg. (4th highest)
> SNAP recipiency: 8.9% (12th lowest)
> Median household income: $80,088 (2nd highest)

4. Hawaii
> Supplemental poverty rate: 15.0% (10th highest)
> Official poverty rate: 10.2% (11th lowest)
> Cost of living: 18.4% more than national avg. (the highest)
> SNAP recipiency: 10.7% (20th lowest)
> Median household income: $77,765 (3rd highest)
[in-text-ad-2]
5. Florida
> Supplemental poverty rate: 18.1% (2nd highest)
> Official poverty rate: 14.3% (12th highest)
> Cost of living: 0.3% less than national avg. (16th highest)
> SNAP recipiency: 13.6% (10th highest)
> Median household income: $52,594 (12th lowest)

6. Virginia
> Supplemental poverty rate: 14.7% (11th highest)
> Official poverty rate: 10.9% (16th lowest)
> Cost of living: 2.3% more than national avg. (12th highest)
> SNAP recipiency: 8.1% (8th lowest)
> Median household income: $71,535 (9th highest)
[in-text-ad]

7. Connecticut
> Supplemental poverty rate: 12.5% (23rd highest)
> Official poverty rate: 9.9% (8th lowest)
> Cost of living: 8.7% more than national avg. (6th highest)
> SNAP recipiency: 12.0% (23rd highest)
> Median household income: $74,168 (5th highest)
[recirclink id=488594]

8. Massachusetts
> Supplemental poverty rate: 13.1% (21st highest)
> Official poverty rate: 10.6% (14th lowest)
> Cost of living: 7.8% more than national avg. (7th highest)
> SNAP recipiency: 11.7% (25th lowest)
> Median household income: $77,385 (4th highest)

9. New York
> Supplemental poverty rate: 15.5% (7th highest)
> Official poverty rate: 13.2% (19th highest)
> Cost of living: 15.6% more than national avg. (2nd highest)
> SNAP recipiency: 14.8% (7th highest)
> Median household income: $64,894 (14th highest)
[in-text-ad-2]

10. Colorado
> Supplemental poverty rate: 10.9% (17th lowest)
> Official poverty rate: 8.7% (4th lowest)
> Cost of living: 3.0% more than national avg. (11th highest)
> SNAP recipiency: 7.6% (5th lowest)
> Median household income: $69,117 (11th highest)

11. New Hampshire
> Supplemental poverty rate: 8.7% (3rd lowest)
> Official poverty rate: 6.8% (the lowest)
> Cost of living: 5.9% more than national avg. (8th highest)
> SNAP recipiency: 7.0% (4th lowest)
> Median household income: $73,381 (6th highest)
[in-text-ad]

12. Nevada
> Supplemental poverty rate: 13.6% (19th highest)
> Official poverty rate: 12.3% (22nd highest)
> Cost of living: 2.6% less than national avg. (22nd highest)
> SNAP recipiency: 12.2% (22nd highest)
> Median household income: $58,003 (25th lowest)
[recirclink id=488561]

13. Oregon
> Supplemental poverty rate: 12.5% (23rd highest)
> Official poverty rate: 11.3% (22nd lowest)
> Cost of living: 0.2% less than national avg. (15th highest)
> SNAP recipiency: 15.4% (4th highest)
> Median household income: $60,212 (20th highest)

13. Illinois
> Supplemental poverty rate: 12.5% (23rd highest)
> Official poverty rate: 11.3% (22nd lowest)
> Cost of living: 1.1% less than national avg. (18th highest)
> SNAP recipiency: 12.9% (15th highest)
> Median household income: $62,992 (16th highest)
[in-text-ad-2]

15. Delaware
> Supplemental poverty rate: 11.5% (21st lowest)
> Official poverty rate: 10.6% (14th lowest)
> Cost of living: 0.2% more than national avg. (14th highest)
> SNAP recipiency: 10.4% (18th lowest)
> Median household income: $62,852 (17th highest)

16. Texas
> Supplemental poverty rate: 14.7% (11th highest)
> Official poverty rate: 14.0% (13th highest)
> Cost of living: 3.1% less than national avg. (24th highest)
> SNAP recipiency: 12.0% (23rd highest)
> Median household income: $59,206 (23rd highest)
[in-text-ad]

17. Utah
> Supplemental poverty rate: 9.3% (5th lowest)
> Official poverty rate: 8.8% (5th lowest)
> Cost of living: 2.7% less than national avg. (23rd highest)
> SNAP recipiency: 6.8% (3rd lowest)
> Median household income: $68,358 (13th highest)
[recirclink id=488514]

18. Pennsylvania
> Supplemental poverty rate: 11.8% (23rd lowest)
> Official poverty rate: 11.6% (23rd lowest)
> Cost of living: 1.6% less than national avg. (19th highest)
> SNAP recipiency: 12.9% (15th highest)
> Median household income: $59,195 (24th highest)

19. Arizona
> Supplemental poverty rate: 15.6% (5th highest)
> Official poverty rate: 15.5% (9th highest)
> Cost of living: 4.1% less than national avg. (25th lowest)
> SNAP recipiency: 10.8% (22nd lowest)
> Median household income: $56,581 (23rd lowest)
[in-text-ad-2]

20. Alaska
> Supplemental poverty rate: 12.1% (25th lowest)
> Official poverty rate: 12.1% (25th highest)
> Cost of living: 5.4% more than national avg. (10th highest)
> SNAP recipiency: 10.8% (22nd lowest)
> Median household income: $73,181 (7th highest)

20. Vermont
> Supplemental poverty rate: 10.2% (11th lowest)
> Official poverty rate: 10.2% (11th lowest)
> Cost of living: 1.6% more than national avg. (13th highest)
> SNAP recipiency: 11.5% (24th lowest)
> Median household income: $57,513 (24th lowest)
[in-text-ad]

20. Georgia
> Supplemental poverty rate: 15.6% (5th highest)
> Official poverty rate: 15.6% (7th highest)
> Cost of living: 7.9% less than national avg. (19th lowest)
> SNAP recipiency: 12.6% (18th highest)
> Median household income: $56,183 (19th lowest)
[recirclink id=488498]

20. Missouri
> Supplemental poverty rate: 11.3% (19th lowest)
> Official poverty rate: 11.3% (22nd lowest)
> Cost of living: 10.5% less than national avg. (9th lowest)
> SNAP recipiency: 11.0% (23rd lowest)
> Median household income: $53,578 (15th lowest)

24. North Carolina
> Supplemental poverty rate: 14.3% (13th highest)
> Official poverty rate: 14.4% (11th highest)
> Cost of living: 9.1% less than national avg. (17th lowest)
> SNAP recipiency: 12.3% (19th highest)
> Median household income: $52,752 (13th lowest)
[in-text-ad-2]

25. Washington
> Supplemental poverty rate: 10.7% (16th lowest)
> Official poverty rate: 10.8% (15th lowest)
> Cost of living: 5.5% more than national avg. (9th highest)
> SNAP recipiency: 12.3% (19th highest)
> Median household income: $70,979 (10th highest)

26. Indiana
> Supplemental poverty rate: 12.1% (25th lowest)
> Official poverty rate: 12.3% (22nd highest)
> Cost of living: 9.7% less than national avg. (13th lowest)
> SNAP recipiency: 9.3% (13th lowest)
> Median household income: $54,181 (17th lowest)
[in-text-ad]

27. North Dakota
> Supplemental poverty rate: 10.7% (16th lowest)
> Official poverty rate: 11.0% (18th lowest)
> Cost of living: 8.5% less than national avg. (18th lowest)
> SNAP recipiency: 6.3% (2nd lowest)
> Median household income: $61,843 (18th highest)
[recirclink id=488094]

28. Nebraska
> Supplemental poverty rate: 9.7% (7th lowest)
> Official poverty rate: 10.1% (9th lowest)
> Cost of living: 9.5% less than national avg. (16th lowest)
> SNAP recipiency: 8.3% (9th lowest)
> Median household income: $59,970 (21st highest)

29. Minnesota
> Supplemental poverty rate: 8.1% (the lowest)
> Official poverty rate: 8.6% (3rd lowest)
> Cost of living: 2.5% less than national avg. (21st highest)
> SNAP recipiency: 7.8% (7th lowest)
> Median household income: $68,388 (12th highest)
[in-text-ad-2]

30. Tennessee
> Supplemental poverty rate: 13.1% (21st highest)
> Official poverty rate: 13.7% (15th highest)
> Cost of living: 9.8% less than national avg. (11th lowest)
> SNAP recipiency: 13.5% (11th highest)
> Median household income: $51,340 (10th lowest)

31. Wyoming
> Supplemental poverty rate: 10.4% (13th lowest)
> Official poverty rate: 11.0% (18th lowest)
> Cost of living: 3.3% less than national avg. (25th highest)
> SNAP recipiency: 6.3% (2nd lowest)
> Median household income: $60,434 (19th highest)
[in-text-ad]

32. Michigan
> Supplemental poverty rate: 11.3% (19th lowest)
> Official poverty rate: 12.2% (24th highest)
> Cost of living: 6.7% less than national avg. (22nd lowest)
> SNAP recipiency: 13.1% (14th highest)
> Median household income: $54,909 (18th lowest)
[recirclink id=488247]

33. South Carolina
> Supplemental poverty rate: 13.7% (17th highest)
> Official poverty rate: 14.6% (10th highest)
> Cost of living: 9.7% less than national avg. (13th lowest)
> SNAP recipiency: 12.3% (19th highest)
> Median household income: $50,570 (9th lowest)
34. Montana
> Supplemental poverty rate: 10.1% (10th lowest)
> Official poverty rate: 11.1% (19th lowest)
> Cost of living: 5.9% less than national avg. (24th lowest)
> SNAP recipiency: 9.4% (14th lowest)
> Median household income: $53,386 (14th lowest)
[in-text-ad-2]

35. Iowa
> Supplemental poverty rate: 8.6% (2nd lowest)
> Official poverty rate: 9.8% (7th lowest)
> Cost of living: 9.8% less than national avg. (11th lowest)
> SNAP recipiency: 9.6% (15th lowest)
> Median household income: $58,570 (25th highest)

36. Arkansas
> Supplemental poverty rate: 14.2% (15th highest)
> Official poverty rate: 15.6% (7th highest)
> Cost of living: 13.1% less than national avg. (3rd lowest)
> SNAP recipiency: 11.8% (25th highest)
> Median household income: $45,869 (3rd lowest)
[in-text-ad]

37. Wisconsin
> Supplemental poverty rate: 8.9% (4th lowest)
> Official poverty rate: 10.5% (12th lowest)
> Cost of living: 7.2% less than national avg. (20th lowest)
> SNAP recipiency: 10.6% (19th lowest)
> Median household income: $59,305 (22nd highest)
[recirclink id=488174]

38. Rhode Island
> Supplemental poverty rate: 10.1% (10th lowest)
> Official poverty rate: 11.8% (25th lowest)
> Cost of living: 0.4% less than national avg. (17th highest)
> SNAP recipiency: 15.4% (4th highest)
> Median household income: $63,870 (15th highest)

39. Alabama
> Supplemental poverty rate: 14.0% (16th highest)
> Official poverty rate: 15.9% (6th highest)
> Cost of living: 13.4% less than national avg. (2nd lowest)
> SNAP recipiency: 14.0% (9th highest)
> Median household income: $48,123 (6th lowest)
[in-text-ad-2]

40. Maine
> Supplemental poverty rate: 10.4% (13th lowest)
> Official poverty rate: 12.4% (21st highest)
> Cost of living: 1.6% less than national avg. (19th highest)
> SNAP recipiency: 12.8% (17th highest)
> Median household income: $56,277 (20th lowest)

41. Idaho
> Supplemental poverty rate: 9.7% (7th lowest)
> Official poverty rate: 11.7% (24th lowest)
> Cost of living: 7.0% less than national avg. (21st lowest)
> SNAP recipiency: 9.7% (16th lowest)
> Median household income: $52,225 (11th lowest)
[in-text-ad]

41. Ohio
> Supplemental poverty rate: 11.4% (20th lowest)
> Official poverty rate: 13.4% (16th highest)
> Cost of living: 10.7% less than national avg. (8th lowest)
> SNAP recipiency: 13.2% (12th highest)
> Median household income: $54,021 (16th lowest)
[recirclink id=487977]

41. Oklahoma
> Supplemental poverty rate: 11.8% (23rd lowest)
> Official poverty rate: 13.8% (14th highest)
> Cost of living: 11.0% less than national avg. (7th lowest)
> SNAP recipiency: 13.2% (12th highest)
> Median household income: $50,051 (8th lowest)

44. West Virginia
> Supplemental poverty rate: 14.3% (13th highest)
> Official poverty rate: 16.6% (4th highest)
> Cost of living: 12.4% less than national avg. (4th lowest)
> SNAP recipiency: 16.8% (2nd highest)
> Median household income: $43,469 (the lowest)
[in-text-ad-2]

45. South Dakota
> Supplemental poverty rate: 10.6% (14th lowest)
> Official poverty rate: 12.9% (20th highest)
> Cost of living: 11.7% less than national avg. (6th lowest)
> SNAP recipiency: 8.9% (12th lowest)
> Median household income: $56,521 (22nd lowest)

46. Louisiana
> Supplemental poverty rate: 17.7% (3rd highest)
> Official poverty rate: 20.0% (the highest)
> Cost of living: 9.6% less than national avg. (14th lowest)
> SNAP recipiency: 16.4% (3rd highest)
> Median household income: $46,145 (4th lowest)
[in-text-ad]

47. Kentucky
> Supplemental poverty rate: 13.7% (17th highest)
> Official poverty rate: 16.3% (5th highest)
> Cost of living: 12.2% less than national avg. (5th lowest)
> SNAP recipiency: 14.1% (8th highest)
> Median household income: $48,375 (7th lowest)
[recirclink id=487572]

48. Kansas
> Supplemental poverty rate: 10.0% (8th lowest)
> Official poverty rate: 13.3% (18th highest)
> Cost of living: 9.5% less than national avg. (16th lowest)
> SNAP recipiency: 7.7% (6th lowest)
> Median household income: $56,422 (21st lowest)

49. New Mexico
> Supplemental poverty rate: 15.2% (8th highest)
> Official poverty rate: 18.7% (3rd highest)
> Cost of living: 6.4% less than national avg. (23rd lowest)
> SNAP recipiency: 17.4% (the highest)
> Median household income: $46,744 (5th lowest)
[in-text-ad-2]

50. Mississippi
> Supplemental poverty rate: 15.9% (4th highest)
> Official poverty rate: 19.5% (2nd highest)
> Cost of living: 13.6% less than national avg. (the lowest)
> SNAP recipiency: 15.3% (6th highest)
> Median household income: $43,529 (2nd lowest)
Detailed Findings
The Supplemental Poverty Rate is higher than the official poverty rate in 19 states. Among those states, the differences range from as little 0.1 percentage points in Arizona to 5.6 percentage points in California.
In many of these states, high housing costs — housing costs are not factored in the official poverty rate — likely explain the higher SPM. In nine of the 10 states where the SPM exceeds the official poverty rate the most, the median home value is higher than the value of the typical American home of $217,600. In those same nine states, the average cost of goods and services is higher than it is nationwide.
When it comes to measuring poverty, the importance of accounting for cost of living is difficult to understate. In California, for example, factors such as these drive the poverty rate up from 13.4%, lower than 15 other states, to 19.0%, the highest SPM in the country. In New Jersey, the poverty rate goes from 9.7%, one of the lowest in the country, to an SPM of 15.1%, one of the 10 highest.
On the other hand, accounting for cost of living and housing costs can also lead to an SPM below the official poverty rate in less expensive states. In all 10 states where the SPM is the lowest compared to the official poverty rate, median home values and overall costs of living are lower than the national averages.
While the SPM is more comprehensive than the official poverty rate as a tool for determining how widespread financial hardship is, it also reveals the official poverty rate’s efficacy as a means of alleviating financial hardship.
The government uses the poverty line to determine who should receive subsidies like SNAP benefits — and though it is one of many factors, high SNAP recipiency rates are common in places where SPMs fall below the official poverty rate. This suggests that the official poverty rate works — at least to a degree — in alleviating some financial stress.
For example, in New Mexico, where the 15.2% SPM is 3.5 percentage points below the official poverty rate, 17.4% of households receive SNAP benefits — the highest recipiency rate in the country. Similarly, in West Virginia, 16.8% of households receive SNAP benefits, the second highest recipiency rate among states. West Virginia’s SPM is 2.3 percentage points below its official poverty rate of 16.6%. Meanwhile, relatively few states where SPMs are higher than the official poverty rates have higher than average SNAP recipiency rates.
Methodology
To identify the states where poverty is worse and better than you think, 24/7 Wall St. reviewed states where the supplemental poverty rate (SPM) is highest compared to the official poverty rate. We also reviewed states where the SPM is lower than the official rate. These data are three-year averages through 2017 from the U.S. Census Bureau’s Current Population Survey. Median household income and SNAP recipiency rates are from the U.S. Census Bureau’s American Community Survey for 2017. 2016 Regional price parities, or costs of living, came from the Bureau of Economic Analysis.
Contact [email protected] for any questions or corrections.