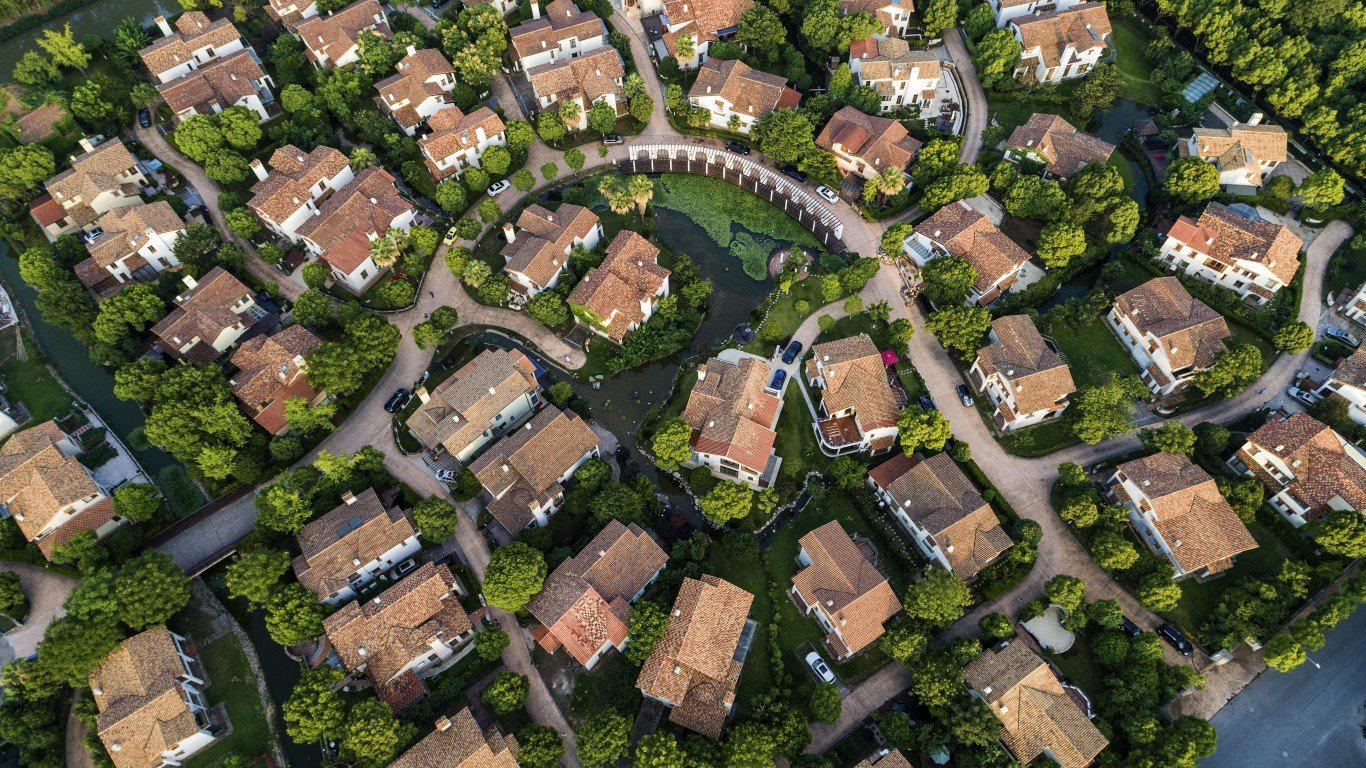
U.S. home sales skyrocketed during the COVID-19 pandemic – hitting a 15-year high of 6.1 million in 2021. The spike in demand, coupled with declining inventory, have put upward pressure on housing prices. Renters have not been spared, as housing has become one of the key drivers of surging U.S. inflation.
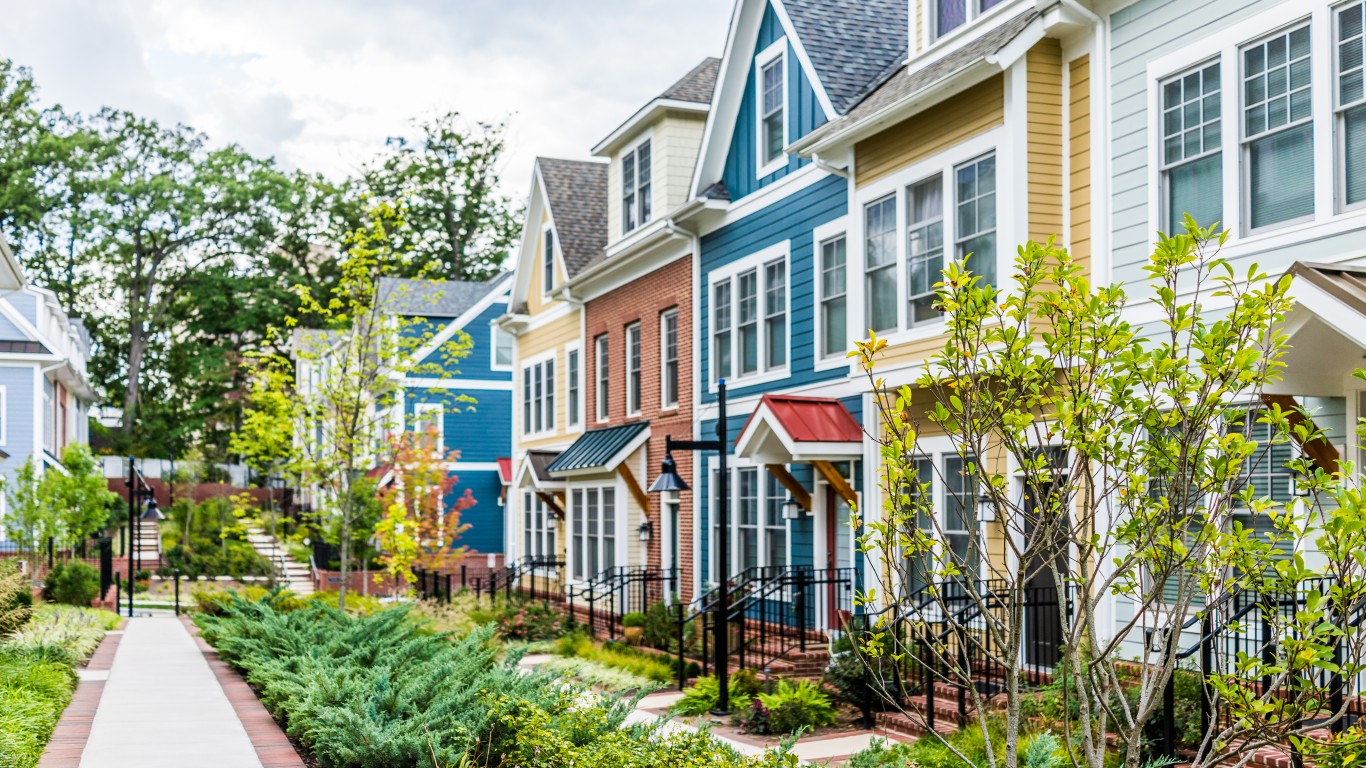
According to the Economic Policy Institute, a nonprofit think tank, a single adult can expect to pay an estimated $11,026 on housing in 2022. This amount varies across the country, however. In some states housing costs are far lower than the national average, while in others, Americans are paying thousands more.
Using data from the EPI’s Family Budget Calculator, 24/7 Wall St. identified the states with the highest housing costs. States are ranked on 2022 estimates of housing and utility costs for a modest studio apartment.
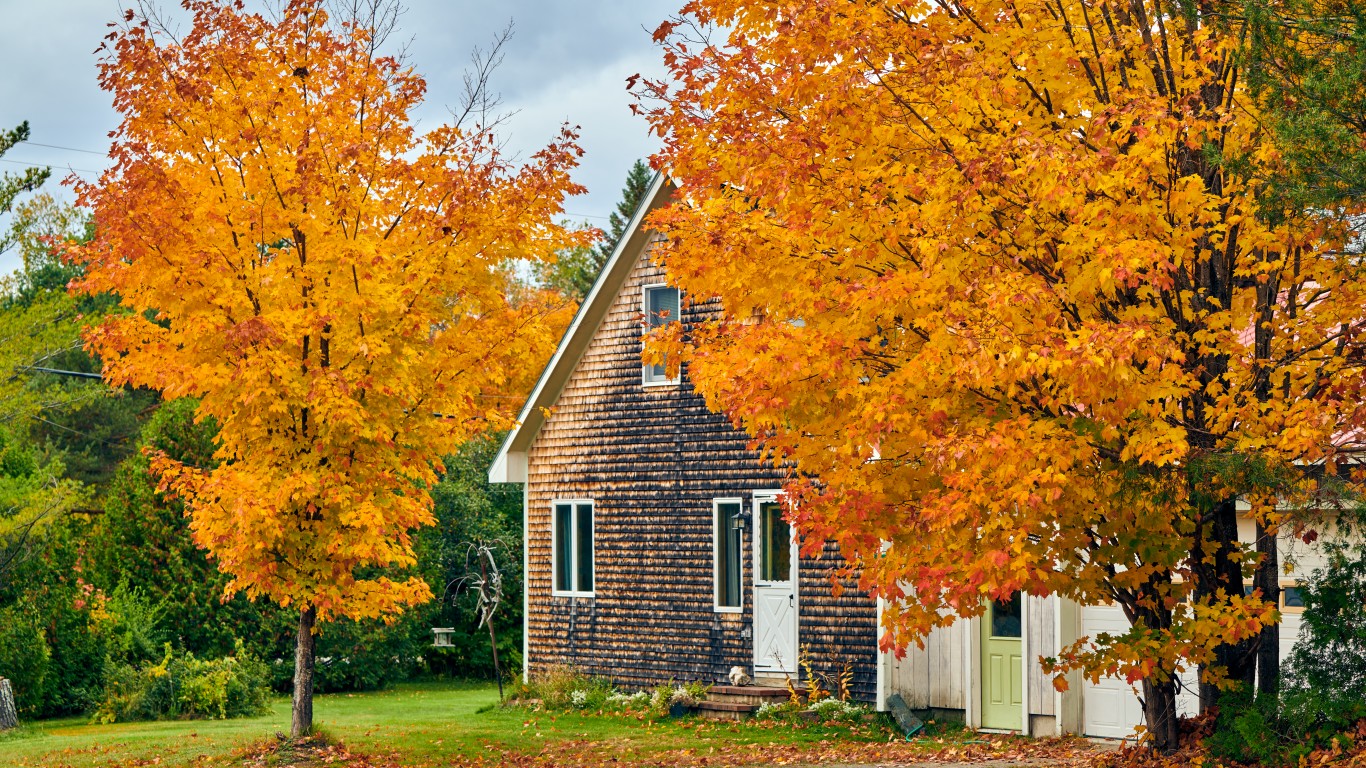
Depending on the state, housing costs for a single adult range from less than $7,000 a year to well over $16,000. Generally, states with higher than average housing costs are coastal, bordered at least partially by the Atlantic or Pacific Oceans, while states with lower than average housing costs are usually landlocked or located in the Deep South. This variation in cost is partially a reflection of what residents can afford, as states with higher rental costs also often have higher than average household incomes, and vice-versa. Here is a look at the income needed to be middle class in each state.
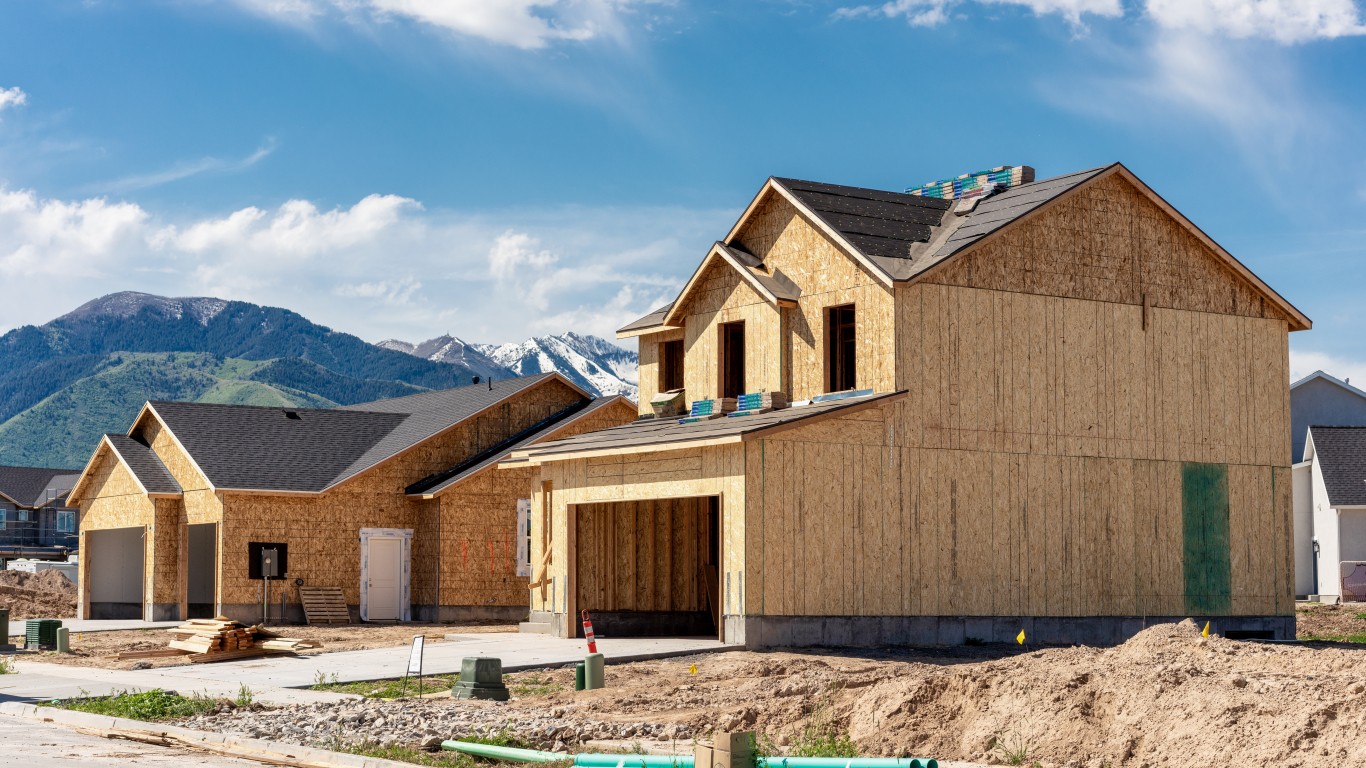
Home values also tend to be higher in areas with high housing costs, making homeownership prohibitively expensive for larger shares of the population. This may help explain why homeownership rates are often lower than the 64.4% national average in the states with the most expensive housing. Here is a look at the mortgage rate in America every year since 1972.
Click here to see states where single pay the most for housing
Click here to see our detailed methodology

50. South Dakota
> Est. annual housing costs: $6,806
> Median household income: $59,896 (20th lowest)
> Homeownership rate: 68.0% (19th highest)
> Median home value: $174,600 (16th lowest)
[in-text-ad]

49. Arkansas
> Est. annual housing costs: $6,808
> Median household income: $49,475 (3rd lowest)
> Homeownership rate: 65.8% (16th lowest)
> Median home value: $133,600 (3rd lowest)
[recirclink id=1052847]

48. Iowa
> Est. annual housing costs: $6,816
> Median household income: $61,836 (24th lowest)
> Homeownership rate: 71.2% (8th highest)
> Median home value: $153,900 (9th lowest)

47. Kentucky
> Est. annual housing costs: $6,892
> Median household income: $52,238 (7th lowest)
> Homeownership rate: 67.6% (20th highest)
> Median home value: $147,100 (5th lowest)
[in-text-ad-2]

46. West Virginia
> Est. annual housing costs: $6,969
> Median household income: $48,037 (2nd lowest)
> Homeownership rate: 73.7% (the highest)
> Median home value: $123,200 (the lowest)

45. Ohio
> Est. annual housing costs: $7,149
> Median household income: $58,116 (15th lowest)
> Homeownership rate: 66.3% (24th lowest)
> Median home value: $151,400 (8th lowest)
[in-text-ad]

44. Mississippi
> Est. annual housing costs: $7,274
> Median household income: $46,511 (the lowest)
> Homeownership rate: 68.8% (16th highest)
> Median home value: $125,500 (2nd lowest)
[recirclink id=1065785]

43. Indiana
> Est. annual housing costs: $7,294
> Median household income: $58,235 (16th lowest)
> Homeownership rate: 69.5% (13th highest)
> Median home value: $148,900 (6th lowest)

42. Nebraska
> Est. annual housing costs: $7,311
> Median household income: $63,015 (25th highest)
> Homeownership rate: 66.2% (19th lowest)
> Median home value: $164,000 (13th lowest)
[in-text-ad-2]

41. Missouri
> Est. annual housing costs: $7,411
> Median household income: $57,290 (13th lowest)
> Homeownership rate: 67.1% (22nd highest)
> Median home value: $163,600 (12th lowest)

40. Oklahoma
> Est. annual housing costs: $7,422
> Median household income: $53,840 (8th lowest)
> Homeownership rate: 66.1% (17th lowest)
> Median home value: $142,400 (4th lowest)
[in-text-ad]

39. Alabama
> Est. annual housing costs: $7,476
> Median household income: $52,035 (6th lowest)
> Homeownership rate: 69.2% (14th highest)
> Median home value: $149,600 (7th lowest)
[recirclink id=1069876]

38. Idaho
> Est. annual housing costs: $7,517
> Median household income: $58,915 (17th lowest)
> Homeownership rate: 70.8% (10th highest)
> Median home value: $235,600 (21st highest)

37. North Dakota
> Est. annual housing costs: $7,561
> Median household income: $65,315 (19th highest)
> Homeownership rate: 62.5% (8th lowest)
> Median home value: $199,900 (25th lowest)
[in-text-ad-2]

36. Wisconsin
> Est. annual housing costs: $7,624
> Median household income: $63,293 (24th highest)
> Homeownership rate: 67.1% (21st highest)
> Median home value: $189,200 (22nd lowest)

35. Montana
> Est. annual housing costs: $7,639
> Median household income: $56,539 (11th lowest)
> Homeownership rate: 68.5% (17th highest)
> Median home value: $244,900 (18th highest)
[in-text-ad]

34. Kansas
> Est. annual housing costs: $7,689
> Median household income: $61,091 (21st lowest)
> Homeownership rate: 66.2% (22nd lowest)
> Median home value: $157,600 (10th lowest)
[recirclink id=1076225]

33. New Mexico
> Est. annual housing costs: $7,822
> Median household income: $51,243 (5th lowest)
> Homeownership rate: 68.0% (18th highest)
> Median home value: $175,700 (17th lowest)

32. Wyoming
> Est. annual housing costs: $7,858
> Median household income: $65,304 (20th highest)
> Homeownership rate: 71.0% (9th highest)
> Median home value: $228,000 (24th highest)
[in-text-ad-2]

31. Michigan
> Est. annual housing costs: $8,040
> Median household income: $59,234 (18th lowest)
> Homeownership rate: 71.7% (4th highest)
> Median home value: $162,600 (11th lowest)

30. Louisiana
> Est. annual housing costs: $8,172
> Median household income: $50,800 (4th lowest)
> Homeownership rate: 66.6% (25th highest)
> Median home value: $168,100 (14th lowest)
[in-text-ad]

29. Tennessee
> Est. annual housing costs: $8,412
> Median household income: $54,833 (9th lowest)
> Homeownership rate: 66.5% (25th lowest)
> Median home value: $177,600 (18th lowest)
[recirclink id=1076750]

28. South Carolina
> Est. annual housing costs: $8,930
> Median household income: $54,864 (10th lowest)
> Homeownership rate: 70.1% (12th highest)
> Median home value: $170,100 (15th lowest)

27. Pennsylvania
> Est. annual housing costs: $8,935
> Median household income: $63,627 (22nd highest)
> Homeownership rate: 69.0% (15th highest)
> Median home value: $187,500 (21st lowest)
[in-text-ad-2]

26. Utah
> Est. annual housing costs: $9,015
> Median household income: $74,197 (12th highest)
> Homeownership rate: 70.5% (11th highest)
> Median home value: $305,400 (10th highest)

25. Nevada
> Est. annual housing costs: $9,212
> Median household income: $62,043 (25th lowest)
> Homeownership rate: 57.1% (3rd lowest)
> Median home value: $290,200 (11th highest)
[in-text-ad]

24. North Carolina
> Est. annual housing costs: $9,297
> Median household income: $56,642 (12th lowest)
> Homeownership rate: 65.7% (15th lowest)
> Median home value: $182,100 (19th lowest)
[recirclink id=1052847]

23. Minnesota
> Est. annual housing costs: $9,306
> Median household income: $73,382 (13th highest)
> Homeownership rate: 71.9% (3rd highest)
> Median home value: $235,700 (20th highest)

22. Maine
> Est. annual housing costs: $9,478
> Median household income: $59,489 (19th lowest)
> Homeownership rate: 72.9% (2nd highest)
> Median home value: $198,000 (24th lowest)
[in-text-ad-2]

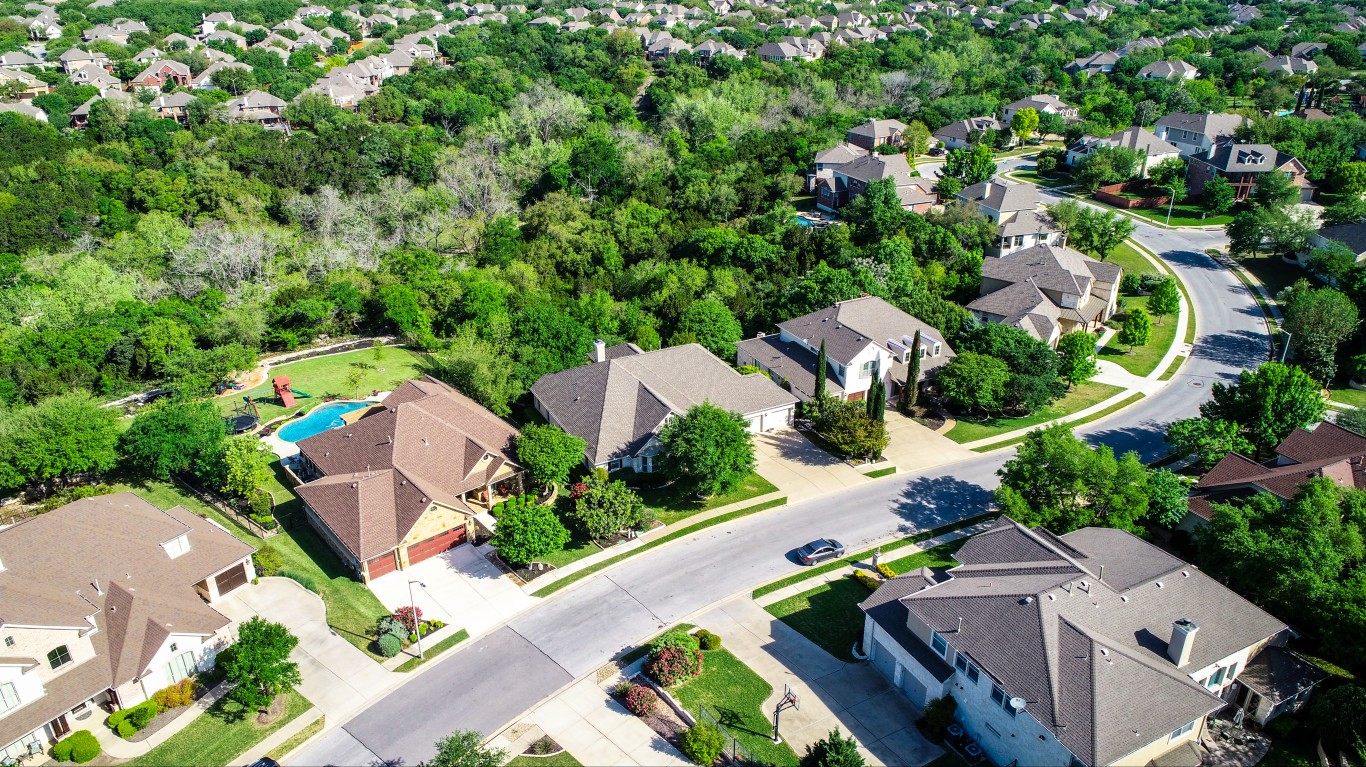
21. Texas
> Est. annual housing costs: $10,028
> Median household income: $63,826 (21st highest)
> Homeownership rate: 62.3% (6th lowest)
> Median home value: $187,200 (20th lowest)

20. Georgia
> Est. annual housing costs: $10,106
> Median household income: $61,224 (22nd lowest)
> Homeownership rate: 64.0% (12th lowest)
> Median home value: $190,200 (23rd lowest)
[in-text-ad]

19. Vermont
> Est. annual housing costs: $10,130
> Median household income: $63,477 (23rd highest)
> Homeownership rate: 71.3% (6th highest)
> Median home value: $230,900 (23rd highest)
[recirclink id=1065785]

18. Arizona
> Est. annual housing costs: $10,143
> Median household income: $61,529 (23rd lowest)
> Homeownership rate: 65.3% (14th lowest)
> Median home value: $242,000 (19th highest)

17. Delaware
> Est. annual housing costs: $10,148
> Median household income: $69,110 (16th highest)
> Homeownership rate: 71.4% (5th highest)
> Median home value: $258,300 (17th highest)
[in-text-ad-2]

16. Alaska
> Est. annual housing costs: $10,316
> Median household income: $77,790 (8th highest)
> Homeownership rate: 64.8% (13th lowest)
> Median home value: $275,600 (15th highest)

15. Illinois
> Est. annual housing costs: $10,427
> Median household income: $68,428 (17th highest)
> Homeownership rate: 66.3% (23rd lowest)
> Median home value: $202,100 (25th highest)
[in-text-ad]

14. New Hampshire
> Est. annual housing costs: $10,550
> Median household income: $77,923 (7th highest)
> Homeownership rate: 71.2% (7th highest)
> Median home value: $272,300 (16th highest)
[recirclink id=1069876]

13. Rhode Island
> Est. annual housing costs: $10,672
> Median household income: $70,305 (15th highest)
> Homeownership rate: 61.6% (5th lowest)
> Median home value: $276,600 (14th highest)

12. Florida
> Est. annual housing costs: $11,076
> Median household income: $57,703 (14th lowest)
> Homeownership rate: 66.2% (20th lowest)
> Median home value: $232,000 (22nd highest)
[in-text-ad-2]

11. Connecticut
> Est. annual housing costs: $11,547
> Median household income: $79,855 (5th highest)
> Homeownership rate: 66.1% (18th lowest)
> Median home value: $279,700 (13th highest)

10. Oregon
> Est. annual housing costs: $11,834
> Median household income: $65,667 (18th highest)
> Homeownership rate: 62.8% (9th lowest)
> Median home value: $336,700 (7th highest)
[in-text-ad]

9. Colorado
> Est. annual housing costs: $12,463
> Median household income: $75,231 (11th highest)
> Homeownership rate: 66.2% (21st lowest)
> Median home value: $369,900 (4th highest)
[recirclink id=1076225]

8. Virginia
> Est. annual housing costs: $13,125
> Median household income: $76,398 (10th highest)
> Homeownership rate: 66.7% (24th highest)
> Median home value: $282,800 (12th highest)

7. Washington
> Est. annual housing costs: $13,473
> Median household income: $77,006 (9th highest)
> Homeownership rate: 63.3% (10th lowest)
> Median home value: $366,800 (5th highest)
[in-text-ad-2]

6. Maryland
> Est. annual housing costs: $13,489
> Median household income: $87,063 (the highest)
> Homeownership rate: 67.1% (23rd highest)
> Median home value: $325,400 (8th highest)
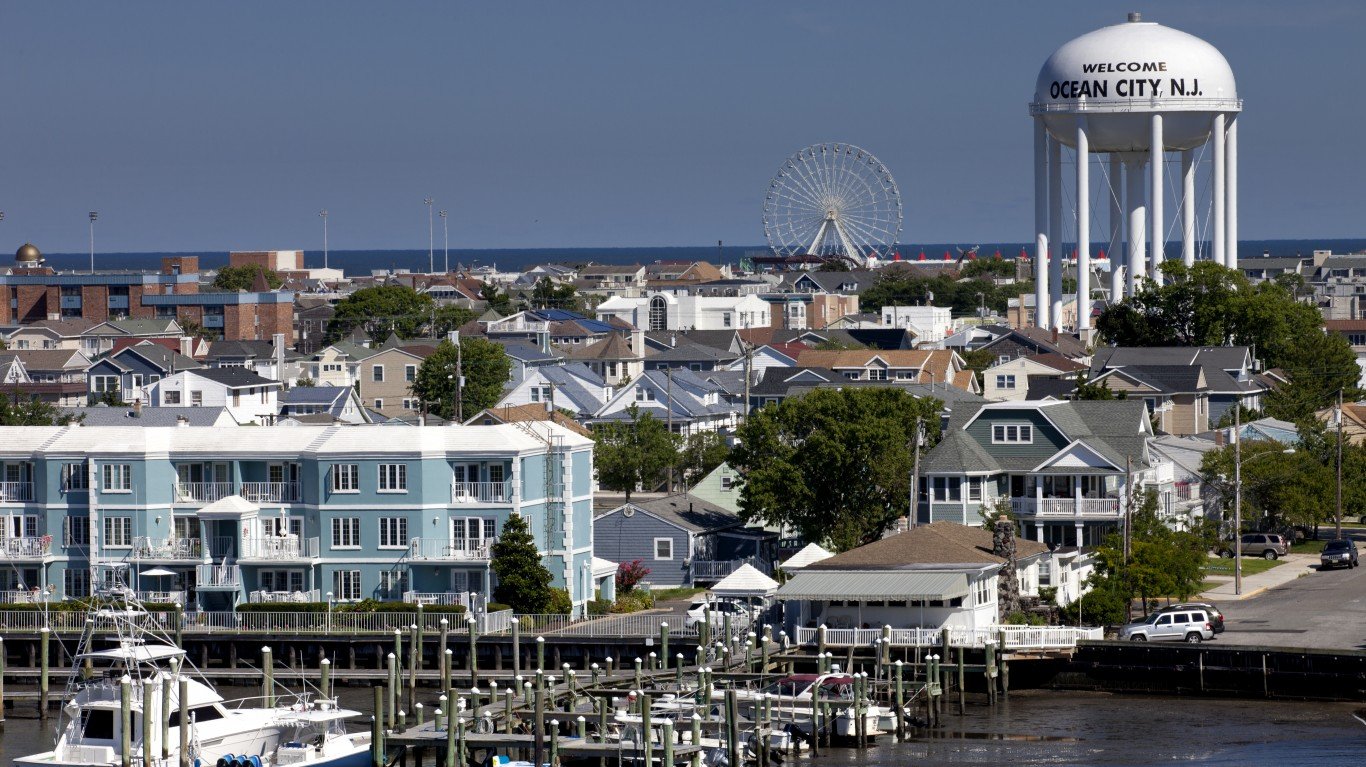
5. New Jersey
> Est. annual housing costs: $13,895
> Median household income: $85,245 (2nd highest)
> Homeownership rate: 64.0% (11th lowest)
> Median home value: $343,500 (6th highest)
[in-text-ad]

4. New York
> Est. annual housing costs: $15,849
> Median household income: $71,117 (14th highest)
> Homeownership rate: 54.1% (the lowest)
> Median home value: $325,000 (9th highest)
[recirclink id=1076750]

3. Hawaii
> Est. annual housing costs: $16,151
> Median household income: $83,173 (4th highest)
> Homeownership rate: 60.3% (4th lowest)
> Median home value: $636,400 (the highest)

2. Massachusetts
> Est. annual housing costs: $16,239
> Median household income: $84,385 (3rd highest)
> Homeownership rate: 62.5% (7th lowest)
> Median home value: $398,800 (3rd highest)
[in-text-ad-2]

1. California
> Est. annual housing costs: $16,349
> Median household income: $78,672 (6th highest)
> Homeownership rate: 55.3% (2nd lowest)
> Median home value: $538,500 (2nd highest)
Methodology
To determine the states where single people pay the most for housing, 24/7 Wall St. reviewed data from the Economic Policy Institute’s 2022 Family Budget Calculator.
In the Family Budget Calculator, the EPI estimates the housing costs for families to maintain a modest yet adequate standard of living. The budgets are created for 10 family types for U.S. counties and metro areas. We used estimates for a single person with no children. For this family type, the EPI assumes the single person is employed and files federal income taxes as the head of household.
State-level housing cost estimates were aggregated from the county level using five-year estimates of total households from the U.S. Census Bureau’s 2020 American Community Survey.
Additional information on median household income, homeownership rate, and median home value are from the U.S. Census Bureau’s 2020 American Community Survey. Because the Census Bureau did not release one-year estimates for 2020 due to data collection issues caused by the COVID-19 pandemic, all ACS data are five-year estimates.
Contact [email protected] for any questions or corrections.