Having reached a high in the Roaring ‘20s, where raucous wealth played against extreme poverty, with large numbers of poor people leaving their agrarian roots for low-paying jobs in the cities, income inequality at that level has returned. From 1928, a year before the start of the Great Depression, to 1978, the income gap gradually decreased, but it has been on the rise ever since, with a short break during the recession of the 2000s.
The population of every city is characterized by income stratification, from poor to well-off, but income ranges can vary significantly from one city to another. To determine the 50 U.S. cities with the widest income gaps, 24/7 Wall St. used data from the U.S. Census Bureau’s 2020 American Community Survey. All other data came from the ACS.
Cities are ranked by their Gini index, a measure of income inequality based on the distribution of income across a population on a 0 to 1 scale, with 0 representing perfect equality and 1 representing the highest possible level of inequality. Among the cities on this list, Gini scores begin at 0.54 — well above the national Gini index of 0.489, according to Census Bureau data.
In places known for their wealthier demographic, such as Palm Springs and Beverly Hills in California, Palm Beach Gardens and Miami Beach in Florida, and New York City, there are often immense income gaps. The rich people in all these cities rely heavily on services provided by low paid workers, often immigrants. This may help to explain why 10 of the 50 cities with the largest income gaps are in Florida. (Gender income inequality, though improving, is still high. These are 22 metros with the worst pay gaps.)
Of the 50 cities with the largest gap between rich and poor, 21 are in Southern states other than Florida. In these states, the disparity is as attributable to the high levels of poverty as it is to the contrasting wealth. For 17 of these cities, the wages are the lowest in the country, tracking the federal minimum wage at just $7.25 per hour. (This is the poorest town in every state.)
A more surprising factor among the reasons for income disparity is the location of colleges and universities. Students living off campus are counted among residential households, and, while many of them may come from wealth and are paying high tuition, their income tends to be low to non-existent. This is at least a partial explanation for why such cities as Princeton, New Jersey; Ithaca, New York; Chapel Hill, North Carolina; Boulder, Colorado; and Amherst, Massachusetts are on the list.
Poughkeepsie, New York, home to Vassar, Marist, and a community college, tops the list as the U.S. city with the widest income gap. While the top 20% of earners have a relatively low average income of $283,549, they take in over 63% of all income in the area. Meanwhile, the average income of the bottom 20% of earners is just $9,404, and they cumulatively make just 2.1% of the area’s income.
Here are the 50 cities in the United States with the greatest disparity in income
Click here to see our detailed methodology

50. Palm Beach Gardens, Florida
> Gini Index: 0.54
> Avg. household income, top 20%: $438,038 – #62 highest out of 1,789 cities
> Avg. household income, bottom 20%: $20,606 – #502 highest out of 1,789 cities
> Share of all income in Palm Beach Gardens that went to top 20%: 58.0% – #29 highest out of 1,789 cities
> Share of all income in Palm Beach Gardens that went to bottom 20%: 2.7% – #1,590 highest out of 1,789 cities
> Median household income: $89,736 – #427 highest out of 1,789 cities
[in-text-ad]

49. Meridian, Mississippi
> Gini Index: 0.54
> Avg. household income, top 20%: $152,110 – #1,511 highest out of 1,789 cities
> Avg. household income, bottom 20%: $7,093 – #1,635 highest out of 1,789 cities
> Share of all income in Meridian that went to top 20%: 57.8% – #34 highest out of 1,789 cities
> Share of all income in Meridian that went to bottom 20%: 2.7% – #1,615 highest out of 1,789 cities
> Median household income: $30,088 – #1,782 highest out of 1,789 cities
[recirclink id=1082568]

48. Palm Springs, California
> Gini Index: 0.54
> Avg. household income, top 20%: $272,254 – #373 highest out of 1,789 cities
> Avg. household income, bottom 20%: $11,521 – #1,305 highest out of 1,789 cities
> Share of all income in Palm Springs that went to top 20%: 57.3% – #43 highest out of 1,789 cities
> Share of all income in Palm Springs that went to bottom 20%: 2.4% – #1,680 highest out of 1,789 cities
> Median household income: $57,916 – #1,134 highest out of 1,789 cities

47. Tampa, Florida
> Gini Index: 0.54
> Avg. household income, top 20%: $262,600 – #424 highest out of 1,789 cities
> Avg. household income, bottom 20%: $10,610 – #1,388 highest out of 1,789 cities
> Share of all income in Tampa that went to top 20%: 57.5% – #38 highest out of 1,789 cities
> Share of all income in Tampa that went to bottom 20%: 2.3% – #1,695 highest out of 1,789 cities
> Median household income: $55,634 – #1,207 highest out of 1,789 cities
[in-text-ad-2]

46. Princeton, New Jersey
> Gini Index: 0.54
> Avg. household income, top 20%: $664,641 – #9 highest out of 1,789 cities
> Avg. household income, bottom 20%: $23,061 – #349 highest out of 1,789 cities
> Share of all income in Princeton that went to top 20%: 56.9% – #52 highest out of 1,789 cities
> Share of all income in Princeton that went to bottom 20%: 2.0% – #1,743 highest out of 1,789 cities
> Median household income: $146,127 – # 48 highest out of 1,789 cities

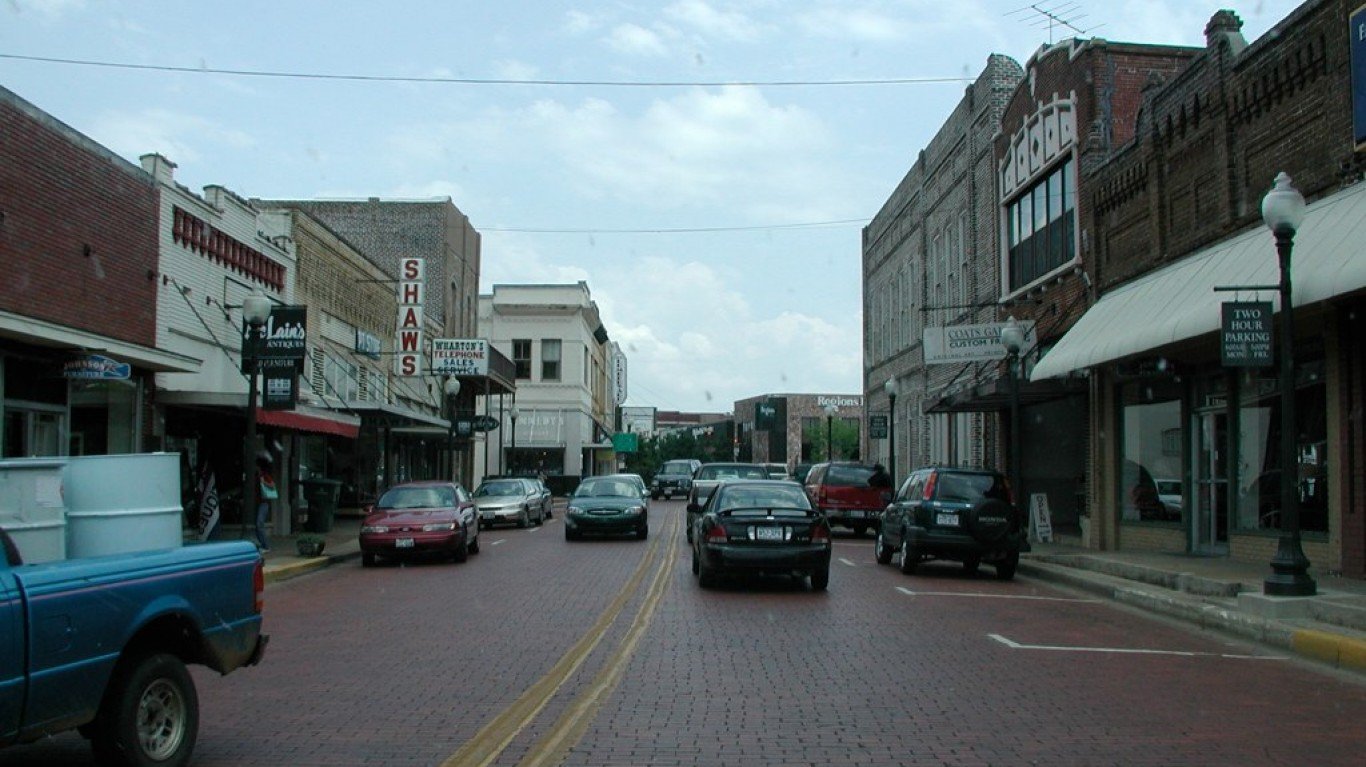
45. Texarkana, Texas
> Gini Index: 0.54
> Avg. household income, top 20%: $207,112 – #822 highest out of 1,789 cities
> Avg. household income, bottom 20%: $7,418 – #1,618 highest out of 1,789 cities
> Share of all income in Texarkana that went to top 20%: 56.3% – #70 highest out of 1,789 cities
> Share of all income in Texarkana that went to bottom 20%: 2.0% – #1,740 highest out of 1,789 cities
> Median household income: $46,408 – #1,530 highest out of 1,789 cities
[in-text-ad]

44. Houma, Louisiana
> Gini Index: 0.54
> Avg. household income, top 20%: $213,751 – #745 highest out of 1,789 cities
> Avg. household income, bottom 20%: $9,977 – #1,442 highest out of 1,789 cities
> Share of all income in Houma that went to top 20%: 56.9% – #51 highest out of 1,789 cities
> Share of all income in Houma that went to bottom 20%: 2.7% – #1,625 highest out of 1,789 cities
> Median household income: $44,956 – #1,566 highest out of 1,789 cities
[recirclink id=1057901]
43. Nacogdoches, Texas
> Gini Index: 0.55
> Avg. household income, top 20%: $168,125 – #1,305 highest out of 1,789 cities
> Avg. household income, bottom 20%: $8,054 – #1,592 highest out of 1,789 cities
> Share of all income in Nacogdoches that went to top 20%: 57.9% – #32 highest out of 1,789 cities
> Share of all income in Nacogdoches that went to bottom 20%: 2.8% – #1,578 highest out of 1,789 cities
> Median household income: $35,050 – #1,751 highest out of 1,789 cities
42. Alexandria, Louisiana
> Gini Index: 0.55
> Avg. household income, top 20%: $197,641 – #921 highest out of 1,789 cities
> Avg. household income, bottom 20%: $8,855 – #1,535 highest out of 1,789 cities
> Share of all income in Alexandria that went to top 20%: 57.7% – #35 highest out of 1,789 cities
> Share of all income in Alexandria that went to bottom 20%: 2.6% – #1,643 highest out of 1,789 cities
> Median household income: $41,845 – #1,650 highest out of 1,789 cities
[in-text-ad-2]

41. Charleston, West Virginia
> Gini Index: 0.55
> Avg. household income, top 20%: $233,234 – #609 highest out of 1,789 cities
> Avg. household income, bottom 20%: $9,465 – #1,488 highest out of 1,789 cities
> Share of all income in Charleston that went to top 20%: 57.9% – #31 highest out of 1,789 cities
> Share of all income in Charleston that went to bottom 20%: 2.4% – #1,690 highest out of 1,789 cities
> Median household income: $49,769 – #1,402 highest out of 1,789 cities
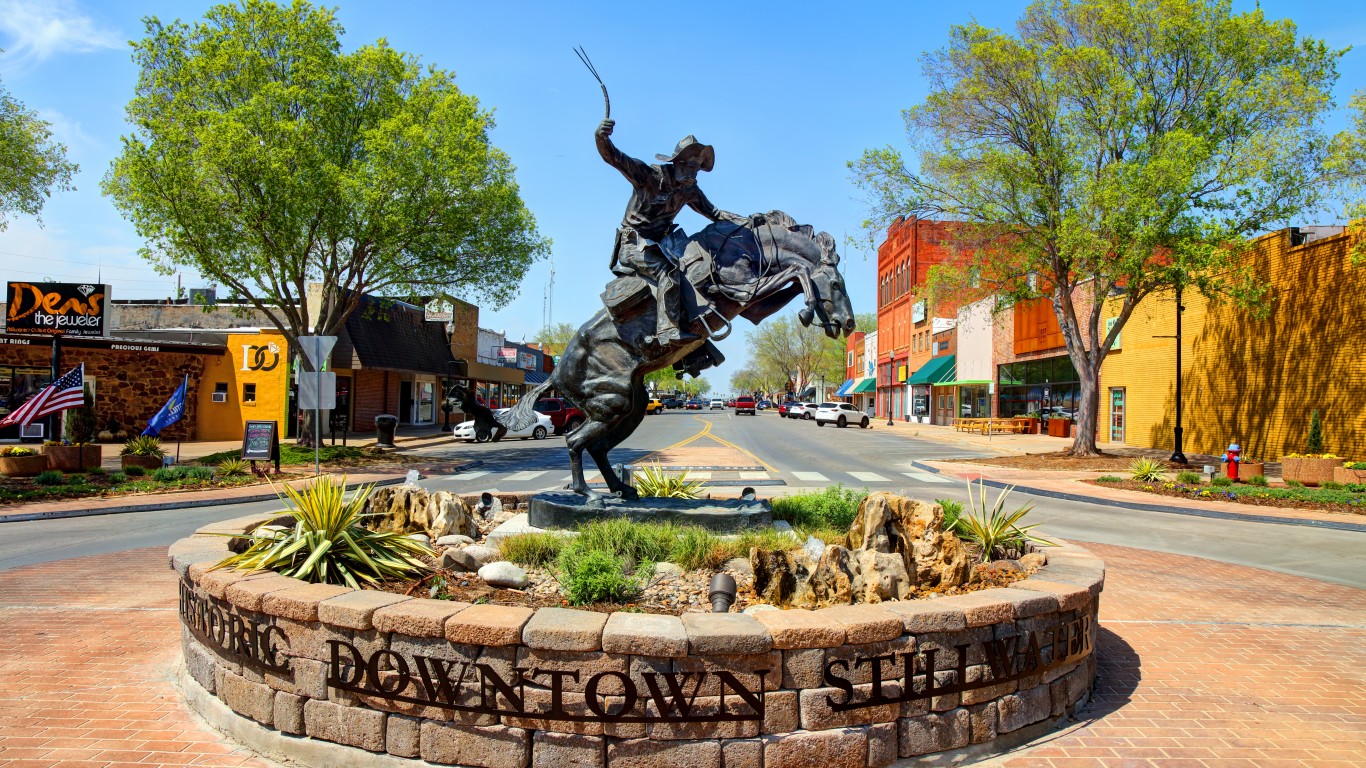
40. Stillwater, Oklahoma
> Gini Index: 0.55
> Avg. household income, top 20%: $163,397 – #1,366 highest out of 1,789 cities
> Avg. household income, bottom 20%: $4,678 – #1,682 highest out of 1,789 cities
> Share of all income in Stillwater that went to top 20%: 56.7% – #58 highest out of 1,789 cities
> Share of all income in Stillwater that went to bottom 20%: 1.6% – #1,769 highest out of 1,789 cities
> Median household income: $34,906 – #1,752 highest out of 1,789 cities
[in-text-ad]

39. New York, New York
> Gini Index: 0.55
> Avg. household income, top 20%: $306,068 – #250 highest out of 1,789 cities
> Avg. household income, bottom 20%: $10,929 – #1,353 highest out of 1,789 cities
> Share of all income in New York that went to top 20%: 57.2% – #44 highest out of 1,789 cities
> Share of all income in New York that went to bottom 20%: 2.0% – #1,736 highest out of 1,789 cities
> Median household income: $67,046 – #880 highest out of 1,789 cities
[recirclink id=1025484]

38. Chapel Hill, North Carolina
> Gini Index: 0.55
> Avg. household income, top 20%: $356,063 – #148 highest out of 1,789 cities
> Avg. household income, bottom 20%: $10,358 – #1,412 highest out of 1,789 cities
> Share of all income in Chapel Hill that went to top 20%: 56.8% – #53 highest out of 1,789 cities
> Share of all income in Chapel Hill that went to bottom 20%: 1.6% – #1,769 highest out of 1,789 cities
> Median household income: $75,249 – #697 highest out of 1,789 cities

37. Boulder, Colorado
> Gini Index: 0.55
> Avg. household income, top 20%: $335,049 – #187 highest out of 1,789 cities
> Avg. household income, bottom 20%: $10,117 – #1,434 highest out of 1,789 cities
> Share of all income in Boulder that went to top 20%: 57.0% – #48 highest out of 1,789 cities
> Share of all income in Boulder that went to bottom 20%: 1.7% – #1,766 highest out of 1,789 cities
> Median household income: $72,279 – #767 highest out of 1,789 cities
[in-text-ad-2]
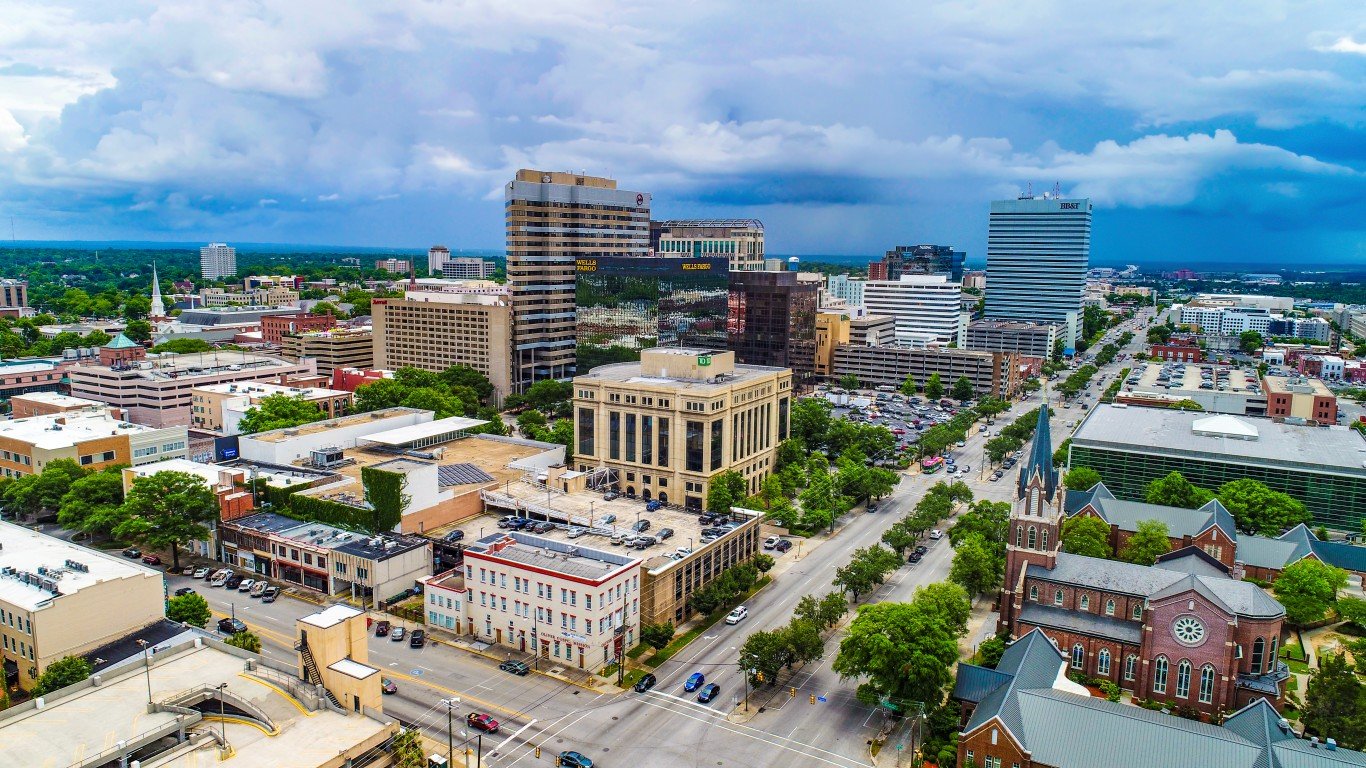
36. Columbia, South Carolina
> Gini Index: 0.55
> Avg. household income, top 20%: $220,721 – #694 highest out of 1,789 cities
> Avg. household income, bottom 20%: $7,396 – #1,621 highest out of 1,789 cities
> Share of all income in Columbia that went to top 20%: 57.5% – #40 highest out of 1,789 cities
> Share of all income in Columbia that went to bottom 20%: 1.9% – #1,750 highest out of 1,789 cities
> Median household income: $47,416 – #1,490 highest out of 1,789 cities
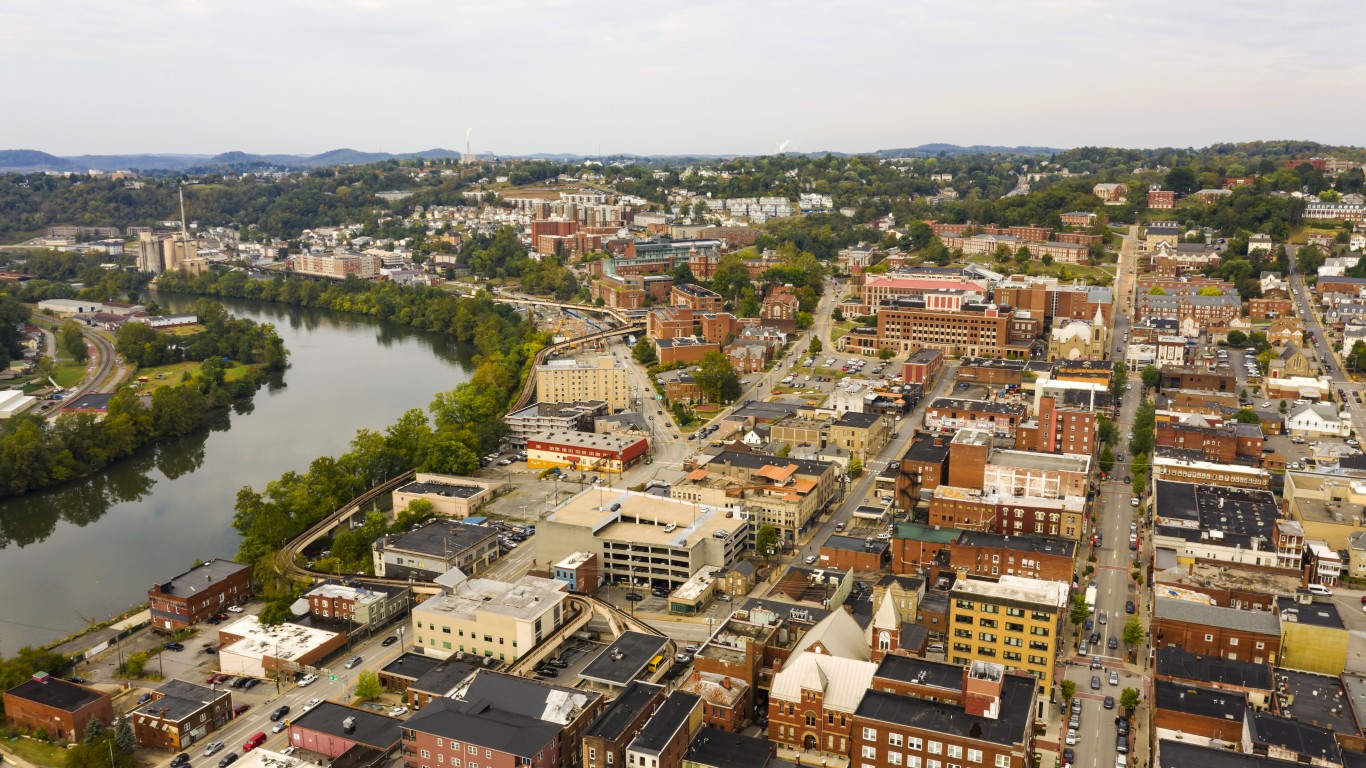
35. Morgantown, West Virginia
> Gini Index: 0.55
> Avg. household income, top 20%: $185,008 – #1,087 highest out of 1,789 cities
> Avg. household income, bottom 20%: $4,176 – #1,685 highest out of 1,789 cities
> Share of all income in Morgantown that went to top 20%: 55.7% – #86 highest out of 1,789 cities
> Share of all income in Morgantown that went to bottom 20%: 1.3% – #1,782 highest out of 1,789 cities
> Median household income: $42,474 – #1,631 highest out of 1,789 cities
[in-text-ad]

34. Santa Monica, California
> Gini Index: 0.55
> Avg. household income, top 20%: $433,673 – #64 highest out of 1,789 cities
> Avg. household income, bottom 20%: $13,181 – #1,110 highest out of 1,789 cities
> Share of all income in Santa Monica that went to top 20%: 57.2% – #45 highest out of 1,789 cities
> Share of all income in Santa Monica that went to bottom 20%: 1.8% – #1,762 highest out of 1,789 cities
> Median household income: $98,300 – #322 highest out of 1,789 cities
[recirclink id=1041570]

33. Sarasota, Florida
> Gini Index: 0.55
> Avg. household income, top 20%: $276,304 – #352 highest out of 1,789 cities
> Avg. household income, bottom 20%: $12,606 – #1,177 highest out of 1,789 cities
> Share of all income in Sarasota that went to top 20%: 58.6% – #25 highest out of 1,789 cities
> Share of all income in Sarasota that went to bottom 20%: 2.7% – #1,621 highest out of 1,789 cities
> Median household income: $56,093 – #1,190 highest out of 1,789 cities
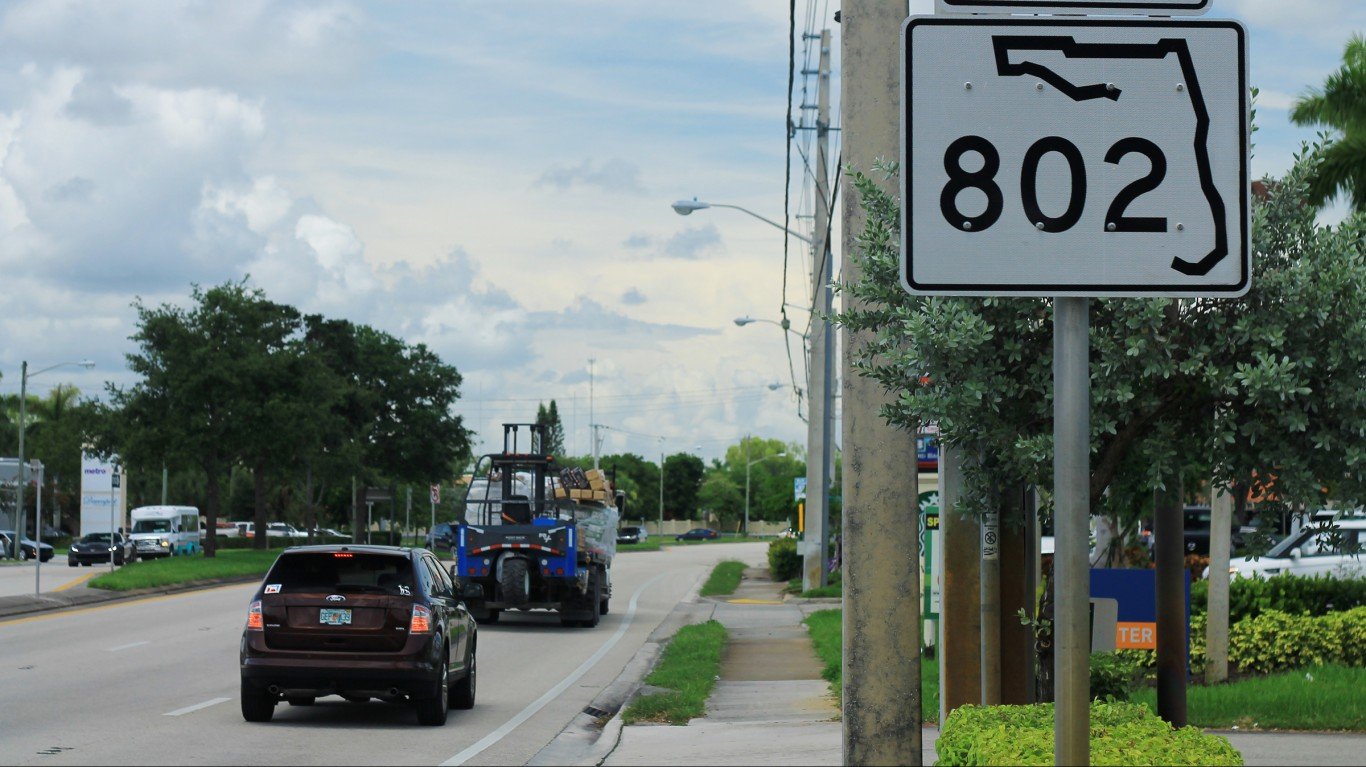
32. Greenacres, Florida
> Gini Index: 0.55
> Avg. household income, top 20%: $243,776 – #536 highest out of 1,789 cities
> Avg. household income, bottom 20%: $14,072 – #1,010 highest out of 1,789 cities
> Share of all income in Greenacres that went to top 20%: 59.5% – #16 highest out of 1,789 cities
> Share of all income in Greenacres that went to bottom 20%: 3.4% – #1,168 highest out of 1,789 cities
> Median household income: $47,840 – #1,475 highest out of 1,789 cities
[in-text-ad-2]

31. Coral Gables, Florida
> Gini Index: 0.55
> Avg. household income, top 20%: $507,825 – #33 highest out of 1,789 cities
> Avg. household income, bottom 20%: $16,056 – #840 highest out of 1,789 cities
> Share of all income in Coral Gables that went to top 20%: 57.9% – #30 highest out of 1,789 cities
> Share of all income in Coral Gables that went to bottom 20%: 1.8% – #1,755 highest out of 1,789 cities
> Median household income: $103,999 – #240 highest out of 1,789 cities

30. Oxford, Mississippi
> Gini Index: 0.55
> Avg. household income, top 20%: $211,056 – #777 highest out of 1,789 cities
> Avg. household income, bottom 20%: $5,448 – #1,675 highest out of 1,789 cities
> Share of all income in Oxford that went to top 20%: 57.5% – #38 highest out of 1,789 cities
> Share of all income in Oxford that went to bottom 20%: 1.5% – #1,775 highest out of 1,789 cities
> Median household income: $48,566 – #1,452 highest out of 1,789 cities
[in-text-ad]
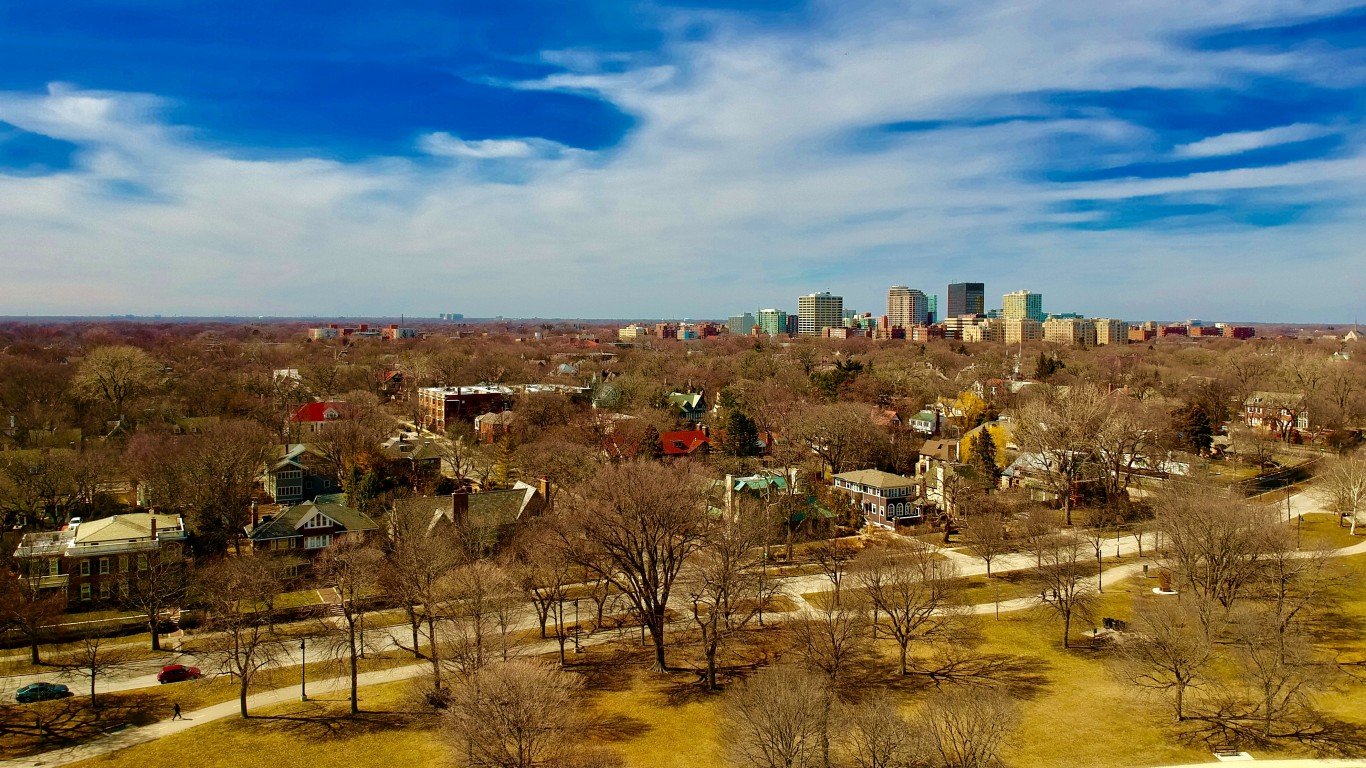
29. Evanston, Illinois
> Gini Index: 0.55
> Avg. household income, top 20%: $405,698 – #80 highest out of 1,789 cities
> Avg. household income, bottom 20%: $15,353 – #905 highest out of 1,789 cities
> Share of all income in Evanston that went to top 20%: 58.3% – #26 highest out of 1,789 cities
> Share of all income in Evanston that went to bottom 20%: 2.2% – #1,719 highest out of 1,789 cities
> Median household income: $82,335 – #553 highest out of 1,789 cities
[recirclink id=1051431]

28. Tarpon Springs, Florida
> Gini Index: 0.55
> Avg. household income, top 20%: $264,720 – #414 highest out of 1,789 cities
> Avg. household income, bottom 20%: $11,142 – #1,338 highest out of 1,789 cities
> Share of all income in Tarpon Springs that went to top 20%: 58.9% – #22 highest out of 1,789 cities
> Share of all income in Tarpon Springs that went to bottom 20%: 2.5% – #1,668 highest out of 1,789 cities
> Median household income: $53,713 – #1,272 highest out of 1,789 cities

27. Greenville, South Carolina
> Gini Index: 0.55
> Avg. household income, top 20%: $291,435 – #293 highest out of 1,789 cities
> Avg. household income, bottom 20%: $11,186 – #1,333 highest out of 1,789 cities
> Share of all income in Greenville that went to top 20%: 59.0% – #21 highest out of 1,789 cities
> Share of all income in Greenville that went to bottom 20%: 2.3% – #1,708 highest out of 1,789 cities
> Median household income: $58,259 – #1,126 highest out of 1,789 cities
[in-text-ad-2]

26. Urbana, Illinois
> Gini Index: 0.56
> Avg. household income, top 20%: $169,361 – #1,297 highest out of 1,789 cities
> Avg. household income, bottom 20%: $2,929 – #1,695 highest out of 1,789 cities
> Share of all income in Urbana that went to top 20%: 57.5% – #41 highest out of 1,789 cities
> Share of all income in Urbana that went to bottom 20%: 1.0% – #1,785 highest out of 1,789 cities
> Median household income: $35,984 – #1,743 highest out of 1,789 cities
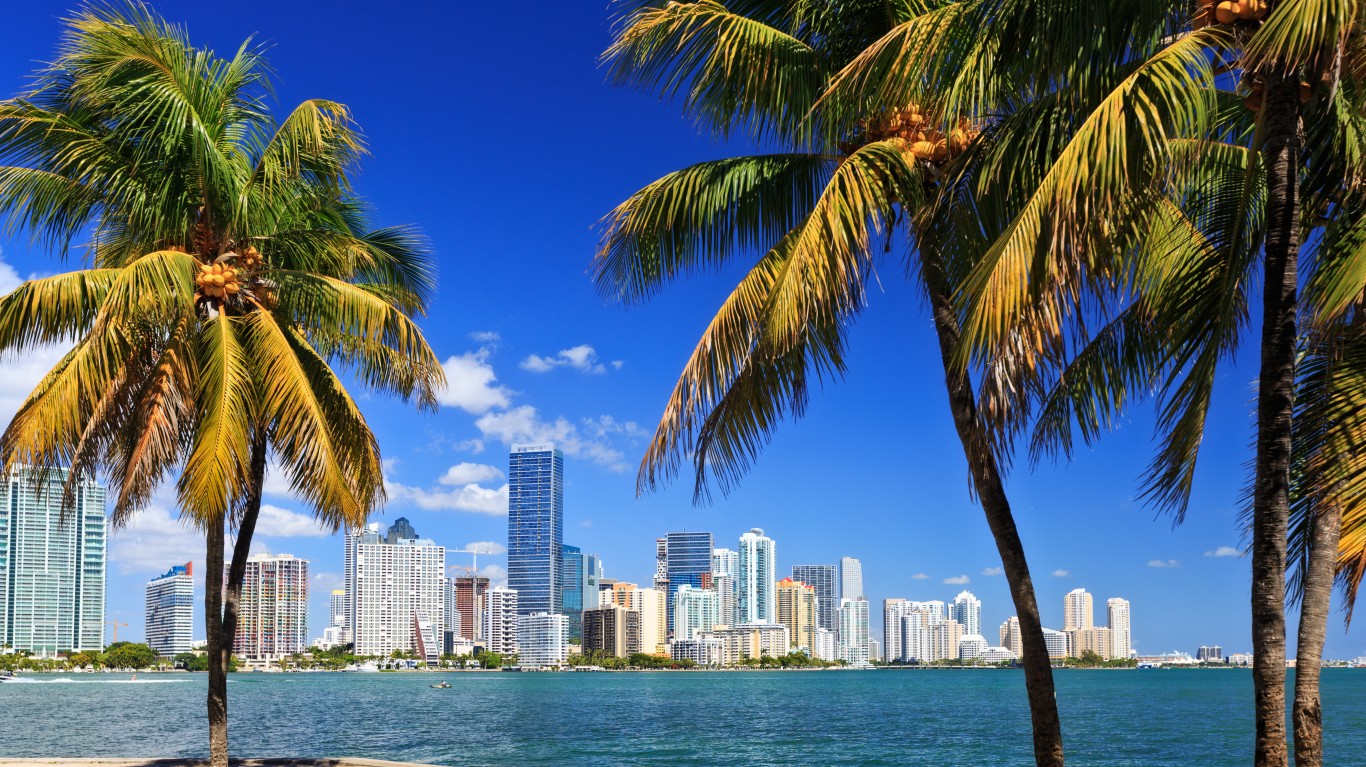
25. Miami, Florida
> Gini Index: 0.56
> Avg. household income, top 20%: $220,820 – #692 highest out of 1,789 cities
> Avg. household income, bottom 20%: $8,358 – #1,561 highest out of 1,789 cities
> Share of all income in Miami that went to top 20%: 59.1% – #18 highest out of 1,789 cities
> Share of all income in Miami that went to bottom 20%: 2.2% – #1,712 highest out of 1,789 cities
> Median household income: $44,268 – #1,581 highest out of 1,789 cities
[in-text-ad]
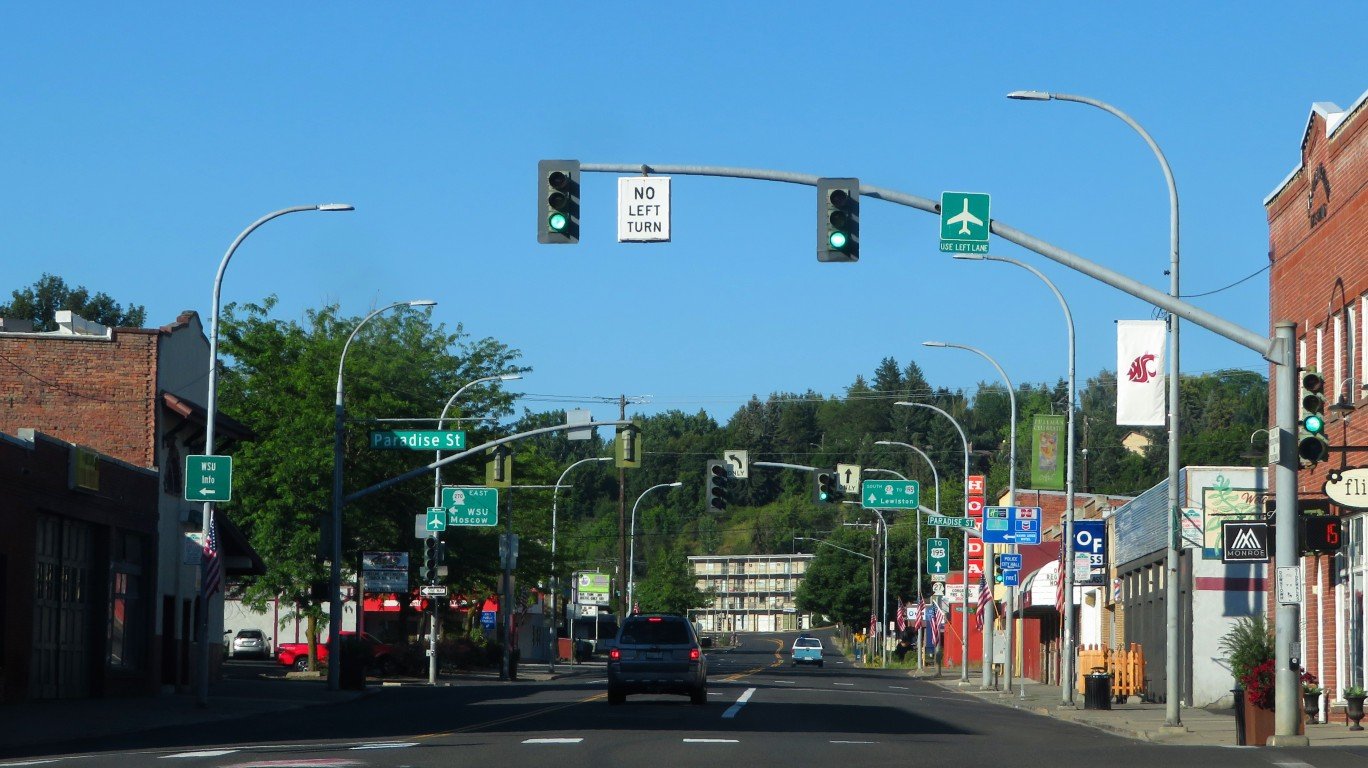
24. Pullman, Washington
> Gini Index: 0.56
> Avg. household income, top 20%: $166,862 – #1,320 highest out of 1,789 cities
> Avg. household income, bottom 20%: $4,146 – #1,686 highest out of 1,789 cities
> Share of all income in Pullman that went to top 20%: 58.2% – #28 highest out of 1,789 cities
> Share of all income in Pullman that went to bottom 20%: 1.5% – #1,776 highest out of 1,789 cities
> Median household income: $32,073 – #1,772 highest out of 1,789 cities
[recirclink id=1082568]

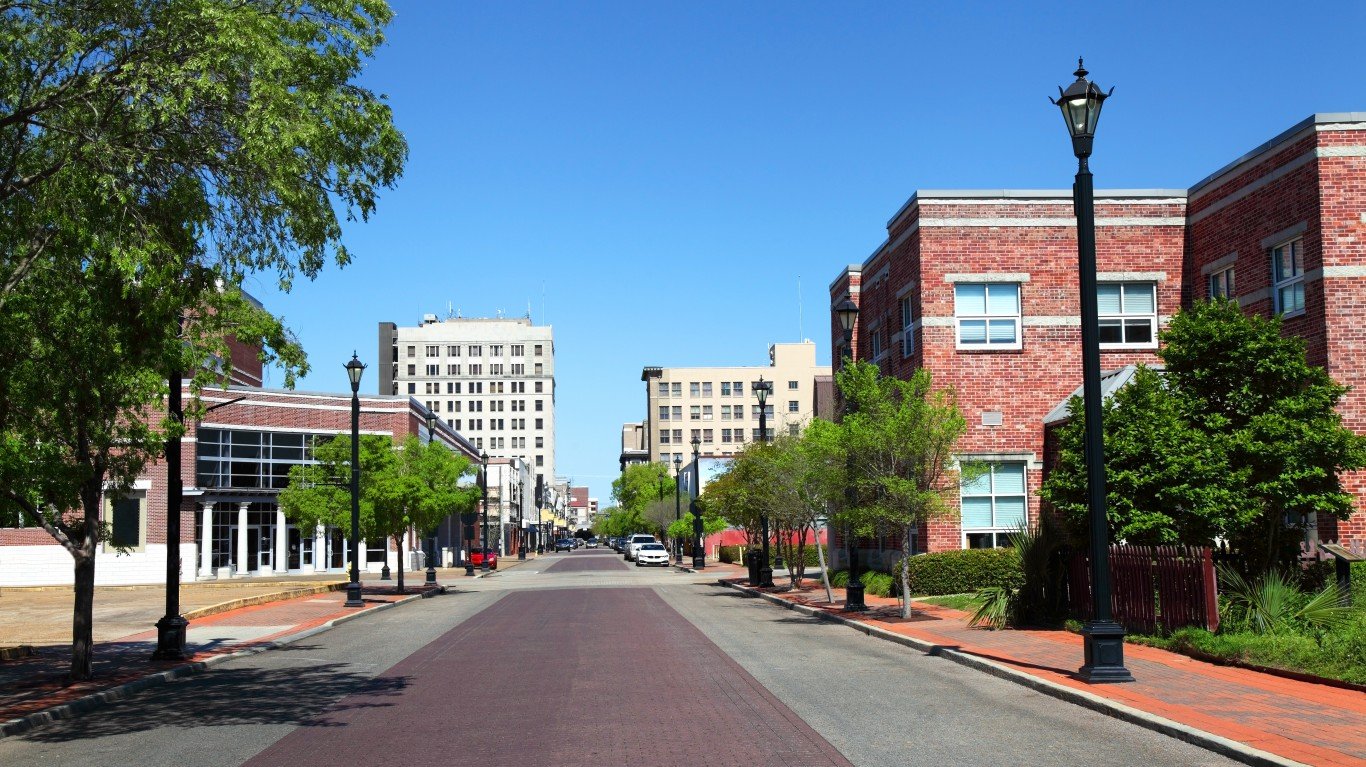
23. Baton Rouge, Louisiana
> Gini Index: 0.56
> Avg. household income, top 20%: $220,990 – #690 highest out of 1,789 cities
> Avg. household income, bottom 20%: $8,298 – #1,569 highest out of 1,789 cities
> Share of all income in Baton Rouge that went to top 20%: 59.0% – #20 highest out of 1,789 cities
> Share of all income in Baton Rouge that went to bottom 20%: 2.2% – #1,716 highest out of 1,789 cities
> Median household income: $44,177 – #1,584 highest out of 1,789 cities

22. Amherst Town, Massachusetts
> Gini Index: 0.56
> Avg. household income, top 20%: $289,147 – #302 highest out of 1,789 cities
> Avg. household income, bottom 20%: $8,608 – #1,546 highest out of 1,789 cities
> Share of all income in Amherst Town that went to top 20%: 57.6% – #36 highest out of 1,789 cities
> Share of all income in Amherst Town that went to bottom 20%: 1.7% – #1,766 highest out of 1,789 cities
> Median household income: $56,906 – #1,163 highest out of 1,789 cities
[in-text-ad-2]

21. New Orleans, Louisiana
> Gini Index: 0.57
> Avg. household income, top 20%: $218,326 – #708 highest out of 1,789 cities
> Avg. household income, bottom 20%: $6,998 – #1,639 highest out of 1,789 cities
> Share of all income in New Orleans that went to top 20%: 59.0% – #19 highest out of 1,789 cities
> Share of all income in New Orleans that went to bottom 20%: 1.9% – #1,753 highest out of 1,789 cities
> Median household income: $43,258 – #1,609 highest out of 1,789 cities

20. Valdosta, Georgia
> Gini Index: 0.57
> Avg. household income, top 20%: $164,956 – #1,345 highest out of 1,789 cities
> Avg. household income, bottom 20%: $3,882 – #1,690 highest out of 1,789 cities
> Share of all income in Valdosta that went to top 20%: 58.6% – #24 highest out of 1,789 cities
> Share of all income in Valdosta that went to bottom 20%: 1.4% – #1,779 highest out of 1,789 cities
> Median household income: $33,583 – #1,761 highest out of 1,789 cities
[in-text-ad]

19. Auburn, Alabama
> Gini Index: 0.57
> Avg. household income, top 20%: $231,171 – #621 highest out of 1,789 cities
> Avg. household income, bottom 20%: $4,127 – #1,687 highest out of 1,789 cities
> Share of all income in Auburn that went to top 20%: 57.6% – #37 highest out of 1,789 cities
> Share of all income in Auburn that went to bottom 20%: 1.0% – #1,784 highest out of 1,789 cities
> Median household income: $49,028 – #1,432 highest out of 1,789 cities
[recirclink id=1057901]

18. State College borough, Pennsylvania
> Gini Index: 0.57
> Avg. household income, top 20%: $191,998 – #1,006 highest out of 1,789 cities
> Avg. household income, bottom 20%: $3,905 – #1,689 highest out of 1,789 cities
> Share of all income in State College borough that went to top 20%: 59.3% – #17 highest out of 1,789 cities
> Share of all income in State College borough that went to bottom 20%: 1.2% – #1,783 highest out of 1,789 cities
> Median household income: $38,076 – #1,712 highest out of 1,789 cities

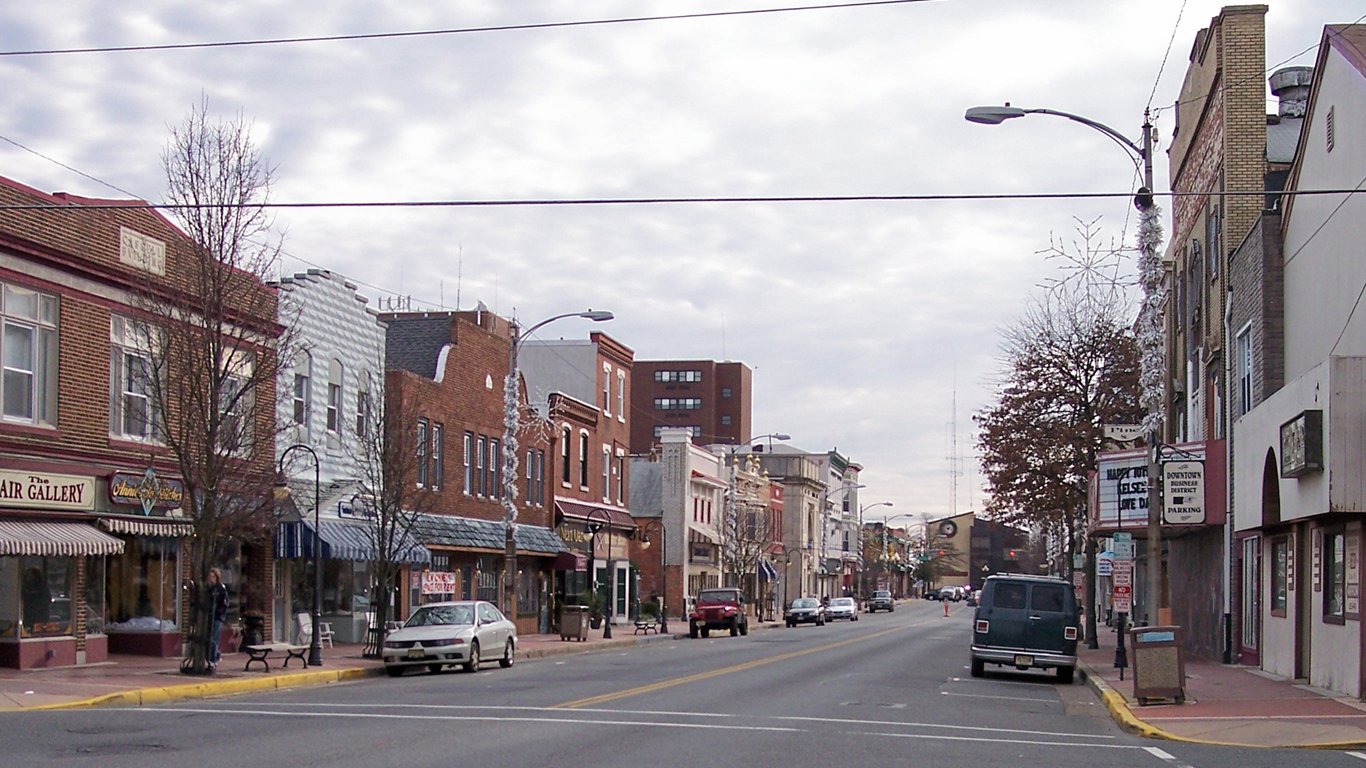
17. Trenton, New Jersey
> Gini Index: 0.57
> Avg. household income, top 20%: $183,976 – #1,104 highest out of 1,789 cities
> Avg. household income, bottom 20%: $6,071 – #1,667 highest out of 1,789 cities
> Share of all income in Trenton that went to top 20%: 58.3% – #27 highest out of 1,789 cities
> Share of all income in Trenton that went to bottom 20%: 1.9% – #1,751 highest out of 1,789 cities
> Median household income: $37,002 – #1,733 highest out of 1,789 cities
[in-text-ad-2]
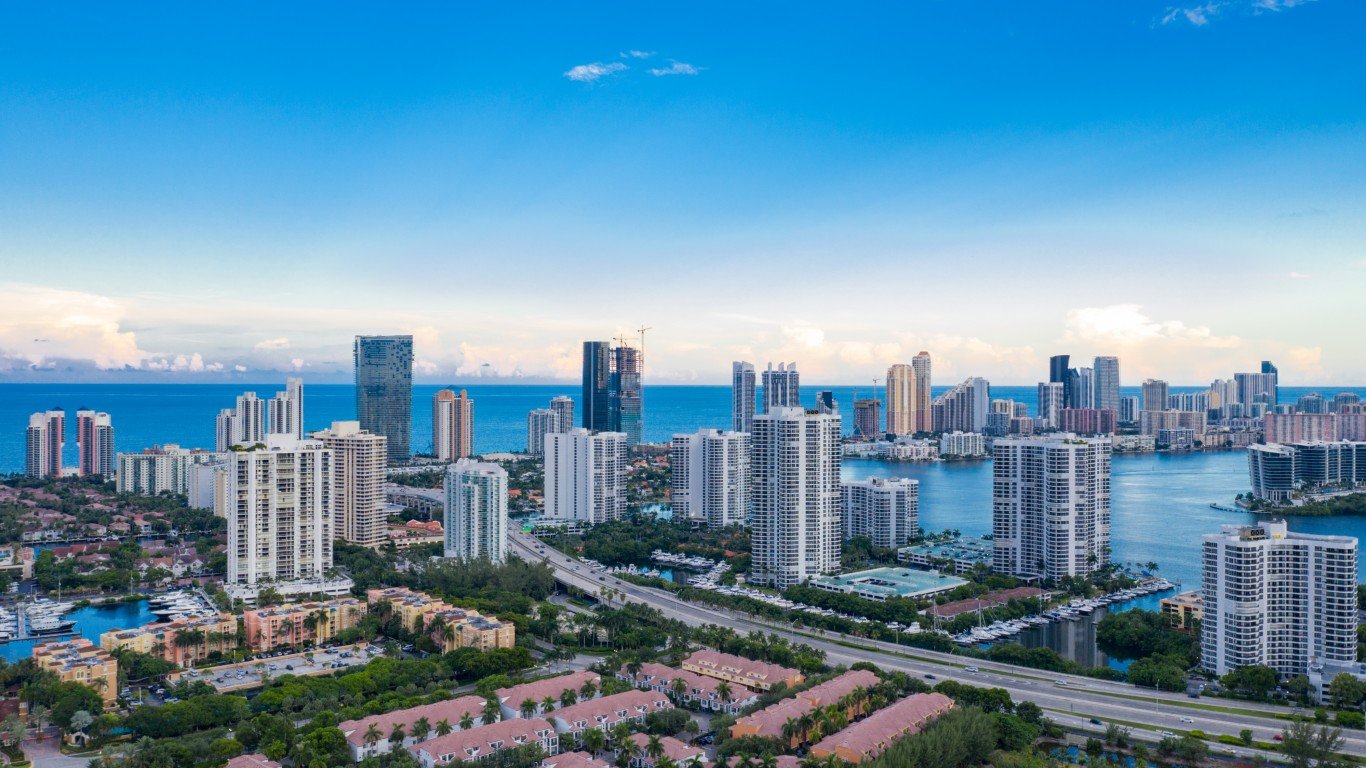
16. Aventura, Florida
> Gini Index: 0.57
> Avg. household income, top 20%: $341,511 – #181 highest out of 1,789 cities
> Avg. household income, bottom 20%: $11,374 – #1,319 highest out of 1,789 cities
> Share of all income in Aventura that went to top 20%: 60.0% – #13 highest out of 1,789 cities
> Share of all income in Aventura that went to bottom 20%: 2.0% – #1,742 highest out of 1,789 cities
> Median household income: $65,893 – #920 highest out of 1,789 cities

15. Starkville, Mississippi
> Gini Index: 0.57
> Avg. household income, top 20%: $180,534 – #1,137 highest out of 1,789 cities
> Avg. household income, bottom 20%: $4,467 – #1,684 highest out of 1,789 cities
> Share of all income in Starkville that went to top 20%: 58.7% – #23 highest out of 1,789 cities
> Share of all income in Starkville that went to bottom 20%: 1.5% – #1,776 highest out of 1,789 cities
> Median household income: $35,300 – #1,749 highest out of 1,789 cities
[in-text-ad]
14. Carbondale, Illinois
> Gini Index: 0.58
> Avg. household income, top 20%: $143,801 – #1,613 highest out of 1,789 cities
> Avg. household income, bottom 20%: $3,434 – #1,692 highest out of 1,789 cities
> Share of all income in Carbondale that went to top 20%: 60.9% – #9 highest out of 1,789 cities
> Share of all income in Carbondale that went to bottom 20%: 1.5% – #1,776 highest out of 1,789 cities
> Median household income: $24,093 – #1,788 highest out of 1,789 cities
[recirclink id=1025484]

13. Atlanta, Georgia
> Gini Index: 0.58
> Avg. household income, top 20%: $337,233 – #184 highest out of 1,789 cities
> Avg. household income, bottom 20%: $9,851 – #1,456 highest out of 1,789 cities
> Share of all income in Atlanta that went to top 20%: 60.8% – #10 highest out of 1,789 cities
> Share of all income in Atlanta that went to bottom 20%: 1.8% – #1,759 highest out of 1,789 cities
> Median household income: $64,179 – #967 highest out of 1,789 cities

12. University, Missouri
> Gini Index: 0.58
> Avg. household income, top 20%: $383,609 – #106 highest out of 1,789 cities
> Avg. household income, bottom 20%: $10,904 – #1,356 highest out of 1,789 cities
> Share of all income in University that went to top 20%: 61.5% – #6 highest out of 1,789 cities
> Share of all income in University that went to bottom 20%: 1.8% – #1,762 highest out of 1,789 cities
> Median household income: $66,466 – #896 highest out of 1,789 cities
[in-text-ad-2]
11. Millville, New Jersey
> Gini Index: 0.58
> Avg. household income, top 20%: $299,607 – #269 highest out of 1,789 cities
> Avg. household income, bottom 20%: $9,478 – #1,485 highest out of 1,789 cities
> Share of all income in Millville that went to top 20%: 60.0% – #14 highest out of 1,789 cities
> Share of all income in Millville that went to bottom 20%: 2.0% – #1,748 highest out of 1,789 cities
> Median household income: $63,182 – #997 highest out of 1,789 cities

10. Winter Park, Florida
> Gini Index: 0.58
> Avg. household income, top 20%: $459,501 – #50 highest out of 1,789 cities
> Avg. household income, bottom 20%: $14,514 – #980 highest out of 1,789 cities
> Share of all income in Winter Park that went to top 20%: 61.4% – #7 highest out of 1,789 cities
> Share of all income in Winter Park that went to bottom 20%: 1.9% – #1,749 highest out of 1,789 cities
> Median household income: $80,500 – #582 highest out of 1,789 cities
[in-text-ad]

9. Beverly Hills, California
> Gini Index: 0.59
> Avg. household income, top 20%: $601,097 – #23 highest out of 1,789 cities
> Avg. household income, bottom 20%: $16,831 – #770 highest out of 1,789 cities
> Share of all income in Beverly Hills that went to top 20%: 62.4% – #3 highest out of 1,789 cities
> Share of all income in Beverly Hills that went to bottom 20%: 1.8% – #1,762 highest out of 1,789 cities
> Median household income: $101,241 – #278 highest out of 1,789 cities
[recirclink id=1041570]
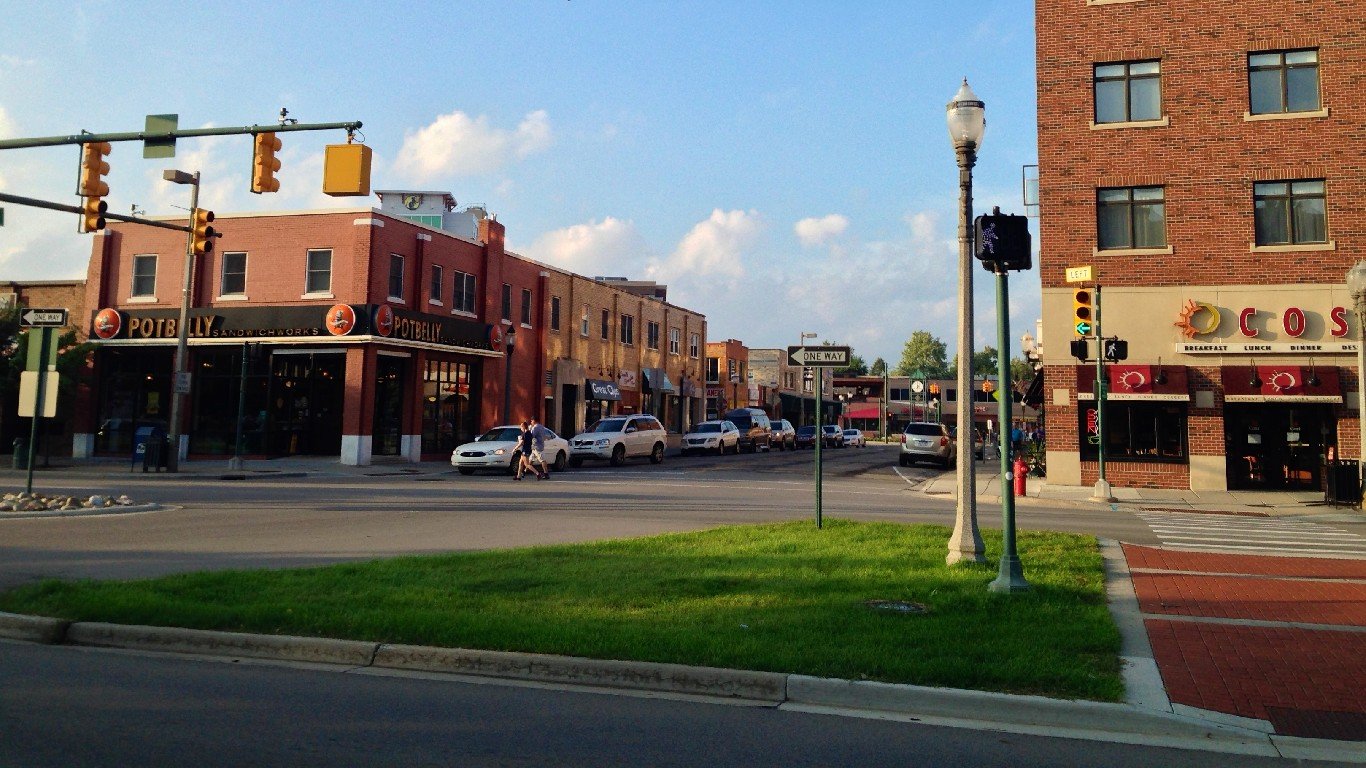
8. East Lansing, Michigan
> Gini Index: 0.59
> Avg. household income, top 20%: $236,383 – #592 highest out of 1,789 cities
> Avg. household income, bottom 20%: $5,359 – #1,677 highest out of 1,789 cities
> Share of all income in East Lansing that went to top 20%: 60.6% – #12 highest out of 1,789 cities
> Share of all income in East Lansing that went to bottom 20%: 1.4% – #1,780 highest out of 1,789 cities
> Median household income: $40,800 – #1,674 highest out of 1,789 cities

7. Rexburg, Idaho
> Gini Index: 0.59
> Avg. household income, top 20%: $204,653 – #848 highest out of 1,789 cities
> Avg. household income, bottom 20%: $8,925 – #1,527 highest out of 1,789 cities
> Share of all income in Rexburg that went to top 20%: 62.2% – #5 highest out of 1,789 cities
> Share of all income in Rexburg that went to bottom 20%: 2.7% – #1,601 highest out of 1,789 cities
> Median household income: $33,278 – #1,764 highest out of 1,789 cities
[in-text-ad-2]

6. Blacksburg, Virginia
> Gini Index: 0.59
> Avg. household income, top 20%: $209,307 – #796 highest out of 1,789 cities
> Avg. household income, bottom 20%: $1,427 – #1,697 highest out of 1,789 cities
> Share of all income in Blacksburg that went to top 20%: 59.7% – #15 highest out of 1,789 cities
> Share of all income in Blacksburg that went to bottom 20%: 0.4% – #1,789 highest out of 1,789 cities
> Median household income: $41,711 – #1,653 highest out of 1,789 cities
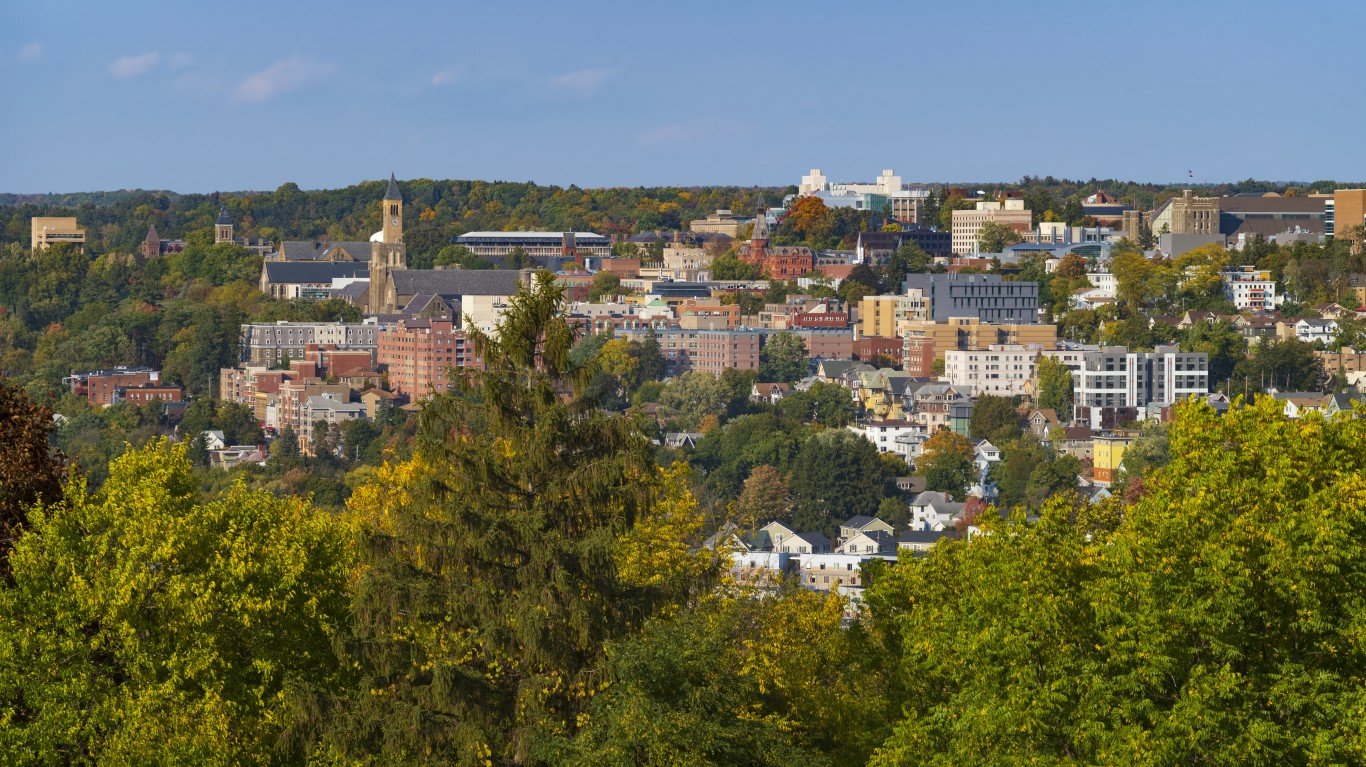
5. Ithaca, New York
> Gini Index: 0.59
> Avg. household income, top 20%: $193,757 – #976 highest out of 1,789 cities
> Avg. household income, bottom 20%: $2,911 – #1,696 highest out of 1,789 cities
> Share of all income in Ithaca that went to top 20%: 61.1% – #8 highest out of 1,789 cities
> Share of all income in Ithaca that went to bottom 20%: 0.9% – #1,787 highest out of 1,789 cities
> Median household income: $38,019 – #1,714 highest out of 1,789 cities
[in-text-ad]

4. West Lafayette, Indiana
> Gini Index: 0.59
> Avg. household income, top 20%: $193,593 – #982 highest out of 1,789 cities
> Avg. household income, bottom 20%: $3,075 – #1,694 highest out of 1,789 cities
> Share of all income in West Lafayette that went to top 20%: 60.7% – #11 highest out of 1,789 cities
> Share of all income in West Lafayette that went to bottom 20%: 1.0% – #1,786 highest out of 1,789 cities
> Median household income: $31,460 – #1,775 highest out of 1,789 cities
[recirclink id=1051431]
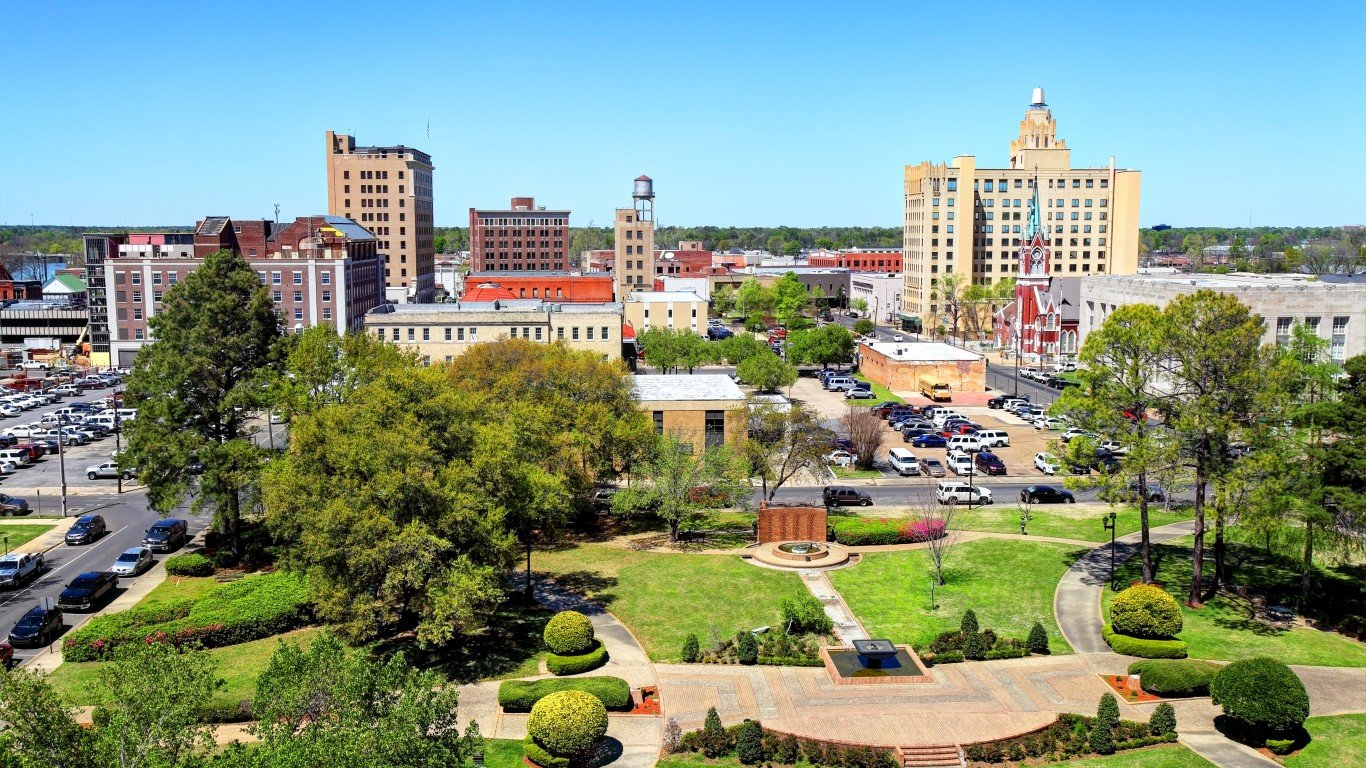
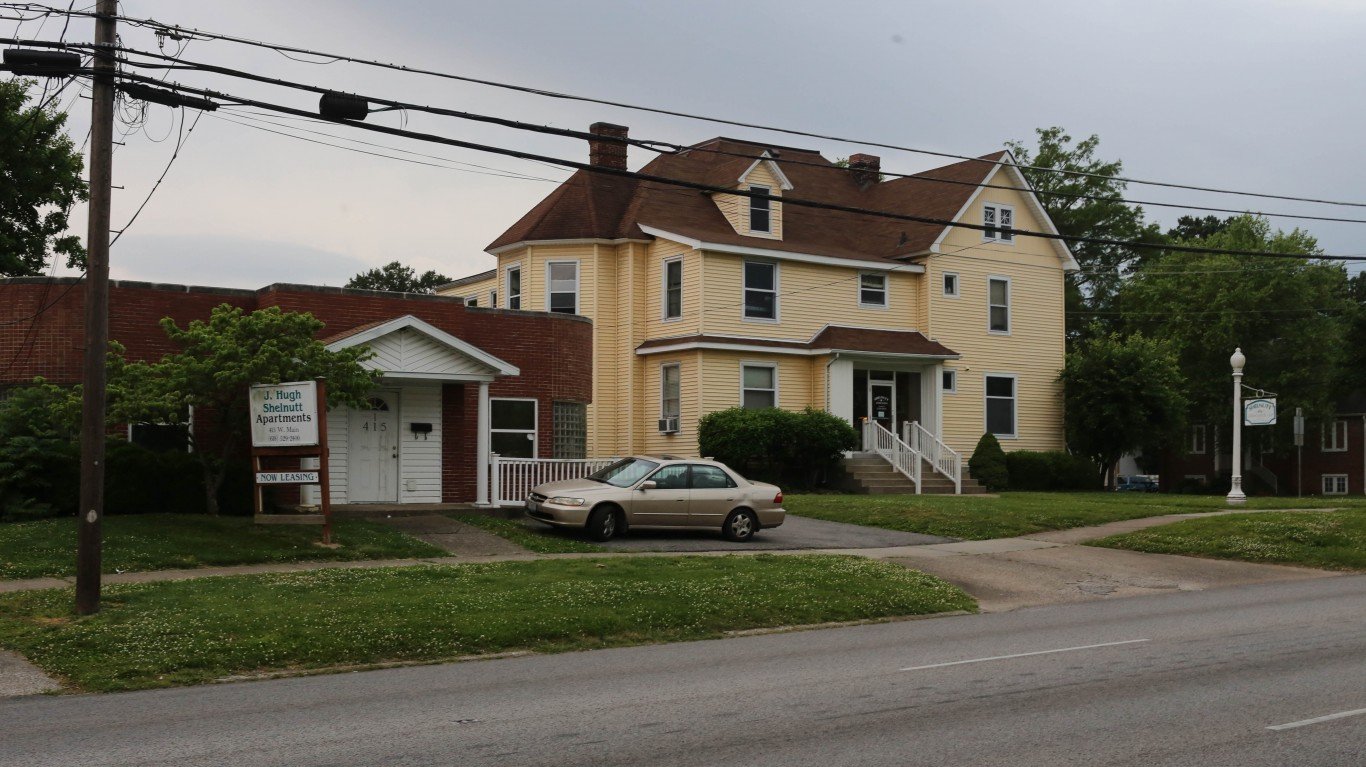
3. Monroe, Louisiana
> Gini Index: 0.59
> Avg. household income, top 20%: $177,305 – #1,193 highest out of 1,789 cities
> Avg. household income, bottom 20%: $4,501 – #1,683 highest out of 1,789 cities
> Share of all income in Monroe that went to top 20%: 62.4% – #4 highest out of 1,789 cities
> Share of all income in Monroe that went to bottom 20%: 1.6% – #1,773 highest out of 1,789 cities
> Median household income: $31,926 – #1,773 highest out of 1,789 cities

2. Miami Beach, Florida
> Gini Index: 0.60
> Avg. household income, top 20%: $345,425 – #170 highest out of 1,789 cities
> Avg. household income, bottom 20%: $11,066 – #1,344 highest out of 1,789 cities
> Share of all income in Miami Beach that went to top 20%: 63.1% – #1 highest out of 1,789 cities
> Share of all income in Miami Beach that went to bottom 20%: 2.0% – #1,739 highest out of 1,789 cities
> Median household income: $57,211 – #1,152 highest out of 1,789 cities
[in-text-ad-2]

1. Poughkeepsie, New York
> Gini Index: 0.60
> Avg. household income, top 20%: $283,549 – #325 highest out of 1,789 cities
> Avg. household income, bottom 20%: $9,404 – #1,491 highest out of 1,789 cities
> Share of all income in Poughkeepsie that went to top 20%: 63.1% – #2 highest out of 1,789 cities
> Share of all income in Poughkeepsie that went to bottom 20%: 2.1% – #1,731 highest out of 1,789 cities
> Median household income: $47,008 – #1,508 highest out of 1,789 cities
Methodology
To determine the 50 U.S. cities with the widest income gaps, 24/7 Wall St. used data from the U.S. Census Bureau’s 2020 American Community Survey. Cities are ranked by their Gini coefficient, a measure of income inequality based on the distribution of income across a population on a 0 to 1 scale, with 0 representing perfect equality and 1 representing the highest possible level of inequality. For the purposes of this story, cities are defined as any place covered by the census with populations over 25,000.
Additional information on average household income by quintile, share of aggregate household income by quintile, and median household income are five-year estimates from the 2020 ACS.
Contact [email protected] for any questions or corrections.