The number of American workers working from home – particularly those in white collar jobs – skyrocketed during the pandemic. The shift has proved to be a positive development in some ways. A recent Gallup study found that over 90% of remote workers hope that the trend continues after the pandemic, citing the lack of commute time as the chief benefit.
Still, for a large share of the workforce, remote work is not an option. Gallup reports that 55% full-time employees in the United States do not work remotely – and commute time still makes up a significant portion of their day. (Here is a look at the state where the most people are working from home.)
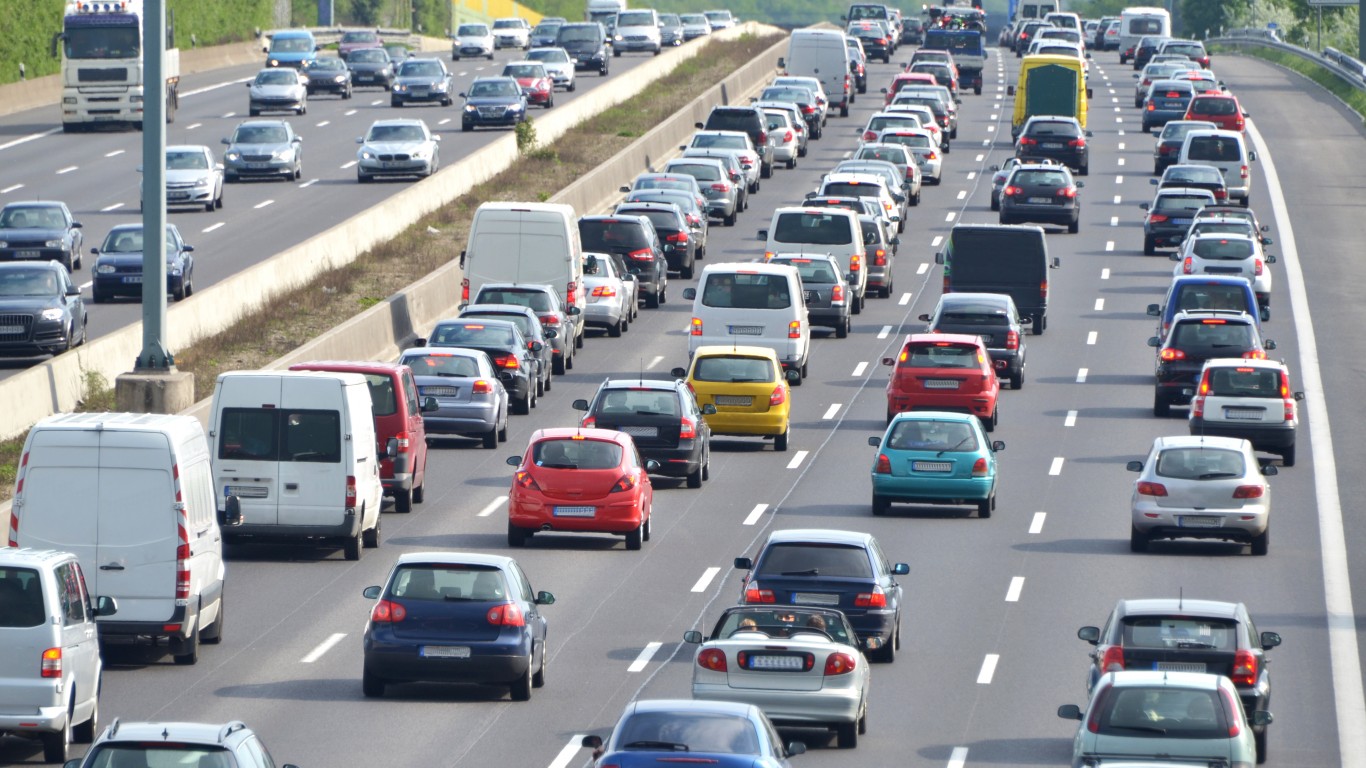
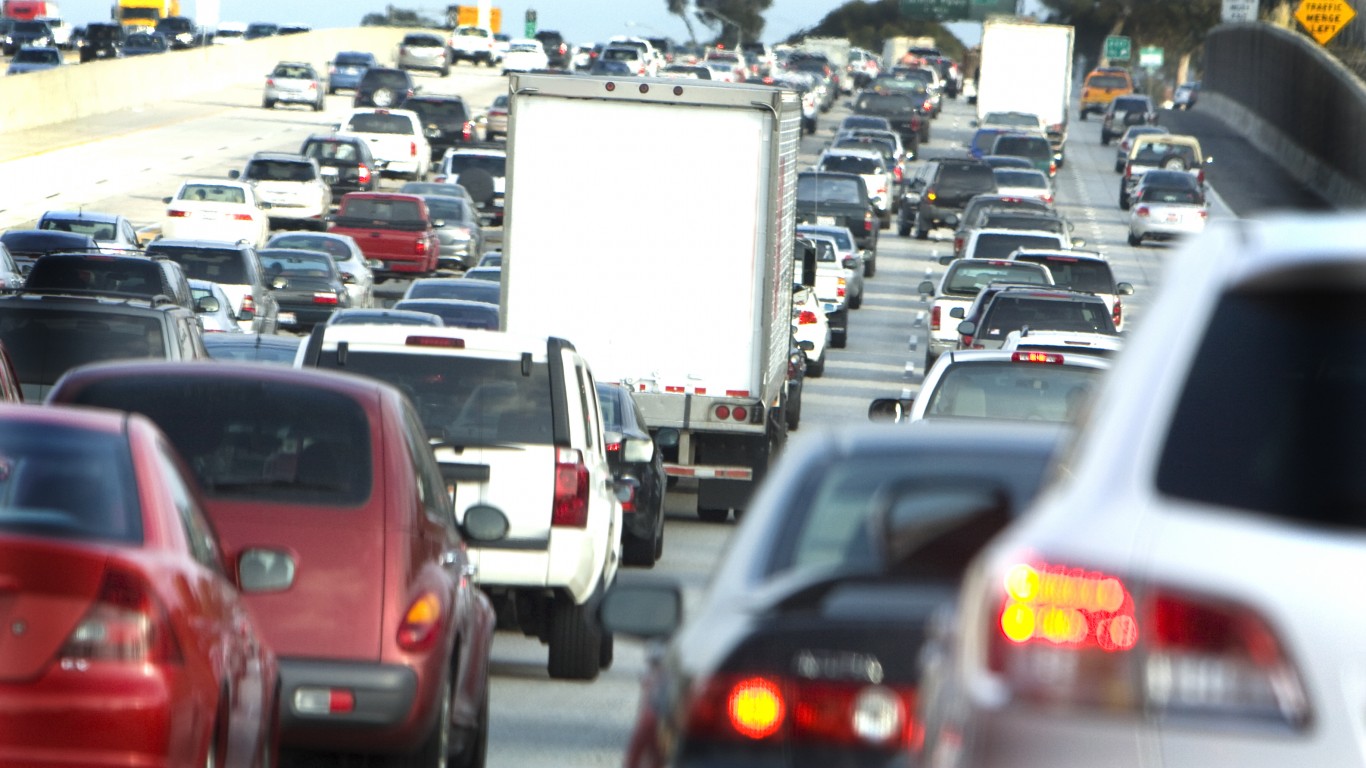
According to the U.S. Census Bureau, the average commute time in the United States is 26.9 minutes. For those who travel to and from work every Monday through Friday, this translates to about 4.5 hours per week, or nearly 10 days a year.
Of course, commute times vary from person to person, but in some parts of the country, workers who are still commuting tend to have far less travel time than others. Using census data, 24/7 Wall St. identified the 50 U.S. cities with the shortest commutes.
In every city on this list, average commute times are about 15 minutes or less. This adds up to less than three hours per week, and less than six days per year.
The largest share of cities on this list are in the Midwest, including six in Illinois alone. In most of these cities the share of commuters using public transit is below the 4.6% national average. In most cases, public transportation is less direct than simply driving from door to door, adding to overall commute time. Here is a look at the cities where people lose the most time driving each year.
Click here to see the cities with the shortest commutes
Click here to see our detailed methodology
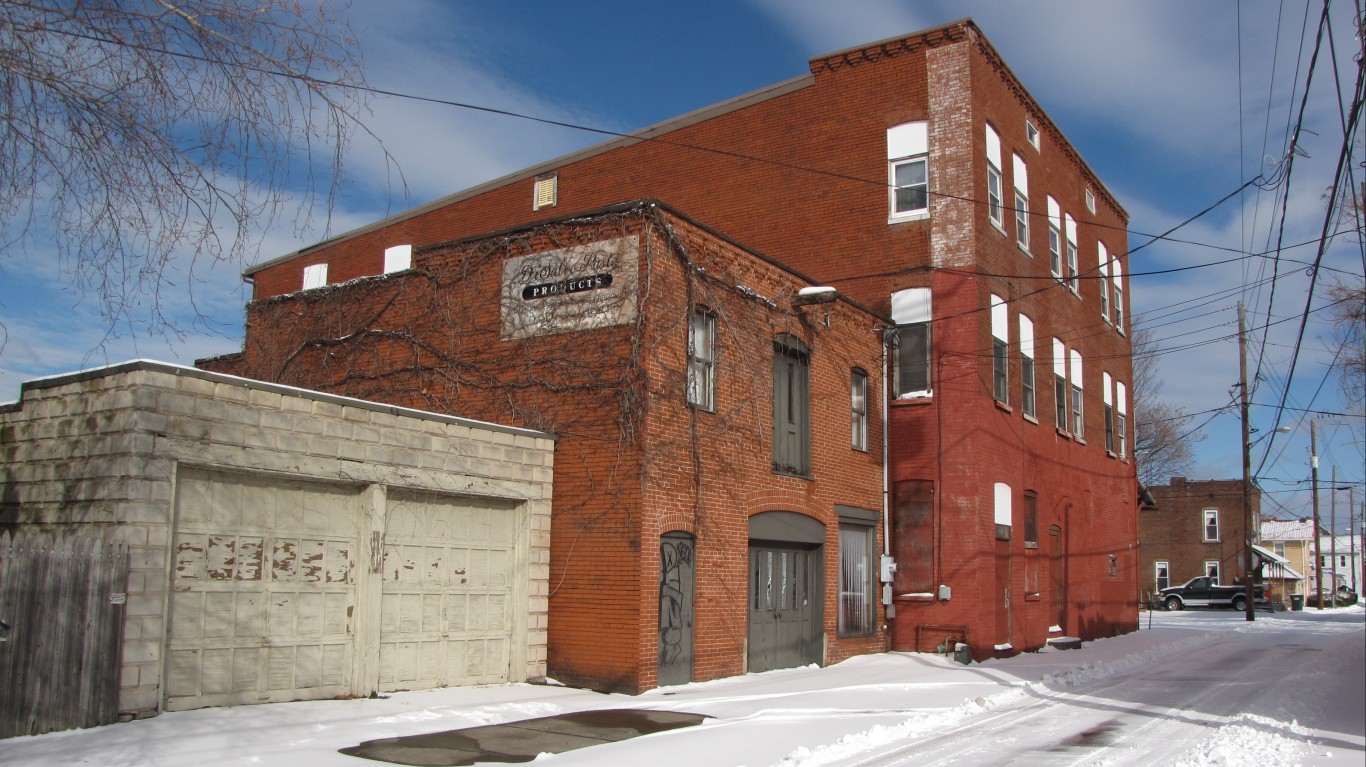
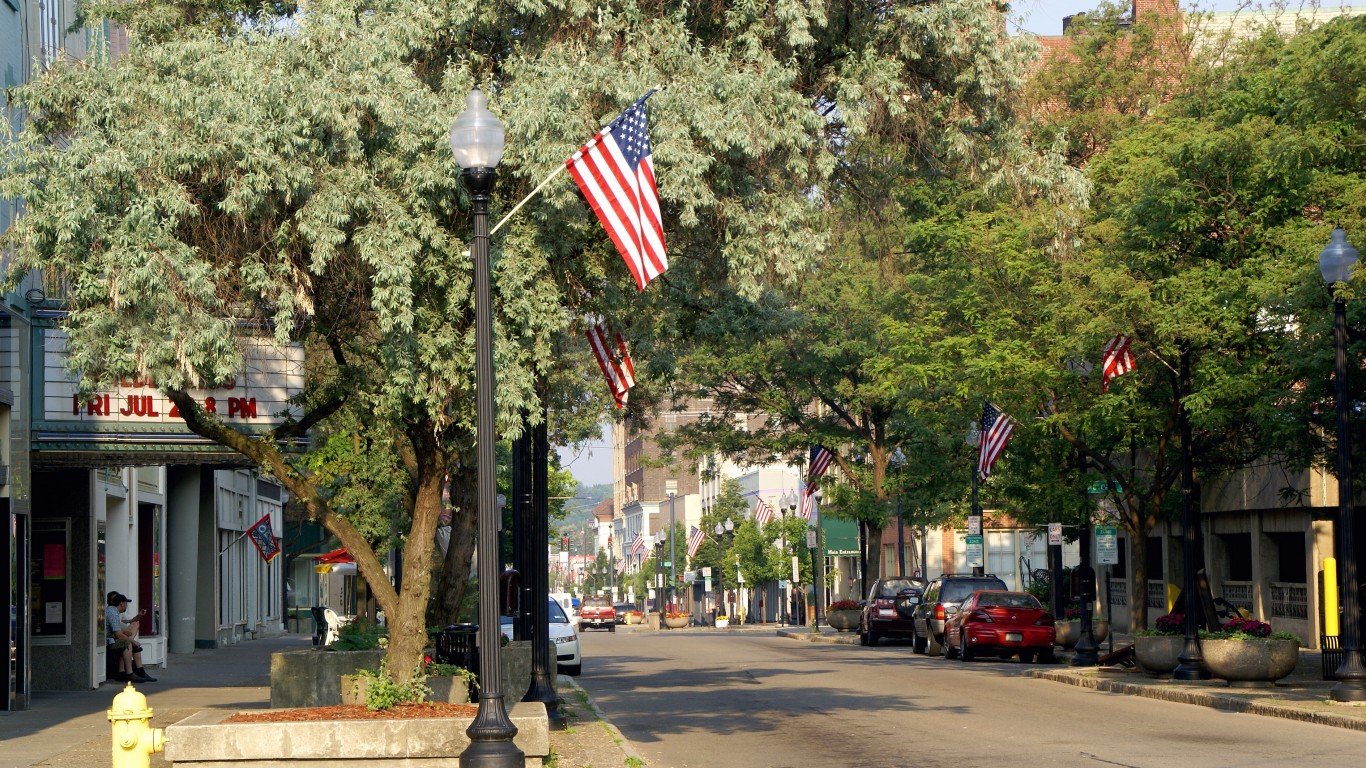
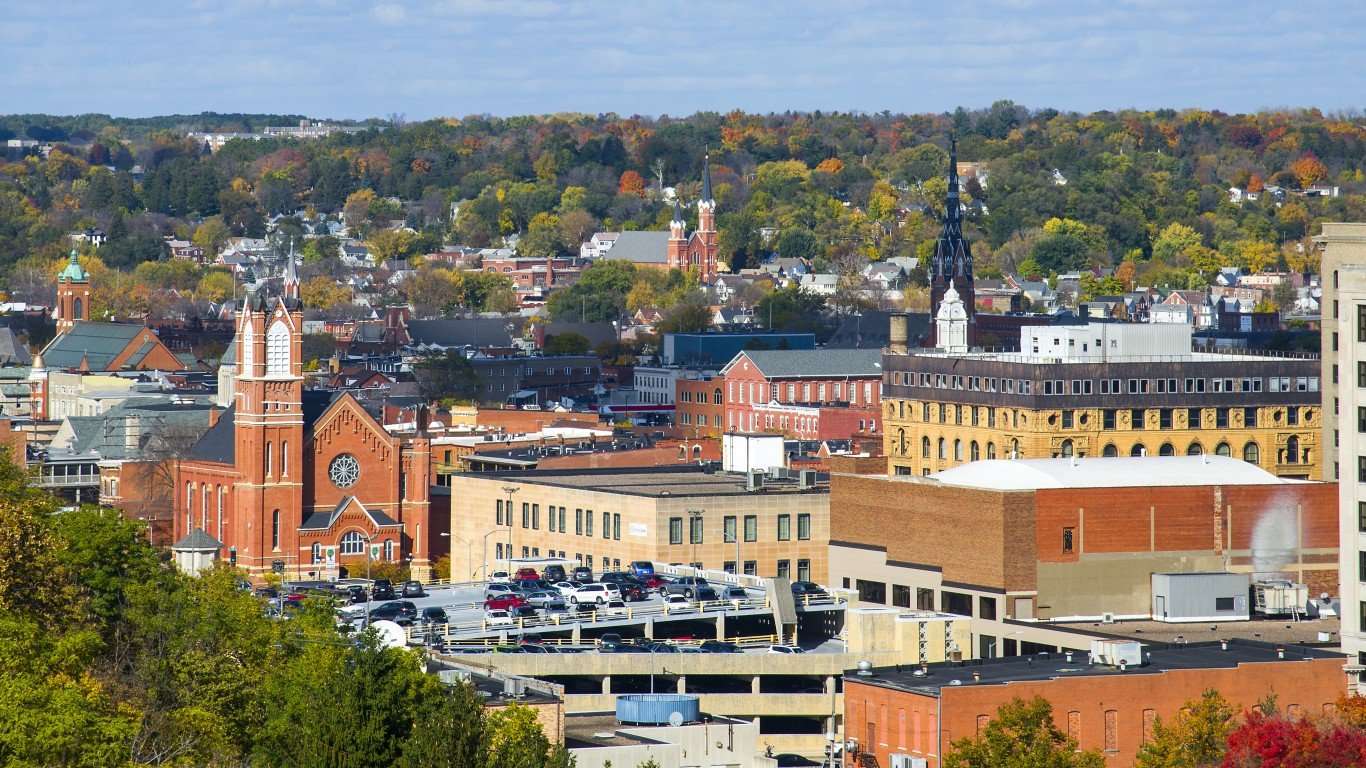
50. Williamsport, Pennsylvania
> Avg. commute time (minutes): 15.6
> Share of commuters driving alone: 69.3% — 275th lowest of 1,789 cities
> Share of commuters carpooling: 10.0% — 653rd highest of 1,789 cities
> Share of commuters using public transit: 3.2% — 517th highest of 1,789 cities
[in-text-ad]

49. Moscow, Idaho
> Avg. commute time (minutes): 15.6
> Share of commuters driving alone: 60.3% — 103rd lowest of 1,789 cities
> Share of commuters carpooling: 10.7% — 480th highest of 1,789 cities
> Share of commuters using public transit: 1.3% — 814th lowest of 1,789 cities
[recirclink id=987778]
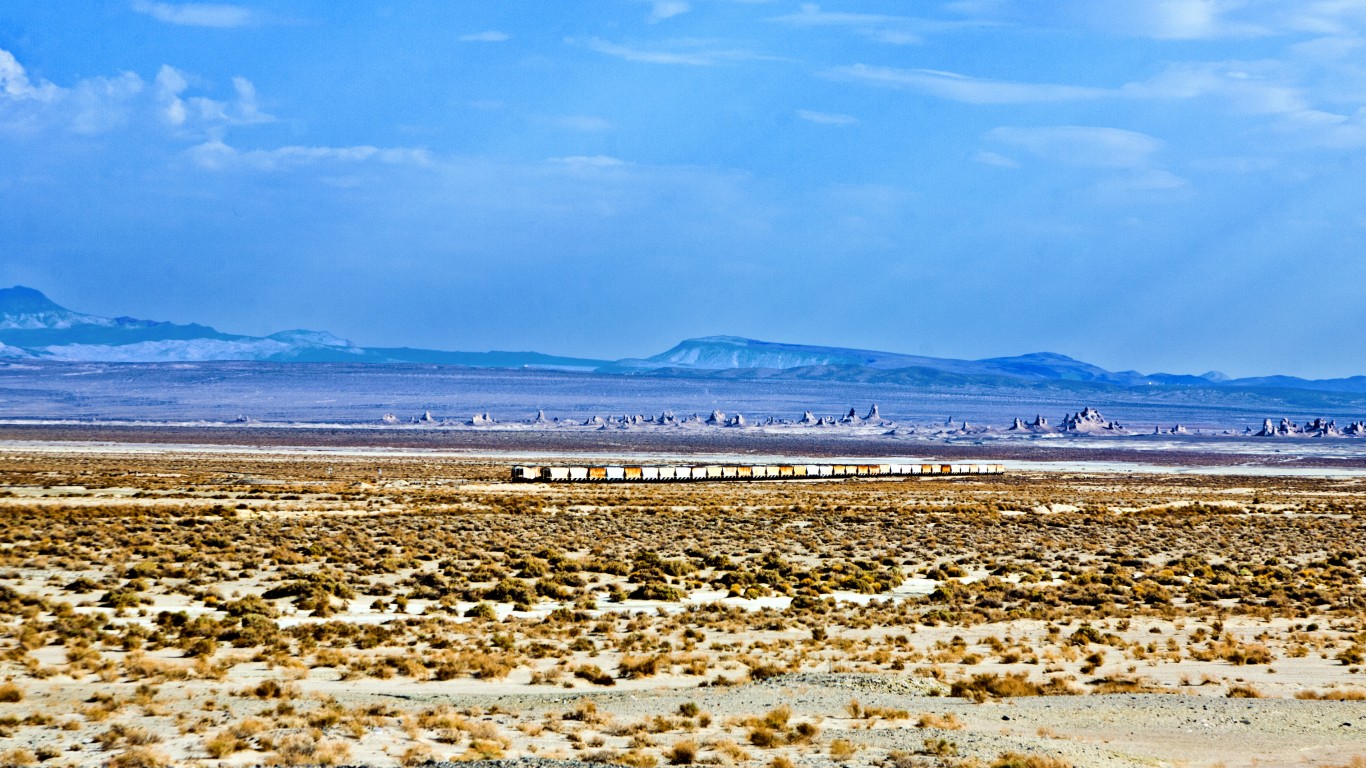
48. Ridgecrest, California
> Avg. commute time (minutes): 15.6
> Share of commuters driving alone: 72.1% — 393rd lowest of 1,789 cities
> Share of commuters carpooling: 14.8% — 83rd highest of 1,789 cities
> Share of commuters using public transit: 0.1% — 128th lowest of 1,789 cities
47. Cedar Falls, Iowa
> Avg. commute time (minutes): 15.5
> Share of commuters driving alone: 79.8% — 616th highest of 1,789 cities
> Share of commuters carpooling: 4.8% — 73rd lowest of 1,789 cities
> Share of commuters using public transit: 0.2% — 170th lowest of 1,789 cities
[in-text-ad-2]

46. Manitowoc, Wisconsin
> Avg. commute time (minutes): 15.5
> Share of commuters driving alone: 81.9% — 361st highest of 1,789 cities
> Share of commuters carpooling: 7.3% — 454th lowest of 1,789 cities
> Share of commuters using public transit: 0.6% — 500th lowest of 1,789 cities
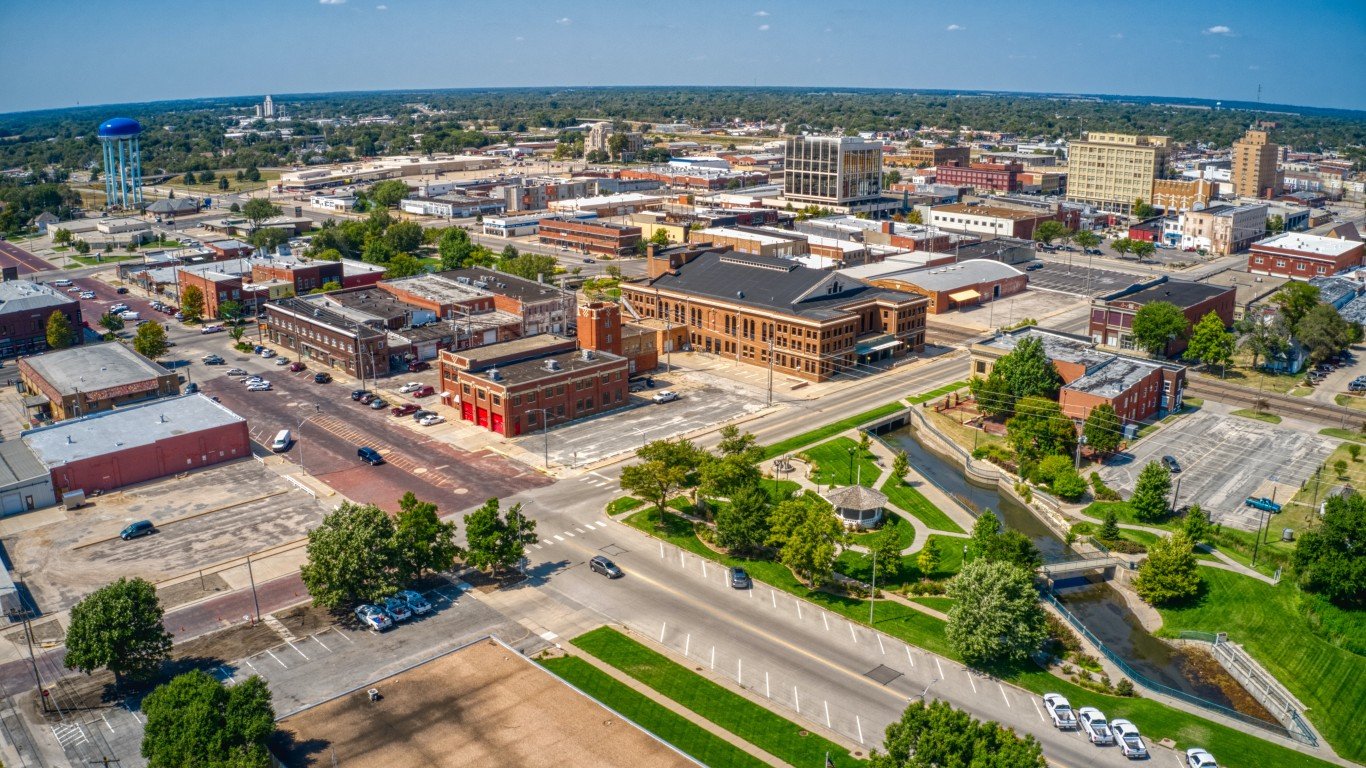
45. Hutchinson, Kansas
> Avg. commute time (minutes): 15.5
> Share of commuters driving alone: 83.5% — 201st highest of 1,789 cities
> Share of commuters carpooling: 9.4% — 806th highest of 1,789 cities
> Share of commuters using public transit: 0.3% — 300th lowest of 1,789 cities
[in-text-ad]
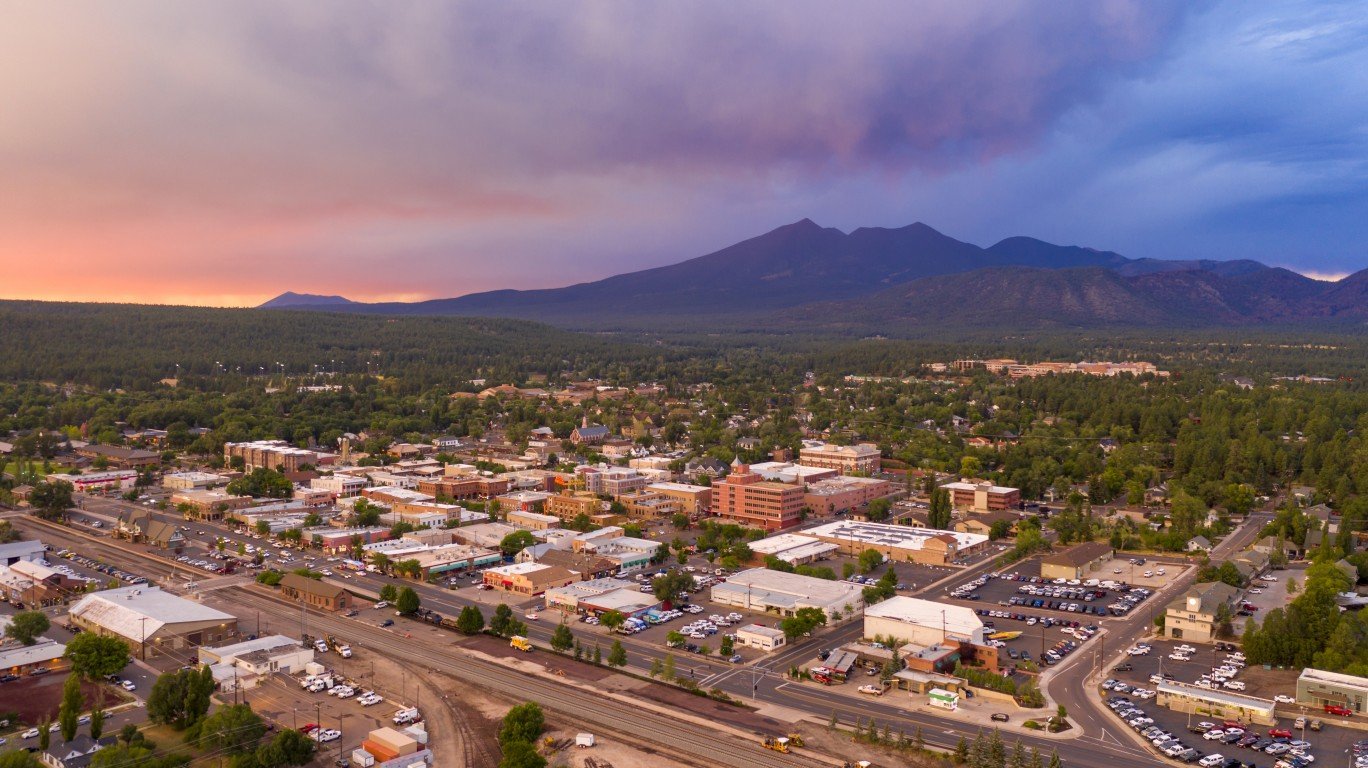
44. Flagstaff, Arizona
> Avg. commute time (minutes): 15.4
> Share of commuters driving alone: 67.4% — 220th lowest of 1,789 cities
> Share of commuters carpooling: 10.0% — 634th highest of 1,789 cities
> Share of commuters using public transit: 1.8% — 811th highest of 1,789 cities
[recirclink id=1044820]

43. Juneau, Alaska
> Avg. commute time (minutes): 15.3
> Share of commuters driving alone: 66.5% — 196th lowest of 1,789 cities
> Share of commuters carpooling: 13.0% — 192nd highest of 1,789 cities
> Share of commuters using public transit: 3.4% — 501st highest of 1,789 cities
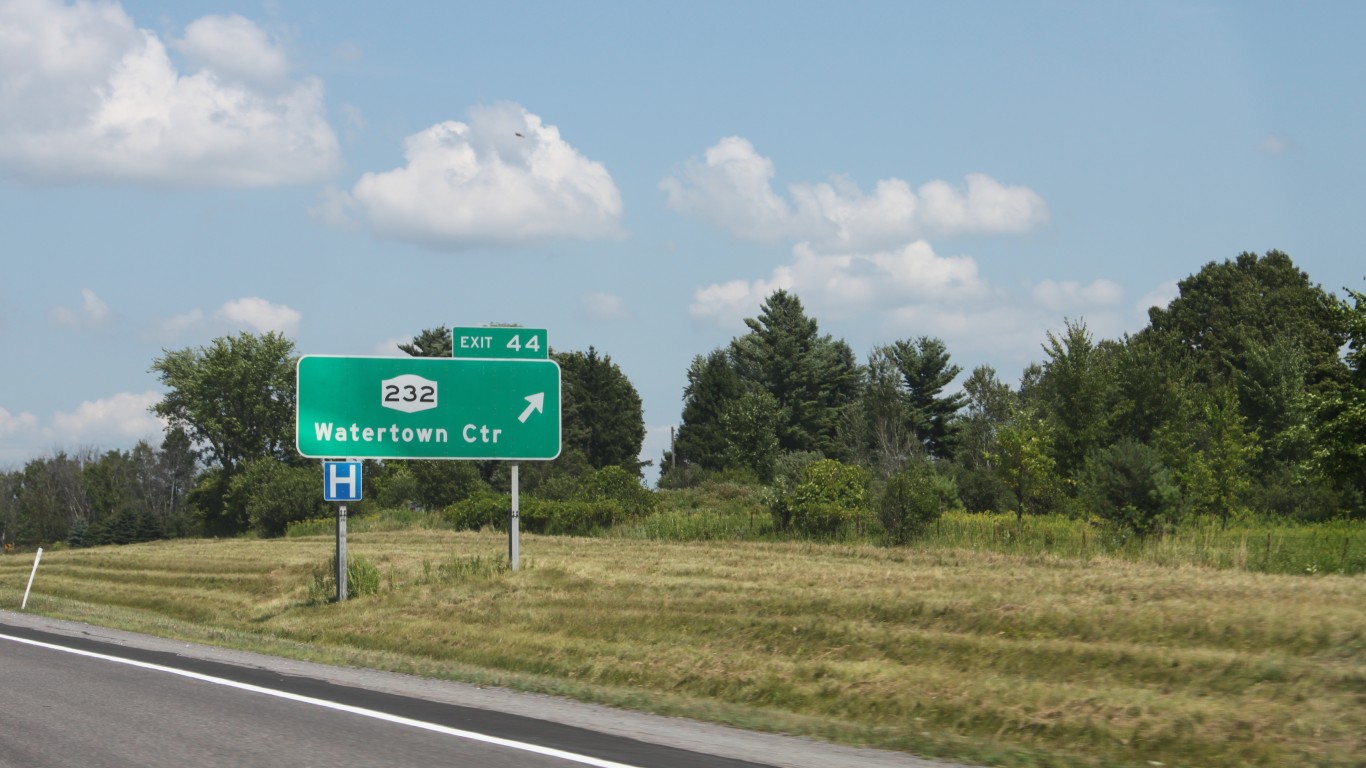
42. Watertown, New York
> Avg. commute time (minutes): 15.3
> Share of commuters driving alone: 79.2% — 705th highest of 1,789 cities
> Share of commuters carpooling: 9.1% — 877th highest of 1,789 cities
> Share of commuters using public transit: 2.1% — 751st highest of 1,789 cities
[in-text-ad-2]

41. Urbana, Illinois
> Avg. commute time (minutes): 15.3
> Share of commuters driving alone: 53.6% — 49th lowest of 1,789 cities
> Share of commuters carpooling: 6.8% — 345th lowest of 1,789 cities
> Share of commuters using public transit: 11.3% — 112th highest of 1,789 cities

40. St. George, Utah
> Avg. commute time (minutes): 15.3
> Share of commuters driving alone: 77.0% — 799th lowest of 1,789 cities
> Share of commuters carpooling: 9.8% — 707th highest of 1,789 cities
> Share of commuters using public transit: 0.4% — 343rd lowest of 1,789 cities
[in-text-ad]

39. Eureka, California
> Avg. commute time (minutes): 15.3
> Share of commuters driving alone: 73.9% — 517th lowest of 1,789 cities
> Share of commuters carpooling: 11.4% — 354th highest of 1,789 cities
> Share of commuters using public transit: 1.0% — 707th lowest of 1,789 cities
[recirclink id=1054986]

38. San Luis Obispo, California
> Avg. commute time (minutes): 15.3
> Share of commuters driving alone: 69.4% — 278th lowest of 1,789 cities
> Share of commuters carpooling: 6.4% — 276th lowest of 1,789 cities
> Share of commuters using public transit: 2.1% — 744th highest of 1,789 cities
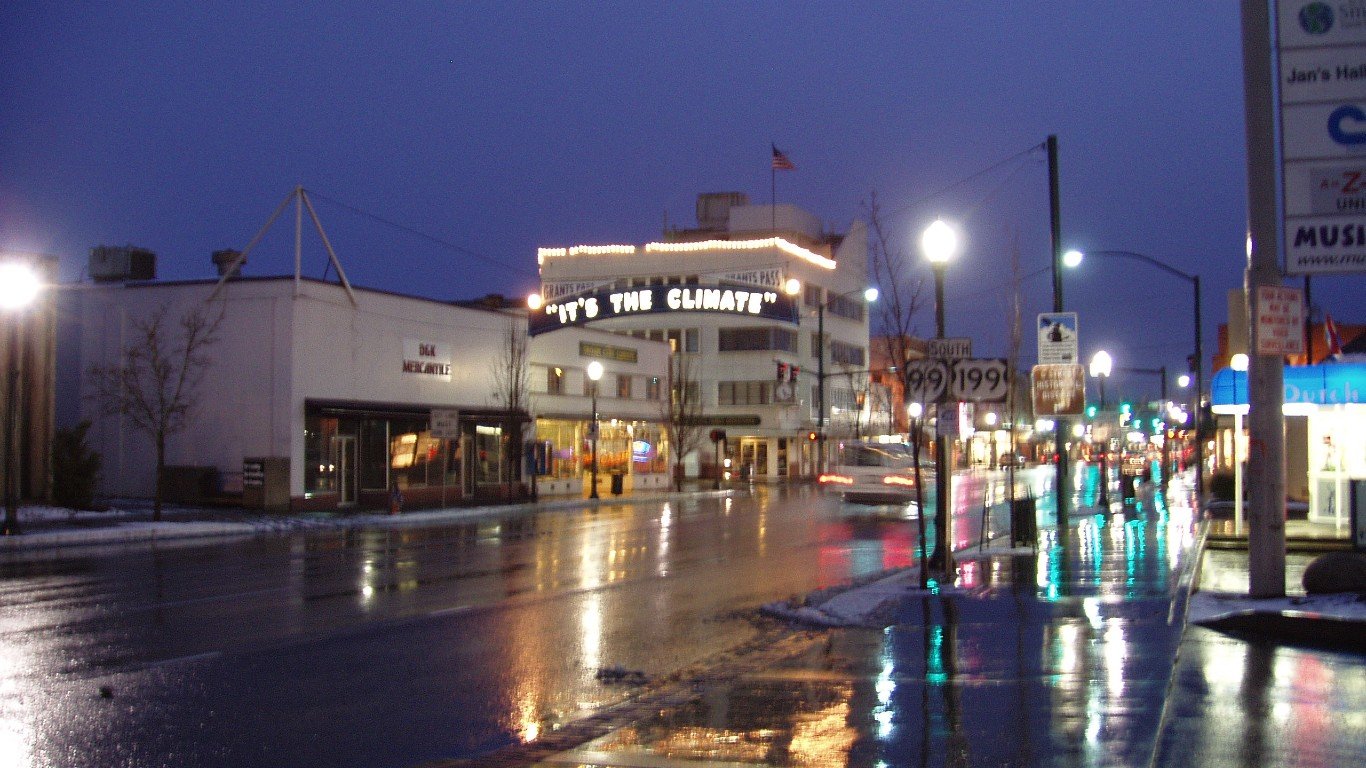
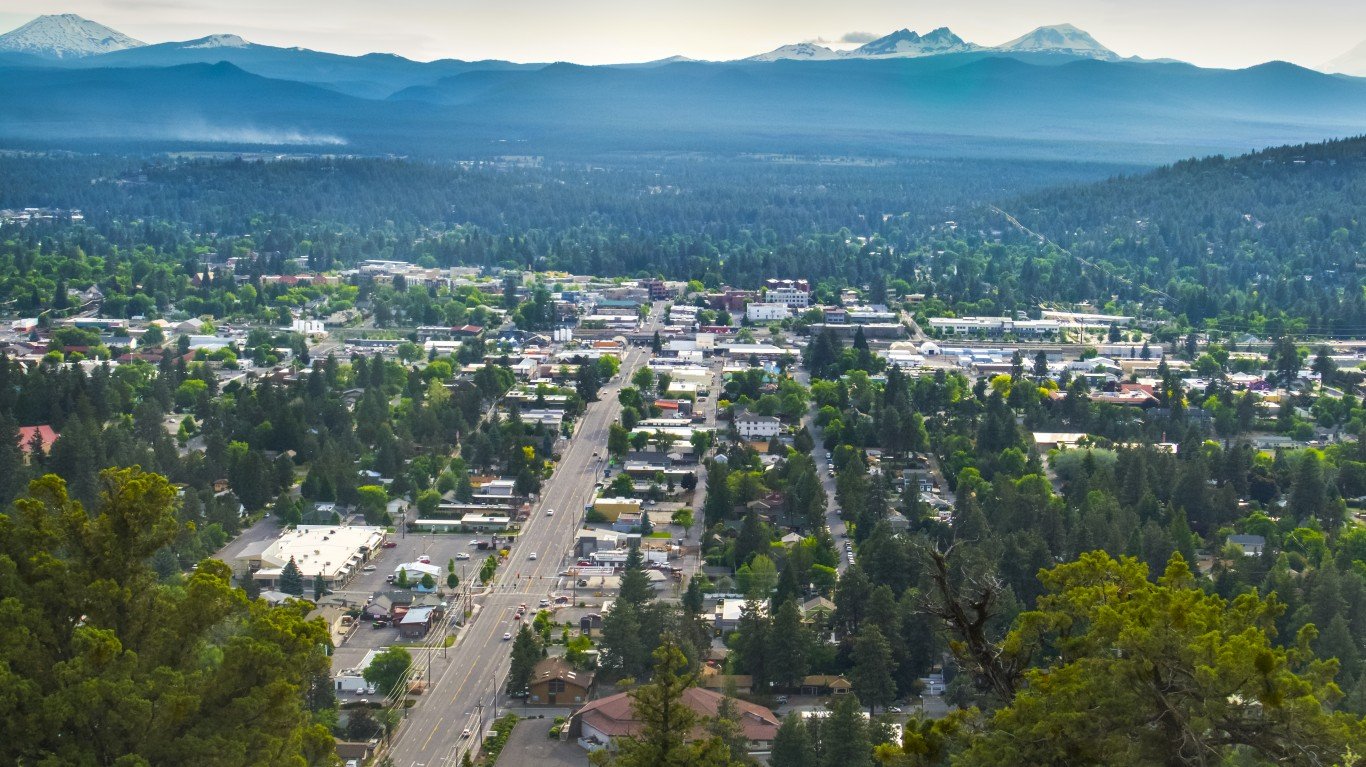
37. Grants Pass, Oregon
> Avg. commute time (minutes): 15.3
> Share of commuters driving alone: 76.3% — 736th lowest of 1,789 cities
> Share of commuters carpooling: 13.2% — 176th highest of 1,789 cities
> Share of commuters using public transit: 0.2% — 228th lowest of 1,789 cities
[in-text-ad-2]
36. Champaign, Illinois
> Avg. commute time (minutes): 15.2
> Share of commuters driving alone: 65.2% — 165th lowest of 1,789 cities
> Share of commuters carpooling: 9.3% — 827th highest of 1,789 cities
> Share of commuters using public transit: 6.4% — 281st highest of 1,789 cities
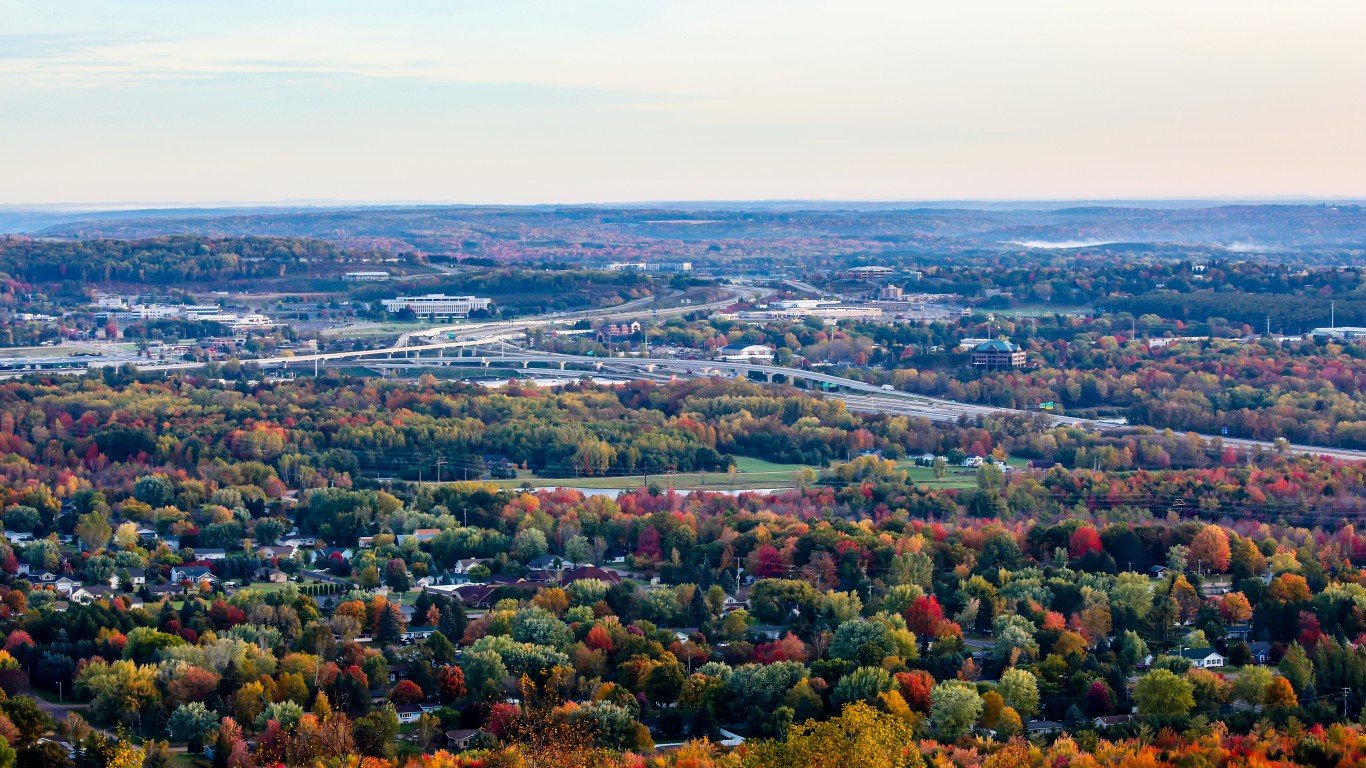
35. Wausau, Wisconsin
> Avg. commute time (minutes): 15.2
> Share of commuters driving alone: 77.4% — 857th lowest of 1,789 cities
> Share of commuters carpooling: 10.7% — 470th highest of 1,789 cities
> Share of commuters using public transit: 1.1% — 715th lowest of 1,789 cities
[in-text-ad]
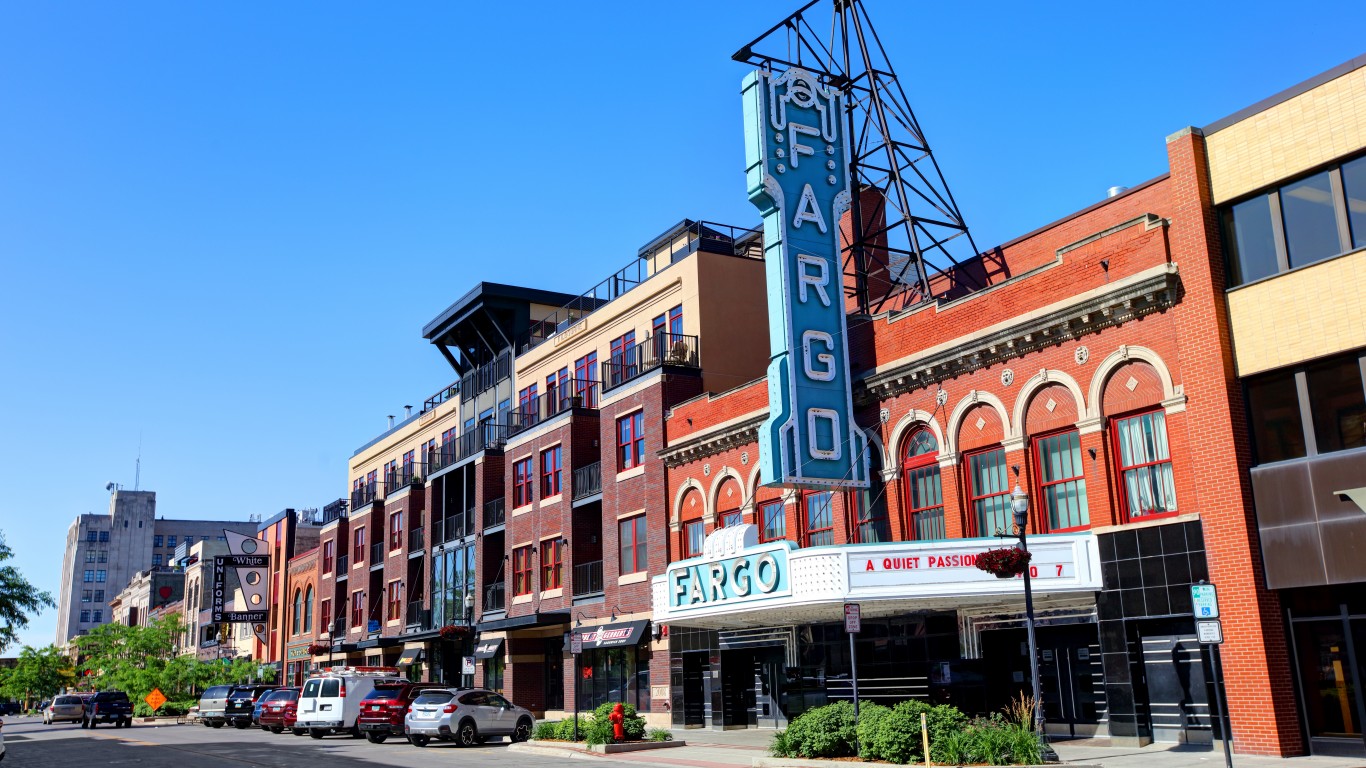
34. Fargo, North Dakota
> Avg. commute time (minutes): 15.2
> Share of commuters driving alone: 81.3% — 421st highest of 1,789 cities
> Share of commuters carpooling: 8.1% — 651st lowest of 1,789 cities
> Share of commuters using public transit: 1.3% — 780th lowest of 1,789 cities
[recirclink id=1060122]

33. Danville, Illinois
> Avg. commute time (minutes): 15.1
> Share of commuters driving alone: 78.7% — 762nd highest of 1,789 cities
> Share of commuters carpooling: 10.7% — 469th highest of 1,789 cities
> Share of commuters using public transit: 2.2% — 720th highest of 1,789 cities

32. Jacksonville, North Carolina
> Avg. commute time (minutes): 15.0
> Share of commuters driving alone: 60.8% — 109th lowest of 1,789 cities
> Share of commuters carpooling: 16.5% — 47th highest of 1,789 cities
> Share of commuters using public transit: 0.8% — 616th lowest of 1,789 cities
[in-text-ad-2]

31. Butte-Silver Bow, Montana
> Avg. commute time (minutes): 15.0
> Share of commuters driving alone: 80.4% — 529th highest of 1,789 cities
> Share of commuters carpooling: 10.0% — 641st highest of 1,789 cities
> Share of commuters using public transit: 0.9% — 630th lowest of 1,789 cities

30. Cheyenne, Wyoming
> Avg. commute time (minutes): 15.0
> Share of commuters driving alone: 82.9% — 264th highest of 1,789 cities
> Share of commuters carpooling: 9.6% — 737th highest of 1,789 cities
> Share of commuters using public transit: 0.3% — 247th lowest of 1,789 cities
[in-text-ad]
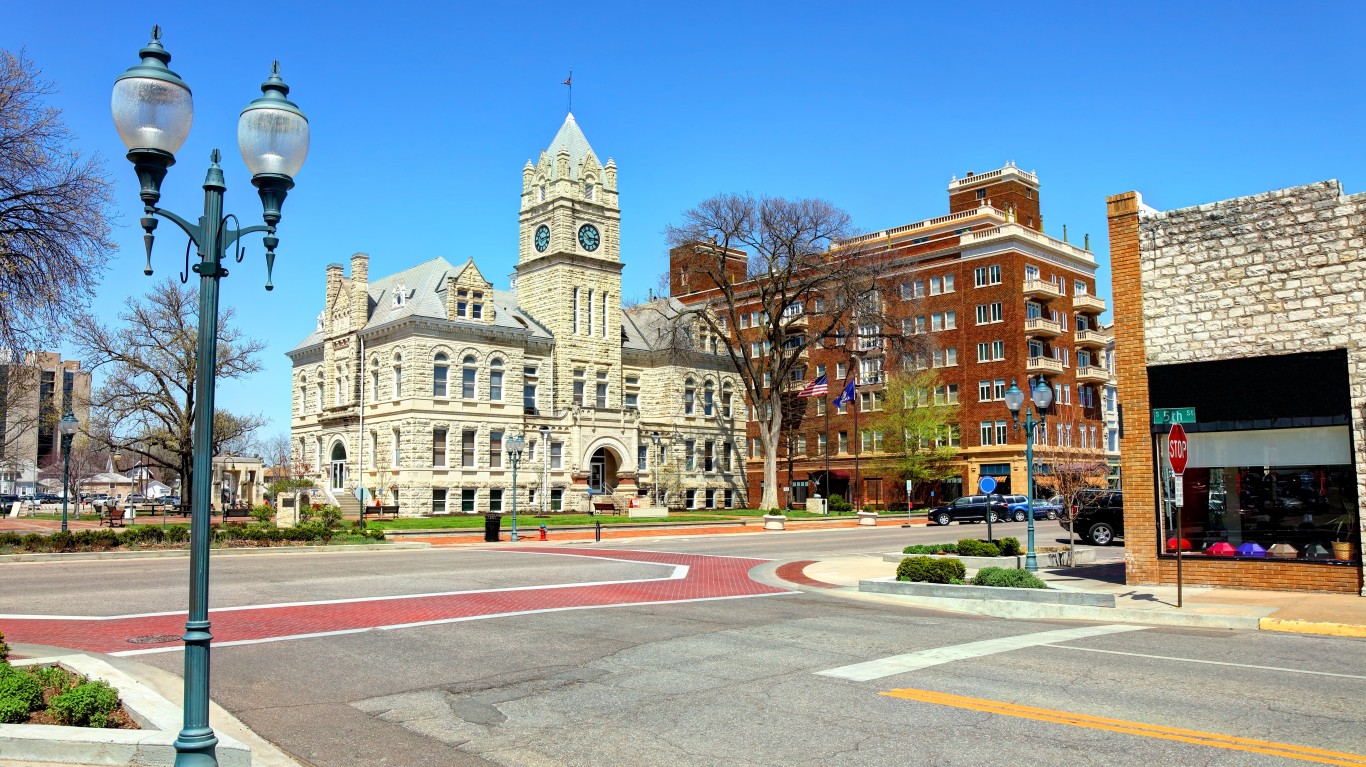
29. Manhattan, Kansas
> Avg. commute time (minutes): 15.0
> Share of commuters driving alone: 70.4% — 312th lowest of 1,789 cities
> Share of commuters carpooling: 9.7% — 730th highest of 1,789 cities
> Share of commuters using public transit: 0.2% — 213th lowest of 1,789 cities
[recirclink id=1024519]
28. Williston, North Dakota
> Avg. commute time (minutes): 15.0
> Share of commuters driving alone: 85.3% — 86th highest of 1,789 cities
> Share of commuters carpooling: 8.5% — 768th lowest of 1,789 cities
> Share of commuters using public transit: 0.1% — 106th lowest of 1,789 cities

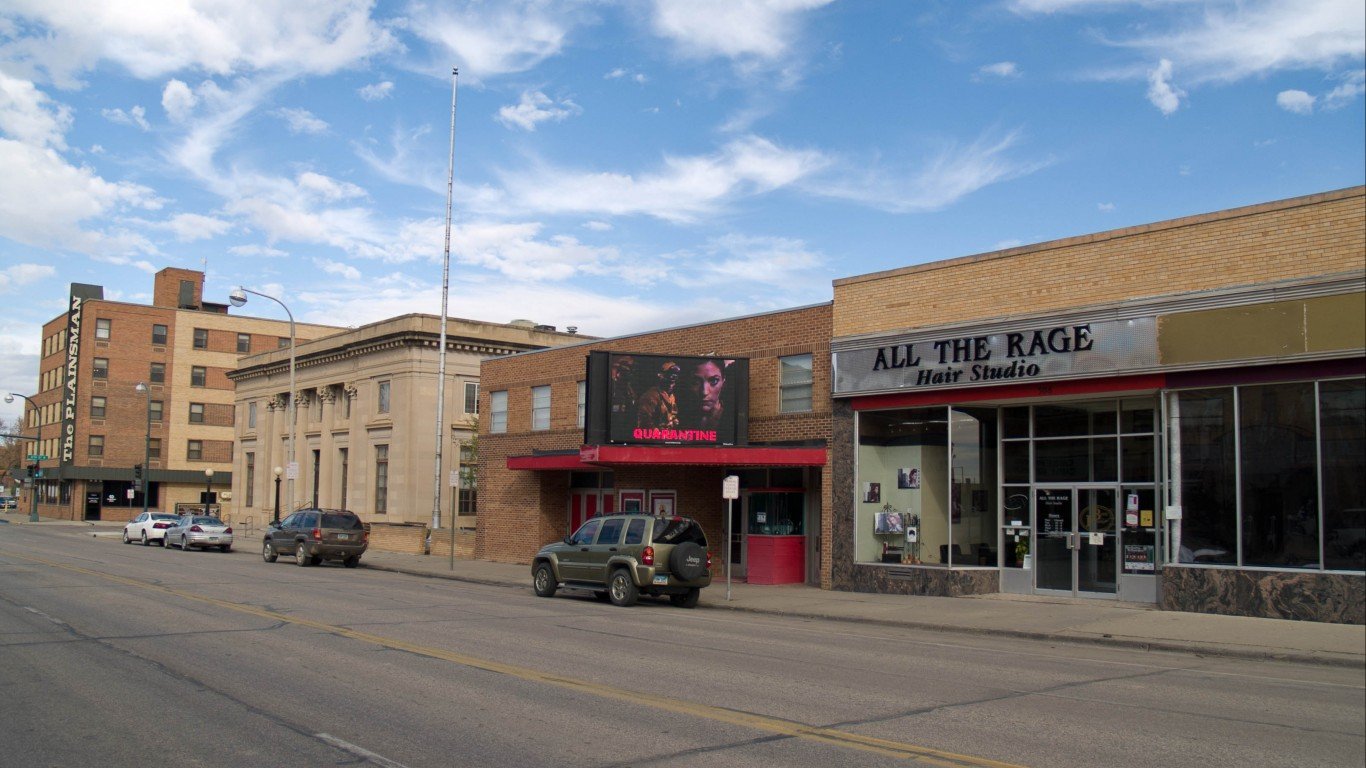
27. Great Falls, Montana
> Avg. commute time (minutes): 14.8
> Share of commuters driving alone: 81.8% — 371st highest of 1,789 cities
> Share of commuters carpooling: 9.3% — 813th highest of 1,789 cities
> Share of commuters using public transit: 0.9% — 625th lowest of 1,789 cities
[in-text-ad-2]
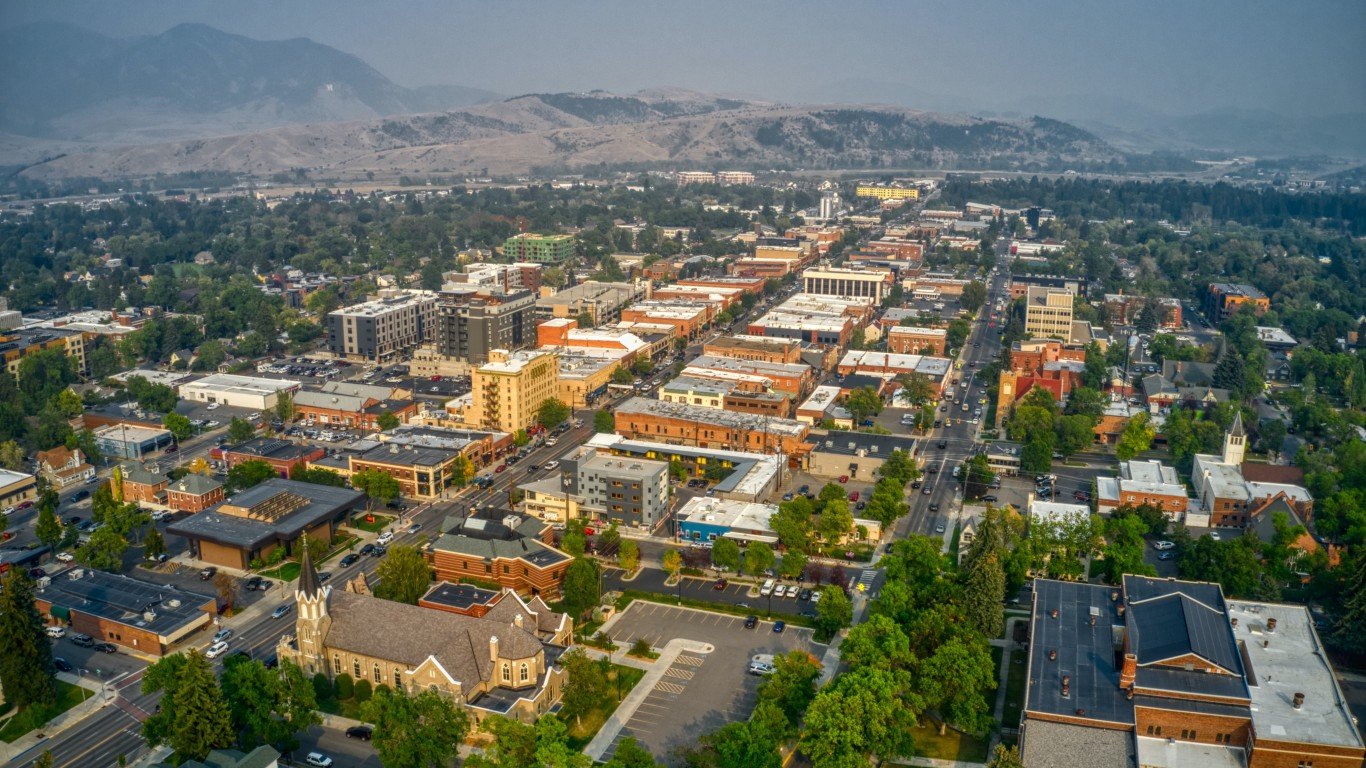
26. Bozeman, Montana
> Avg. commute time (minutes): 14.8
> Share of commuters driving alone: 69.3% — 276th lowest of 1,789 cities
> Share of commuters carpooling: 7.3% — 450th lowest of 1,789 cities
> Share of commuters using public transit: 0.5% — 391st lowest of 1,789 cities
25. Galesburg, Illinois
> Avg. commute time (minutes): 14.8
> Share of commuters driving alone: 80.4% — 530th highest of 1,789 cities
> Share of commuters carpooling: 8.6% — 779th lowest of 1,789 cities
> Share of commuters using public transit: 0.7% — 549th lowest of 1,789 cities
[in-text-ad]
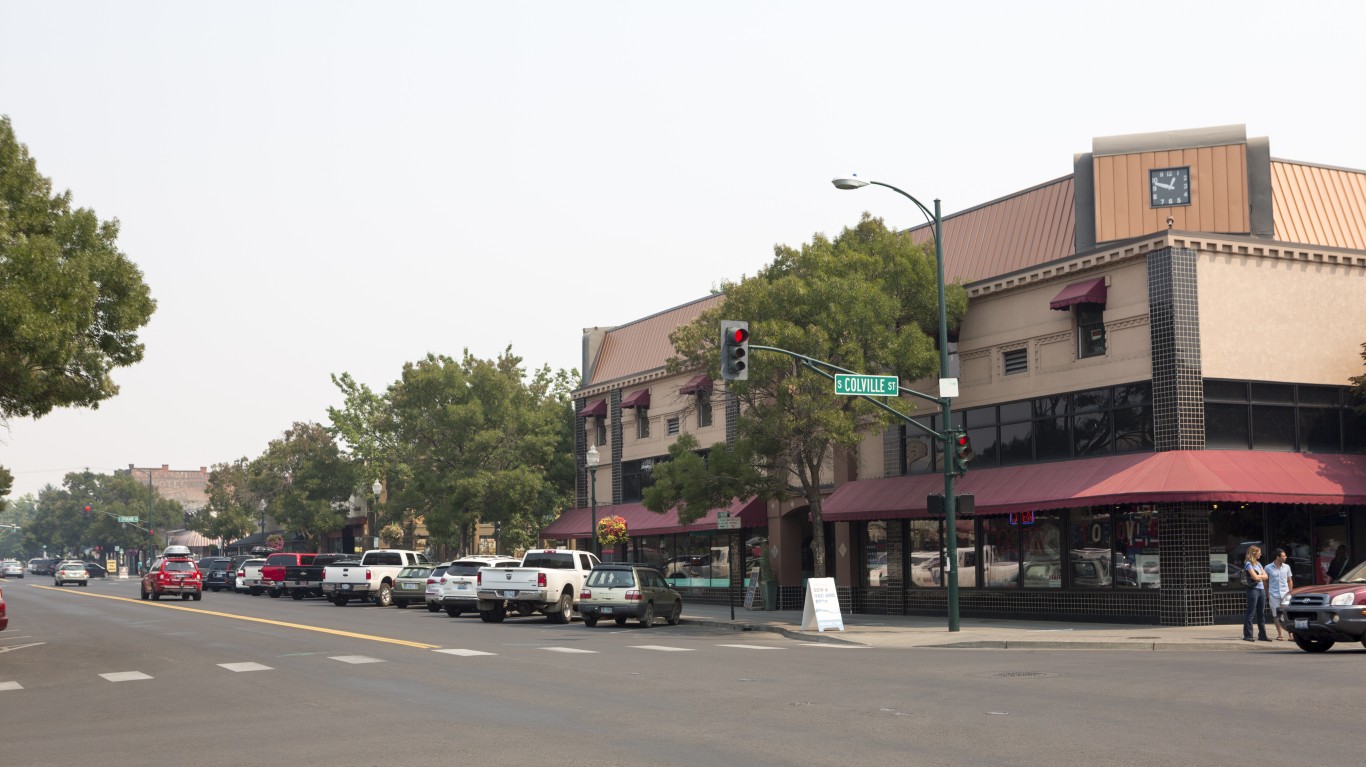
24. Walla Walla, Washington
> Avg. commute time (minutes): 14.8
> Share of commuters driving alone: 66.9% — 209th lowest of 1,789 cities
> Share of commuters carpooling: 10.5% — 527th highest of 1,789 cities
> Share of commuters using public transit: 1.6% — 895th highest of 1,789 cities
[recirclink id=987778]
23. Carbondale, Illinois
> Avg. commute time (minutes): 14.7
> Share of commuters driving alone: 70.4% — 311th lowest of 1,789 cities
> Share of commuters carpooling: 9.7% — 722nd highest of 1,789 cities
> Share of commuters using public transit: 3.6% — 471st highest of 1,789 cities
22. Jamestown, New York
> Avg. commute time (minutes): 14.7
> Share of commuters driving alone: 76.0% — 695th lowest of 1,789 cities
> Share of commuters carpooling: 11.6% — 330th highest of 1,789 cities
> Share of commuters using public transit: 0.3% — 265th lowest of 1,789 cities
[in-text-ad-2]
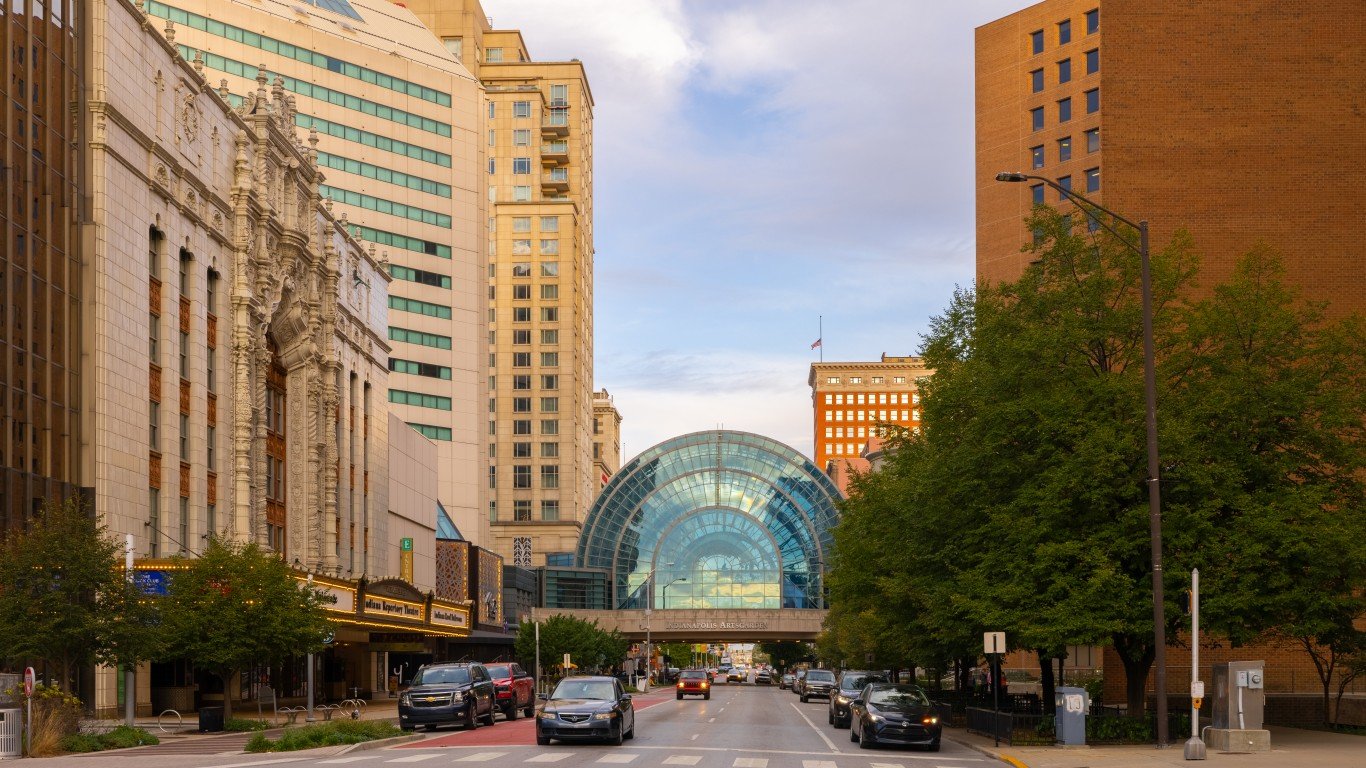
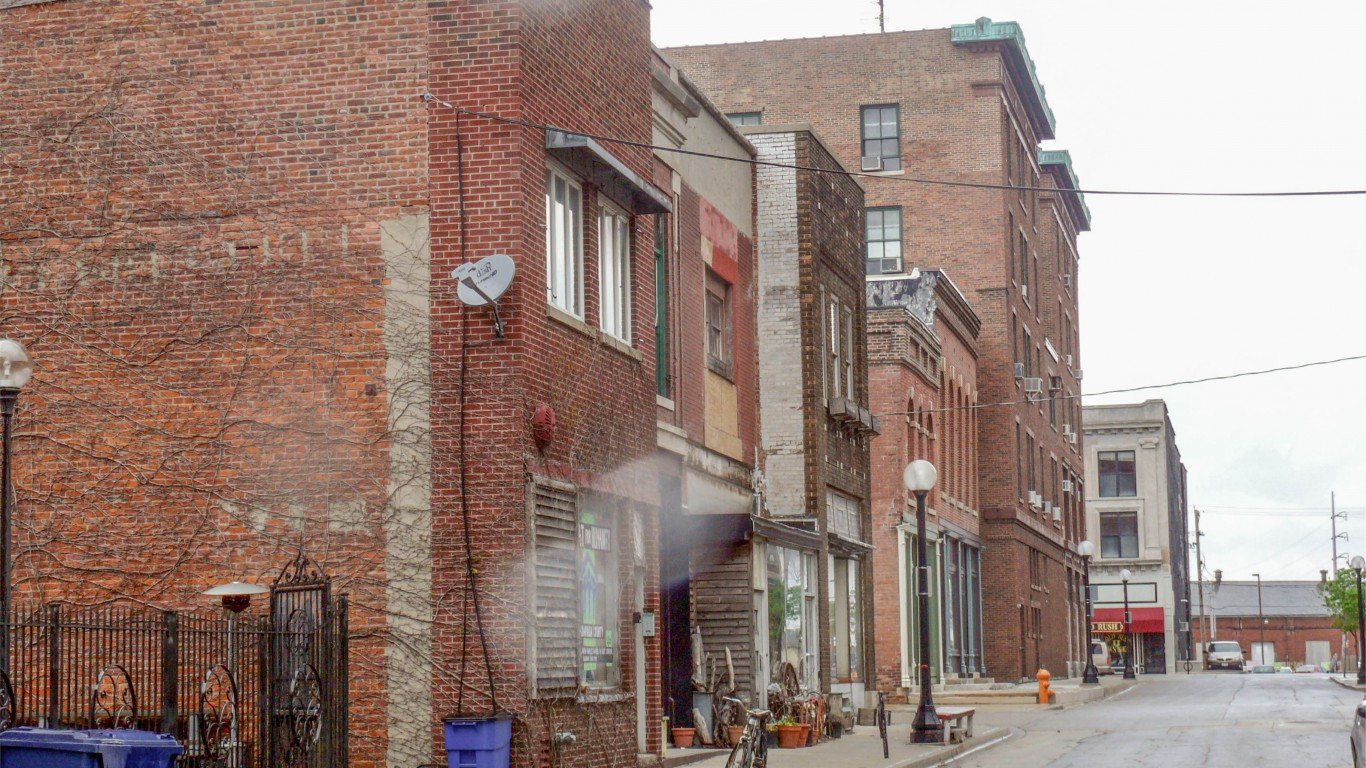
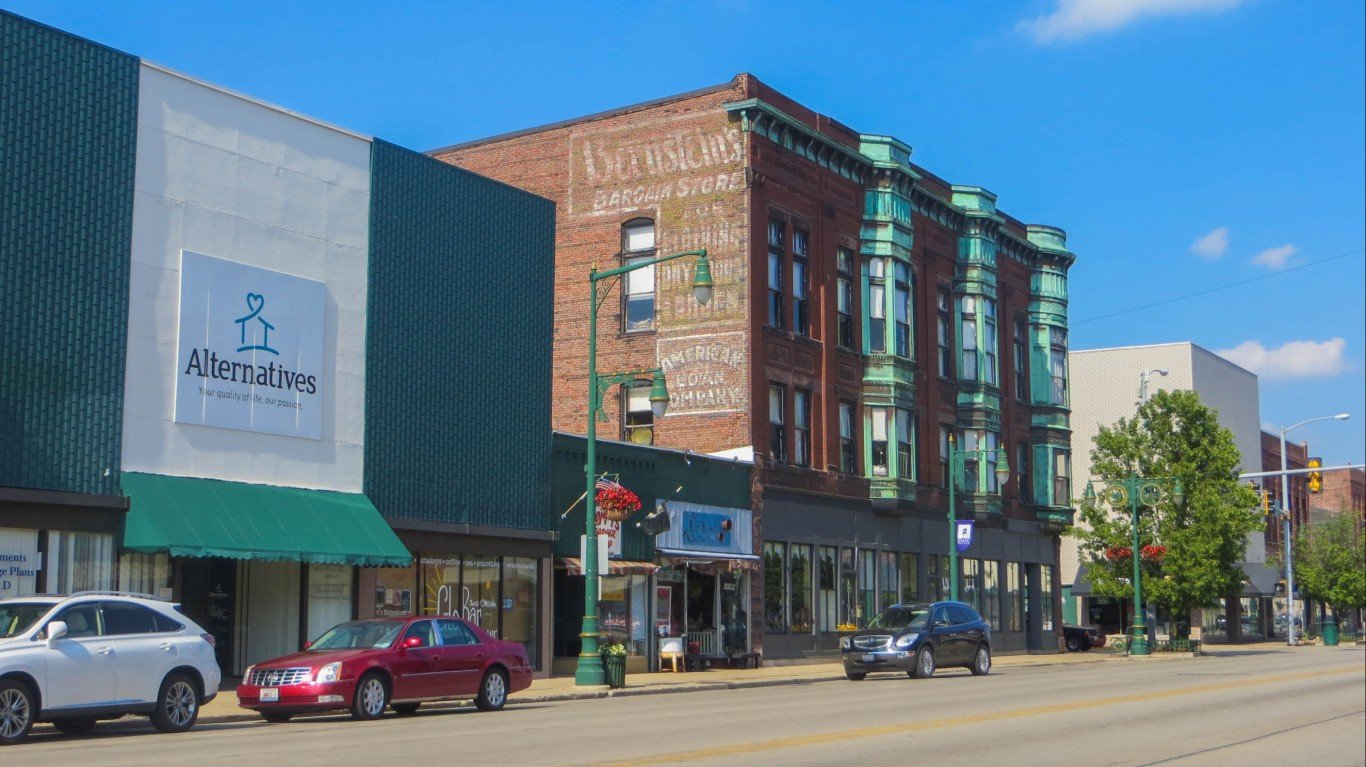
21. Marion, Indiana
> Avg. commute time (minutes): 14.7
> Share of commuters driving alone: 70.3% — 310th lowest of 1,789 cities
> Share of commuters carpooling: 8.4% — 733rd lowest of 1,789 cities
> Share of commuters using public transit: 0.4% — 354th lowest of 1,789 cities
20. Dubuque, Iowa
> Avg. commute time (minutes): 14.6
> Share of commuters driving alone: 78.2% — 826th highest of 1,789 cities
> Share of commuters carpooling: 8.6% — 776th lowest of 1,789 cities
> Share of commuters using public transit: 1.3% — 817th lowest of 1,789 cities
[in-text-ad]

19. Washington, Utah
> Avg. commute time (minutes): 14.5
> Share of commuters driving alone: 80.3% — 545th highest of 1,789 cities
> Share of commuters carpooling: 10.3% — 585th highest of 1,789 cities
> Share of commuters using public transit: 0.1% — 119th lowest of 1,789 cities
[recirclink id=1044820]
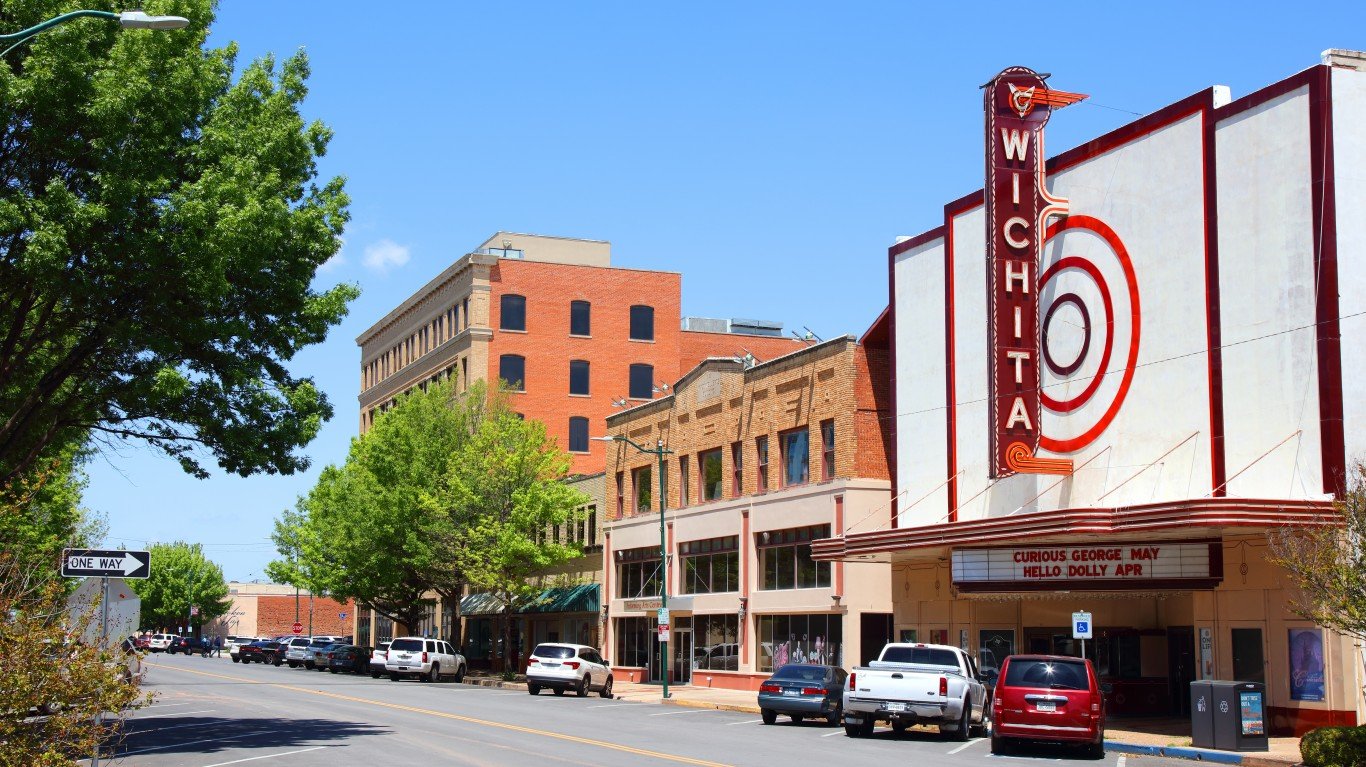
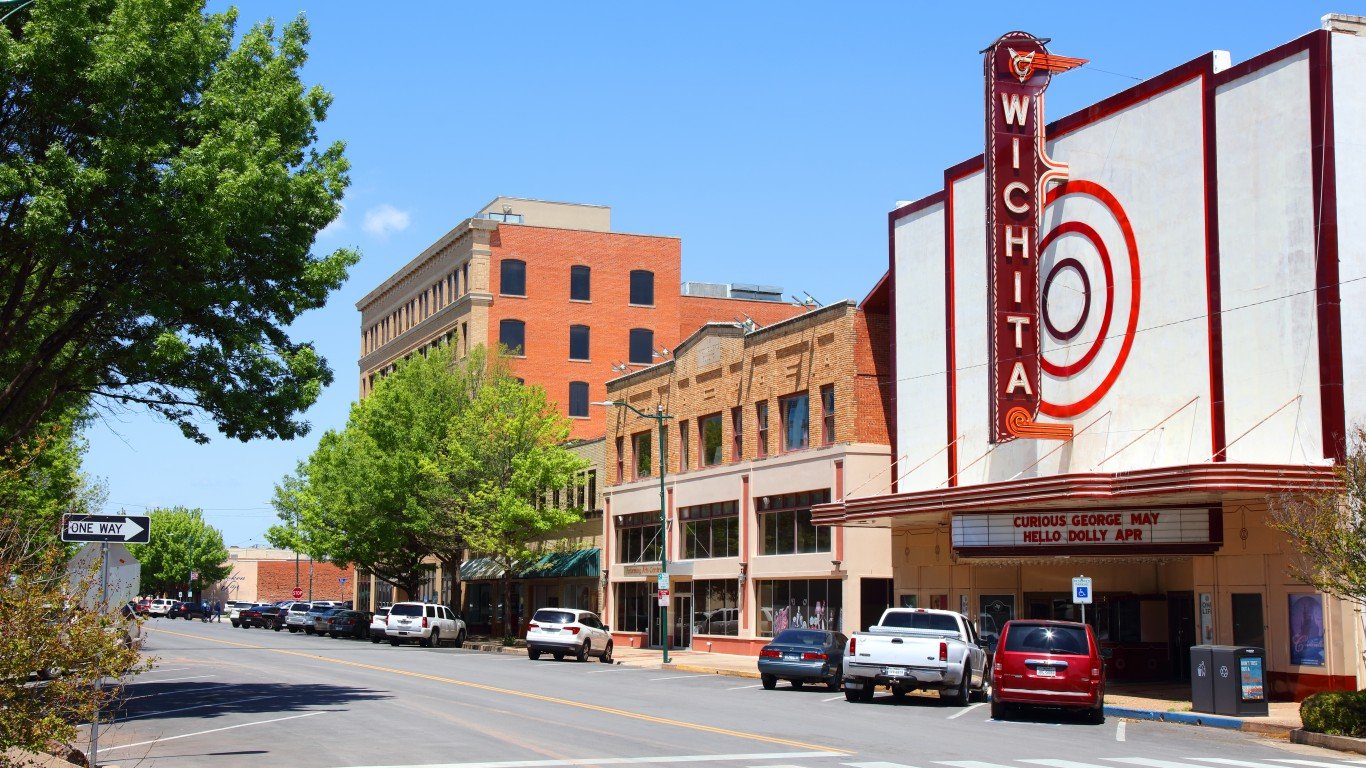
18. Wichita Falls, Texas
> Avg. commute time (minutes): 14.3
> Share of commuters driving alone: 73.0% — 453rd lowest of 1,789 cities
> Share of commuters carpooling: 9.8% — 685th highest of 1,789 cities
> Share of commuters using public transit: 0.5% — 396th lowest of 1,789 cities
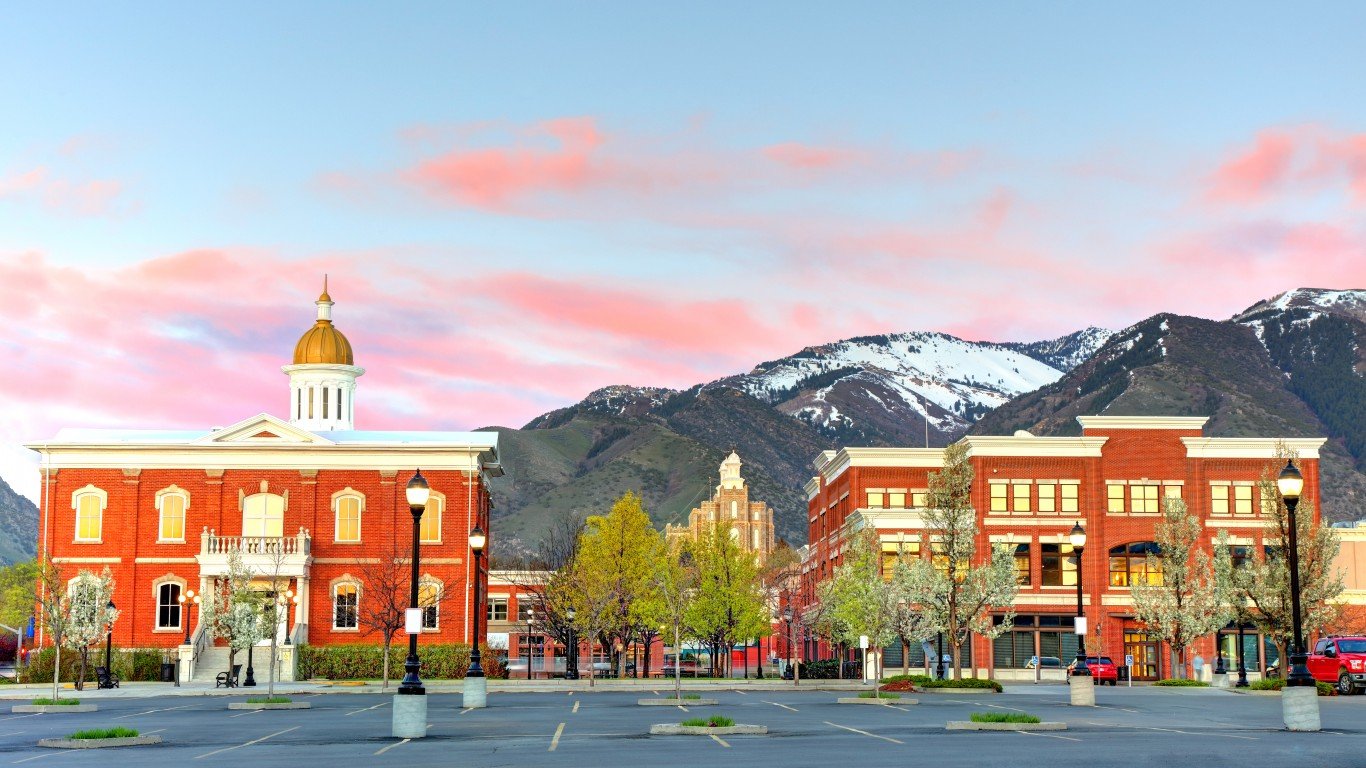
17. Logan, Utah
> Avg. commute time (minutes): 14.3
> Share of commuters driving alone: 68.9% — 265th lowest of 1,789 cities
> Share of commuters carpooling: 12.1% — 276th highest of 1,789 cities
> Share of commuters using public transit: 2.9% — 580th highest of 1,789 cities
[in-text-ad-2]
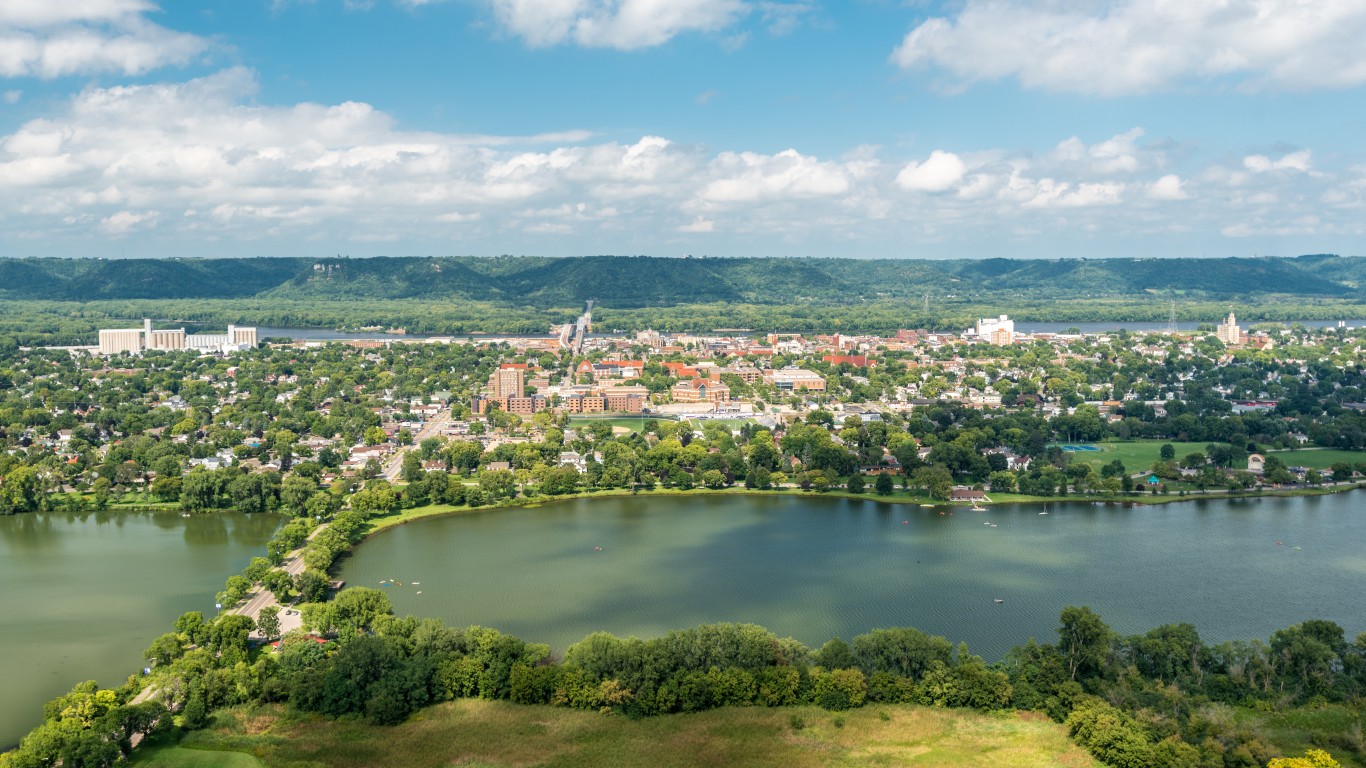
16. Winona, Minnesota
> Avg. commute time (minutes): 14.3
> Share of commuters driving alone: 71.9% — 378th lowest of 1,789 cities
> Share of commuters carpooling: 8.1% — 662nd lowest of 1,789 cities
> Share of commuters using public transit: 2.5% — 661st highest of 1,789 cities

15. Fairbanks, Alaska
> Avg. commute time (minutes): 14.1
> Share of commuters driving alone: 69.0% — 267th lowest of 1,789 cities
> Share of commuters carpooling: 17.6% — 29th highest of 1,789 cities
> Share of commuters using public transit: 1.0% — 697th lowest of 1,789 cities
[in-text-ad]

14. Kearney, Nebraska
> Avg. commute time (minutes): 14.0
> Share of commuters driving alone: 83.7% — 194th highest of 1,789 cities
> Share of commuters carpooling: 8.5% — 775th lowest of 1,789 cities
> Share of commuters using public transit: 0.3% — 288th lowest of 1,789 cities
[recirclink id=1054986]
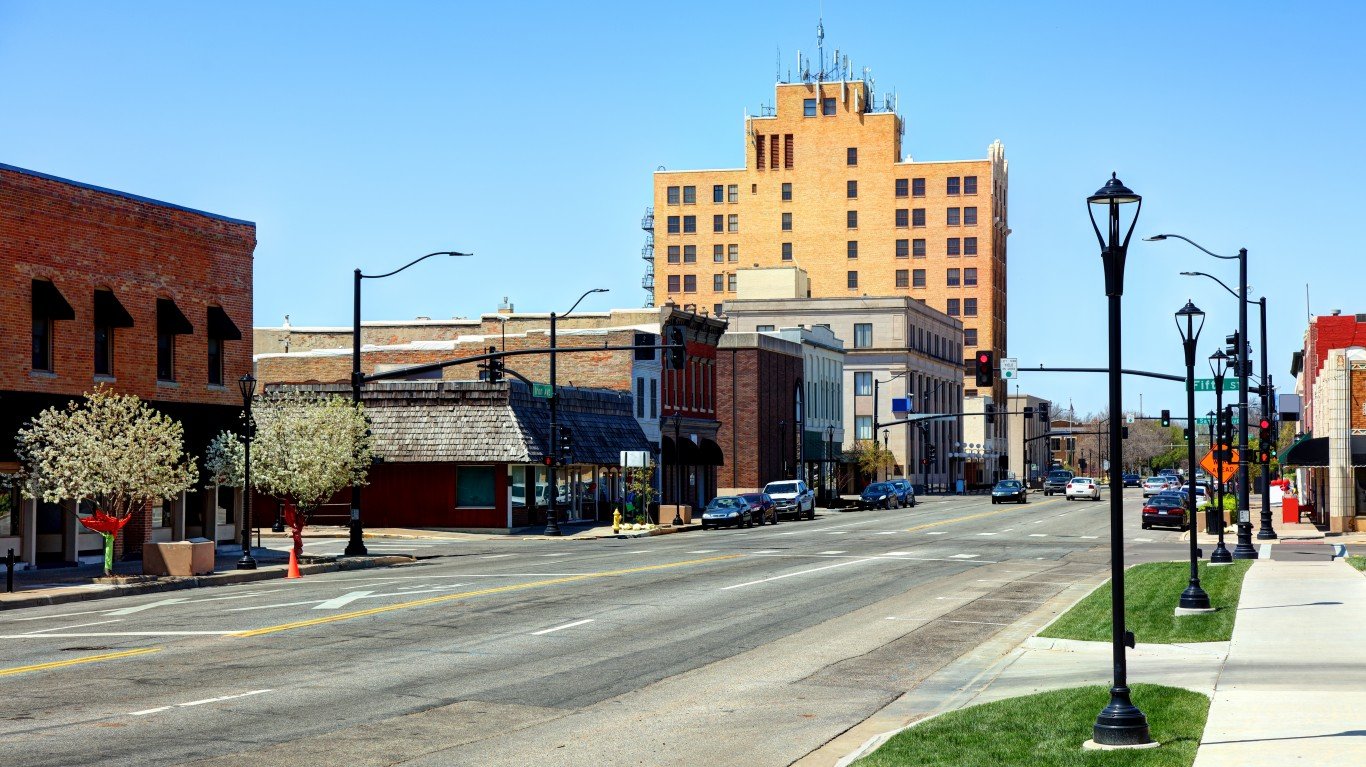
13. Salina, Kansas
> Avg. commute time (minutes): 13.9
> Share of commuters driving alone: 80.5% — 522nd highest of 1,789 cities
> Share of commuters carpooling: 9.5% — 786th highest of 1,789 cities
> Share of commuters using public transit: 0.5% — 397th lowest of 1,789 cities
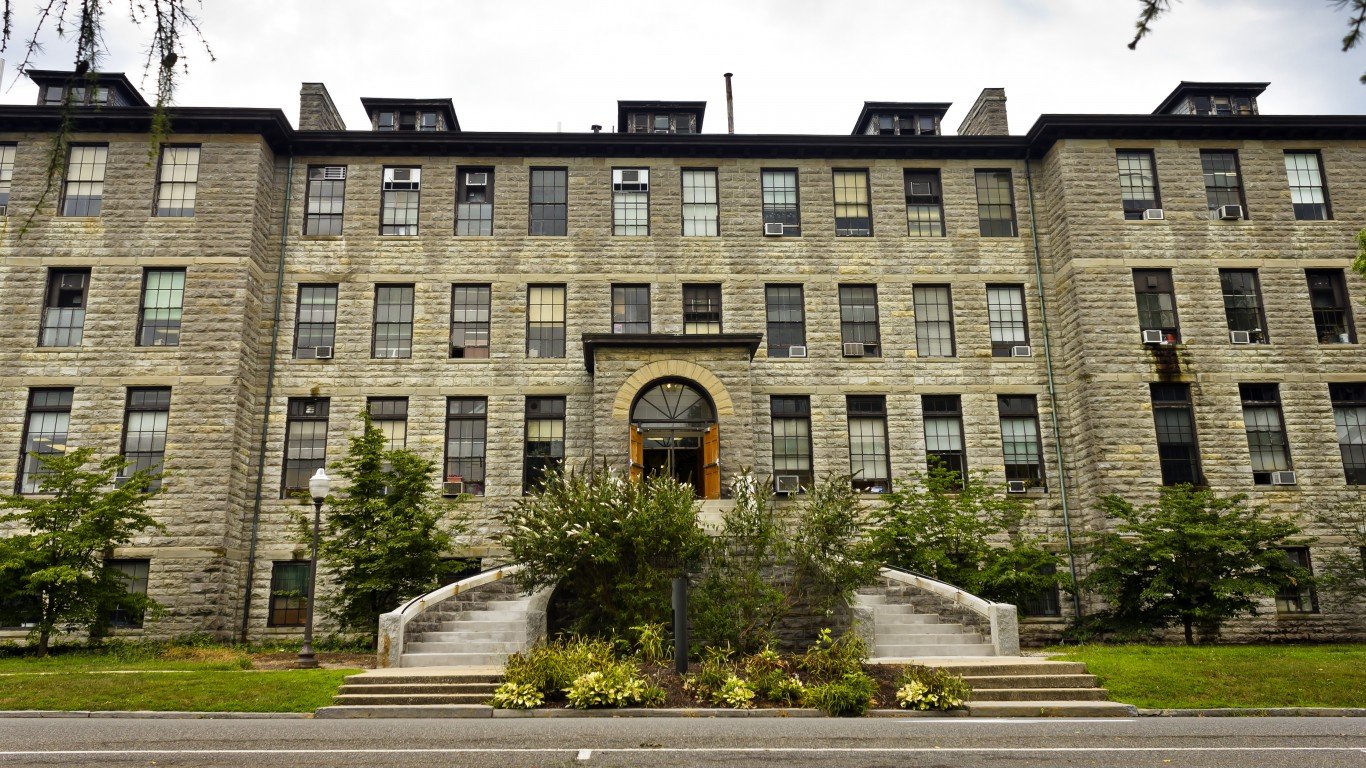
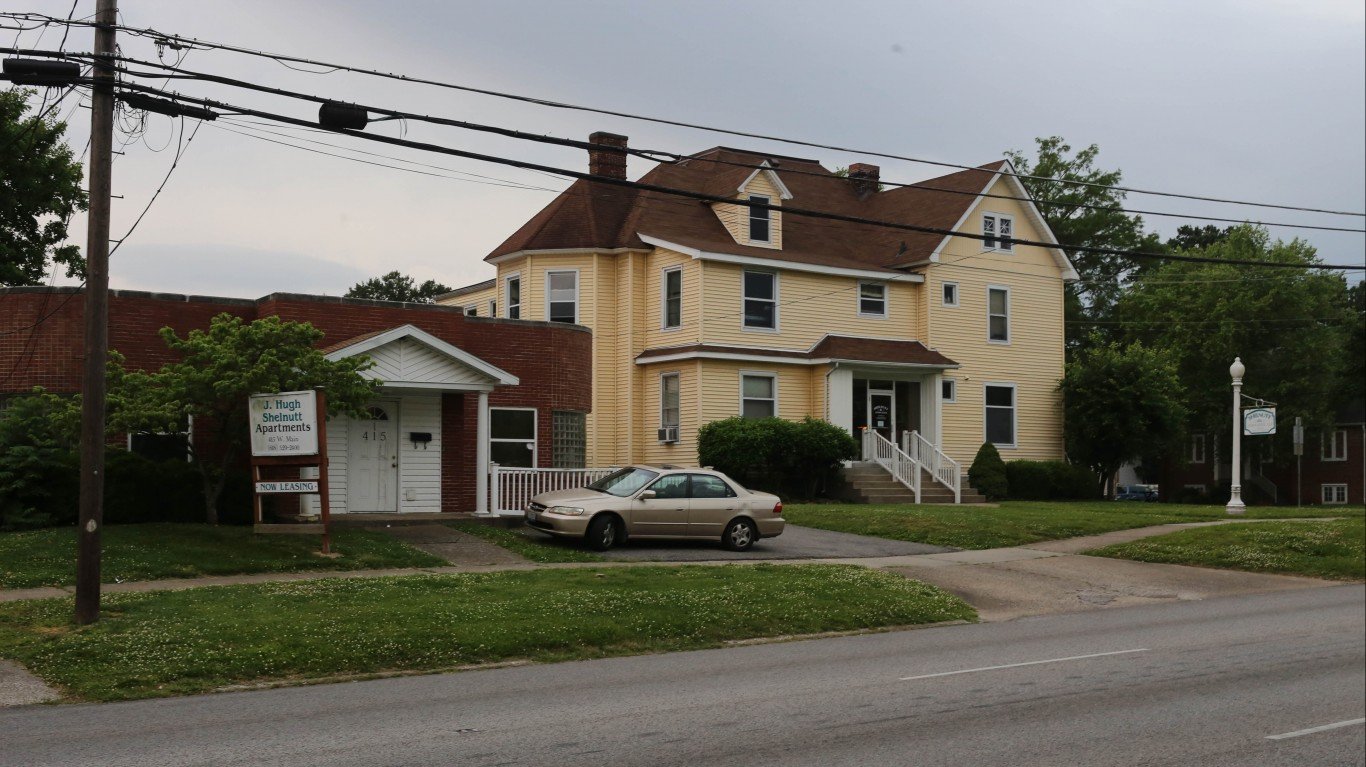
12. Blacksburg, Virginia
> Avg. commute time (minutes): 13.8
> Share of commuters driving alone: 58.8% — 90th lowest of 1,789 cities
> Share of commuters carpooling: 9.3% — 840th highest of 1,789 cities
> Share of commuters using public transit: 6.1% — 296th highest of 1,789 cities
[in-text-ad-2]
11. Grand Forks, North Dakota
> Avg. commute time (minutes): 13.7
> Share of commuters driving alone: 81.6% — 390th highest of 1,789 cities
> Share of commuters carpooling: 7.0% — 377th lowest of 1,789 cities
> Share of commuters using public transit: 1.3% — 804th lowest of 1,789 cities

10. Cedar City, Utah
> Avg. commute time (minutes): 13.6
> Share of commuters driving alone: 78.2% — 829th highest of 1,789 cities
> Share of commuters carpooling: 11.9% — 299th highest of 1,789 cities
> Share of commuters using public transit: 0.3% — 309th lowest of 1,789 cities
[in-text-ad]
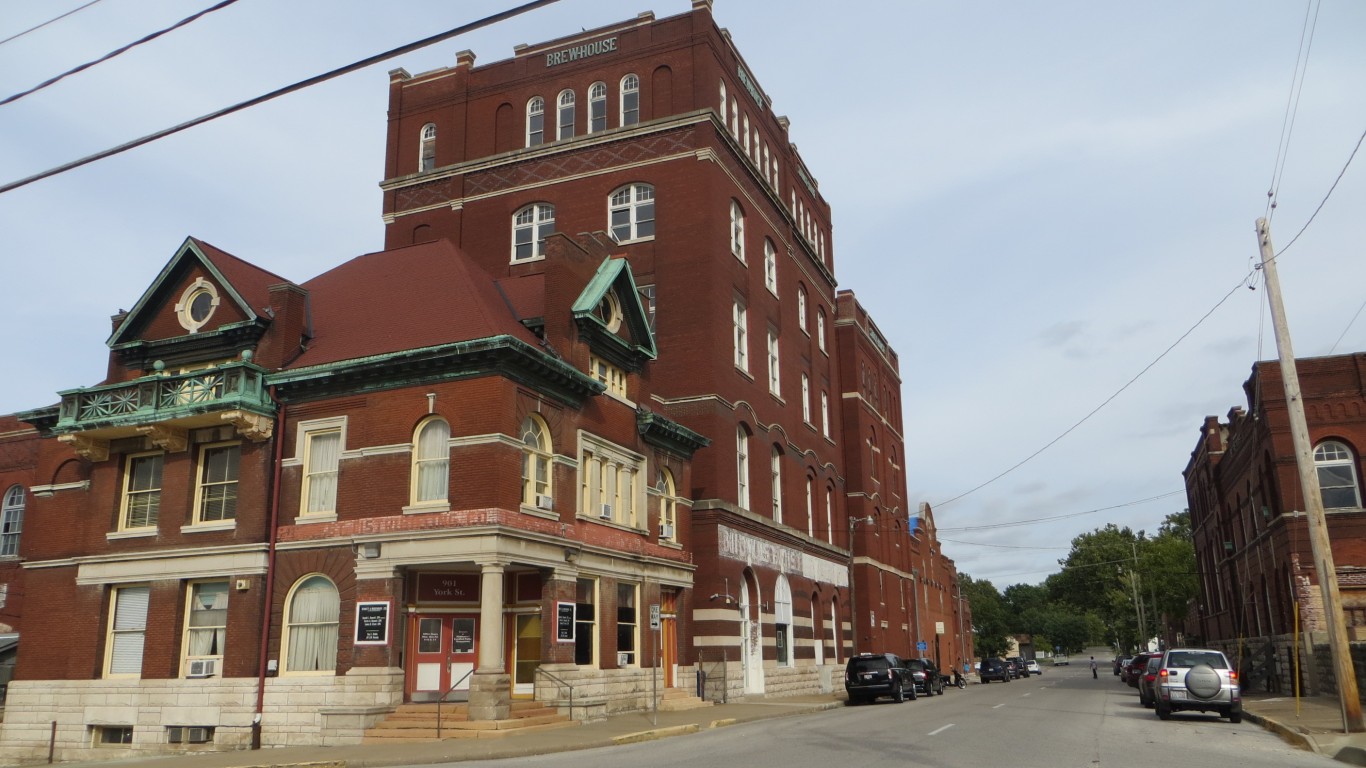
9. Quincy, Illinois
> Avg. commute time (minutes): 13.5
> Share of commuters driving alone: 82.7% — 278th highest of 1,789 cities
> Share of commuters carpooling: 8.0% — 629th lowest of 1,789 cities
> Share of commuters using public transit: 0.9% — 635th lowest of 1,789 cities
[recirclink id=1060122]
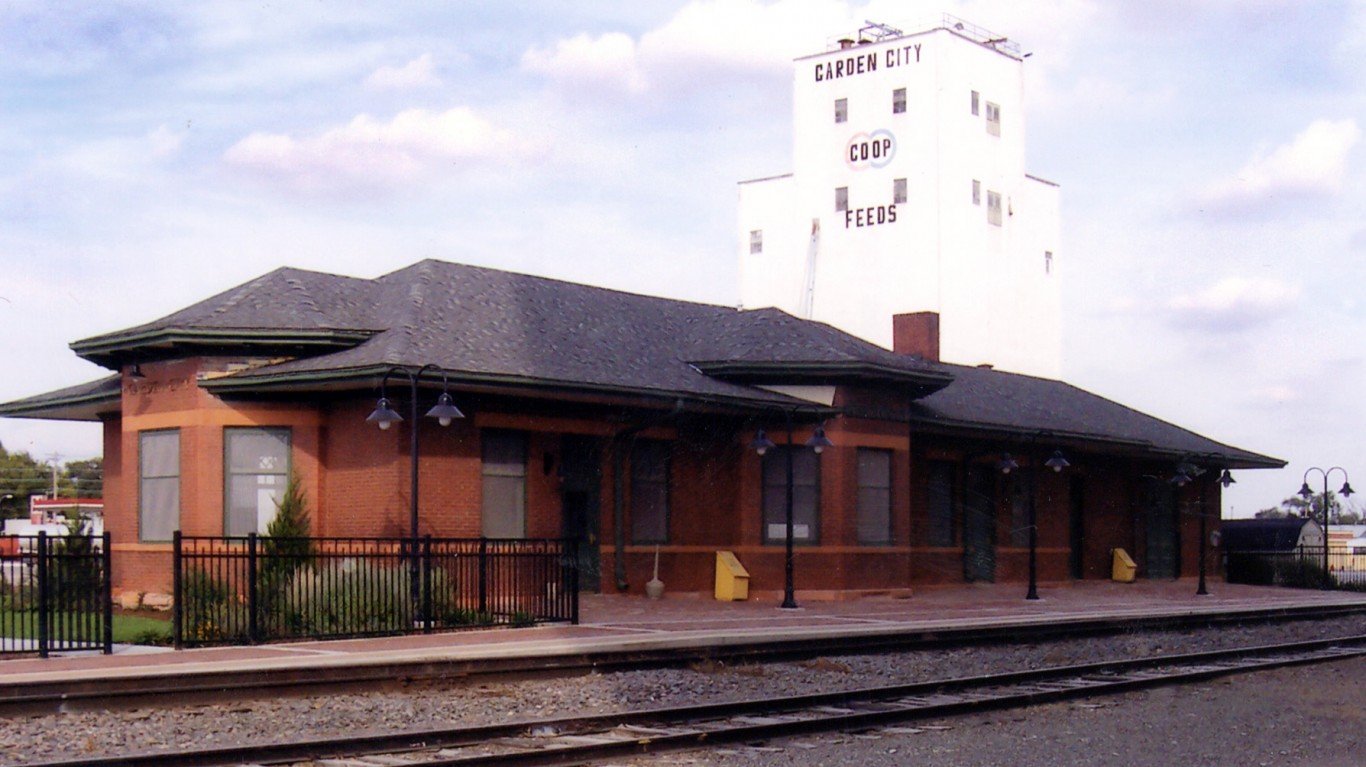
8. Garden City, Kansas
> Avg. commute time (minutes): 13.4
> Share of commuters driving alone: 82.1% — 325th highest of 1,789 cities
> Share of commuters carpooling: 13.9% — 124th highest of 1,789 cities
> Share of commuters using public transit: 0.5% — 381st lowest of 1,789 cities

7. Mount Pleasant, Michigan
> Avg. commute time (minutes): 13.4
> Share of commuters driving alone: 66.6% — 197th lowest of 1,789 cities
> Share of commuters carpooling: 8.1% — 647th lowest of 1,789 cities
> Share of commuters using public transit: 1.0% — 687th lowest of 1,789 cities
[in-text-ad-2]
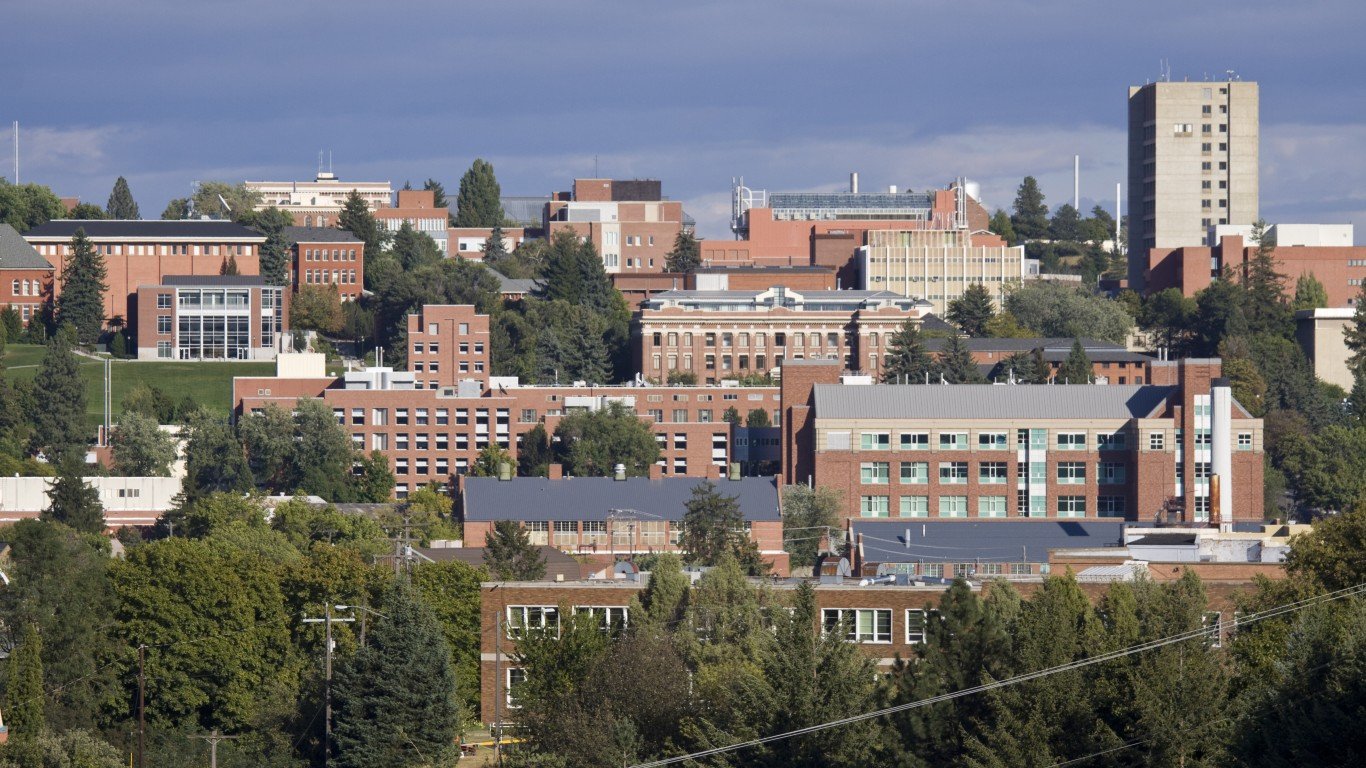
6. Pullman, Washington
> Avg. commute time (minutes): 13.2
> Share of commuters driving alone: 55.9% — 68th lowest of 1,789 cities
> Share of commuters carpooling: 9.6% — 746th highest of 1,789 cities
> Share of commuters using public transit: 5.9% — 306th highest of 1,789 cities
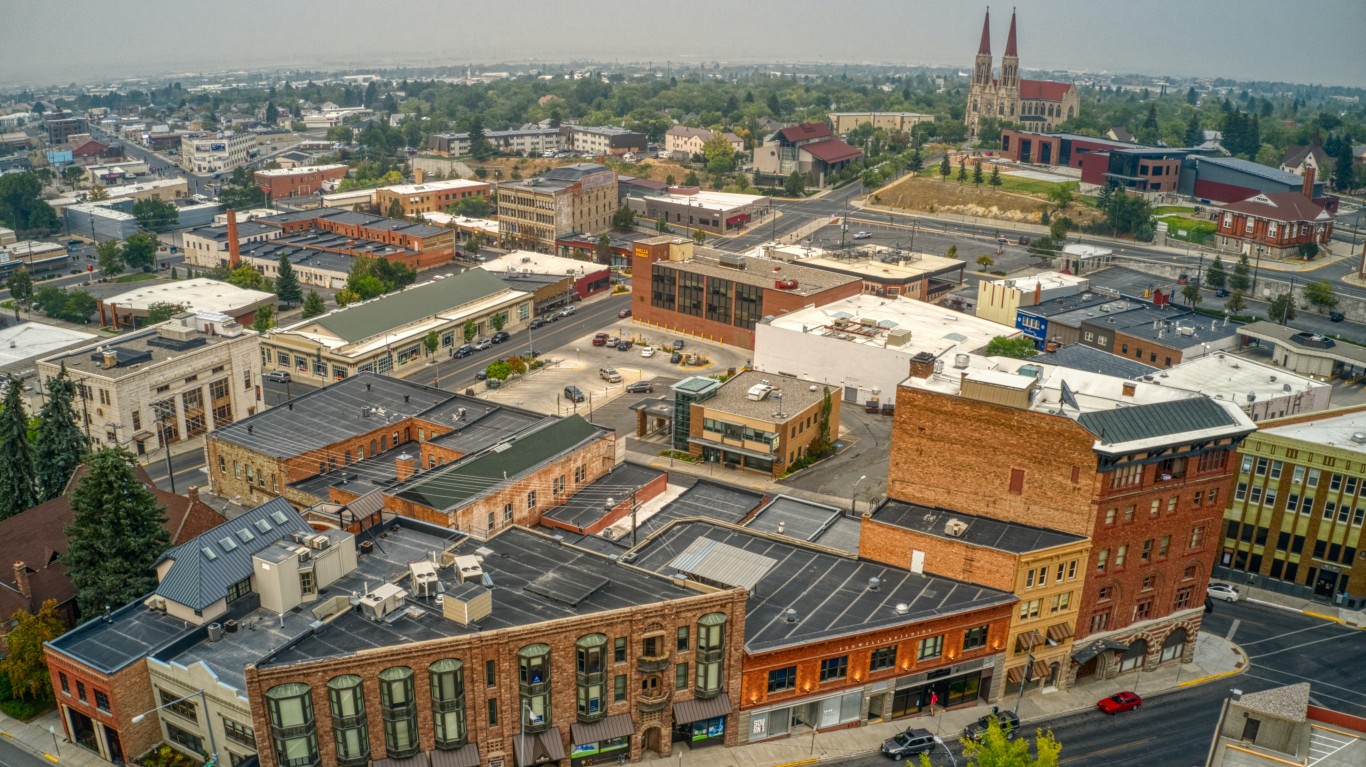
5. Helena, Montana
> Avg. commute time (minutes): 13.0
> Share of commuters driving alone: 72.5% — 413th lowest of 1,789 cities
> Share of commuters carpooling: 9.8% — 705th highest of 1,789 cities
> Share of commuters using public transit: 0.6% — 454th lowest of 1,789 cities
[in-text-ad]

4. Laramie, Wyoming
> Avg. commute time (minutes): 12.9
> Share of commuters driving alone: 71.2% — 343rd lowest of 1,789 cities
> Share of commuters carpooling: 8.5% — 762nd lowest of 1,789 cities
> Share of commuters using public transit: 1.4% — 827th lowest of 1,789 cities
[recirclink id=1024519]

3. Dodge City, Kansas
> Avg. commute time (minutes): 12.3
> Share of commuters driving alone: 80.2% — 563rd highest of 1,789 cities
> Share of commuters carpooling: 16.4% — 49th highest of 1,789 cities
> Share of commuters using public transit: 0.2% — 207th lowest of 1,789 cities

2. Rexburg, Idaho
> Avg. commute time (minutes): 12.1
> Share of commuters driving alone: 62.8% — 129th lowest of 1,789 cities
> Share of commuters carpooling: 18.5% — 20th highest of 1,789 cities
> Share of commuters using public transit: 0.0% reported — the lowest of 1,789 cities (tied)
[in-text-ad-2]
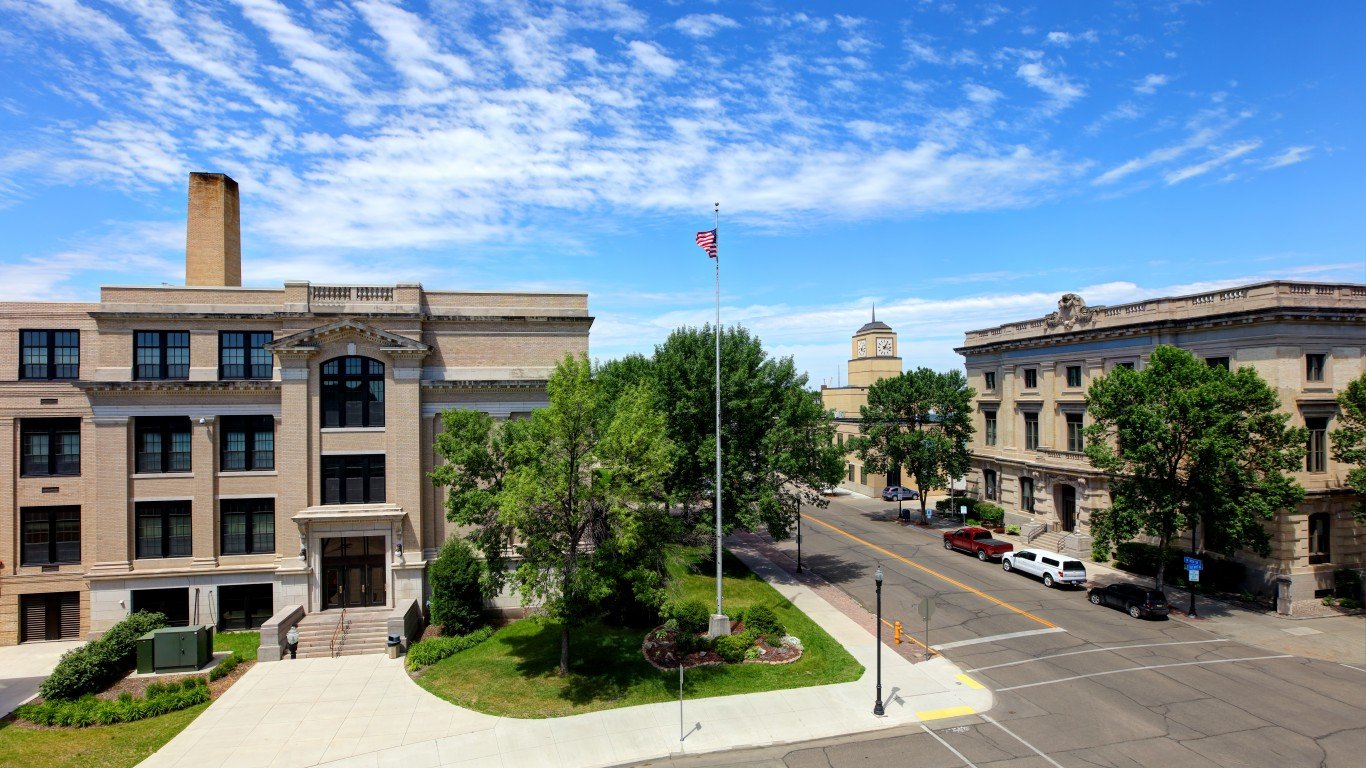
1. Aberdeen, South Dakota
> Avg. commute time (minutes): 10.9
> Share of commuters driving alone: 82.1% — 332nd highest of 1,789 cities
> Share of commuters carpooling: 7.1% — 392nd lowest of 1,789 cities
> Share of commuters using public transit: 0.0% reported — the lowest of 1,789 cities (tied)
Methodology
To determine the cities with the shortest commutes, 24/7 Wall St. reviewed five-year estimates of average commute times from the U.S. Census Bureau’s 2020 American Community Survey.
Cities were ranked based on their average commute time. To break ties, we used the share of workers with a commute of 15 minutes or less.
We used census “place” geographies — a category that includes incorporated legal entities and census-designated statistical entities. We defined cities based on a population threshold — census places needed to have a population of at least 25,000 to be considered.
Cities were excluded if average commute time estimates were not available in the 2020 ACS, if there were fewer than 1,000 workers 16 years and over who did not work from home, or if the sampling error associated with a city’s data was deemed too high.
The sampling error was defined as too high if the coefficient of variation — a statistical assessment of how reliable an estimate is — for a city’s average commute time was above 15% and greater than two standard deviations above the mean CV for all cities’ average commute times. We similarly excluded cities that had a sampling error too high for their population, using the same definition.
Additional information on the share of commuters driving alone, carpooling, and using public transit are also five-year estimates from the 2020 ACS.
Contact [email protected] for any questions or corrections.