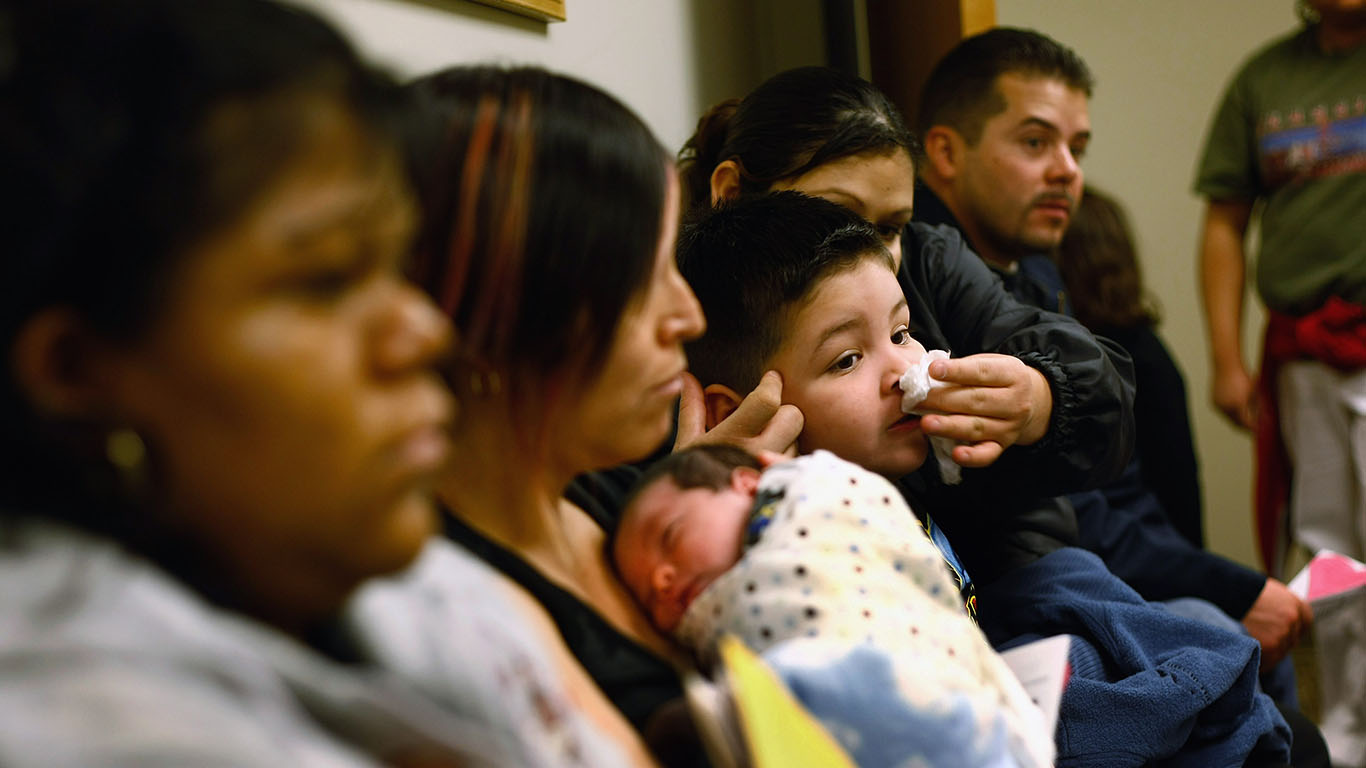
The United States is the world’s only large wealthy nation that does not provide citizens with universal health coverage. Though the U.S. is home to many of the world’s top hospitals and medical research institutions, there are tens of millions of Americans who do not have health insurance.
Though the uninsured rate has fallen considerably in the last decade – largely due to provisions of the Affordable Care Act – more than 23 million working age adults lack health insurance. Americans without coverage are less likely to receive preventative care or treatment for chronic conditions – and diseases or accidents that require hospitalization are often financially ruinous. Several studies indicate that almost two-thirds of personal bankruptcies in the nation are due to medical bills that can’t be paid. (Here is a look at the most expensive medical treatments in America.)
Many Americans receive insurance coverage through their job. Those whose employers do not offer health insurance, and who are not eligible for Medicare or Medicaid, will typically have to pay for insurance out of pocket – and many uninsured Americans cite the high cost of insurance as the reason they go without it.
Using data from the U.S. Census Bureau, 24/7 Tempo identified the U.S. counties with the worst health insurance coverage. Counties and county equivalents are ranked by the share of the adult population under age 65 who are uninsured.
Among the counties on this list, uninsured rates range from about 34% to over 50%. For context, 12.3% of the U.S. population between the ages of 19 and 65 are uninsured.
The vast majority of counties on this list are in states that did not expand Medicaid coverage. Under the ACA, states were offered federal money to extend Medicaid coverage to those with incomes up to 138% of the poverty level. However, 12 states have opted not to expand Medicaid, including Georgia, South Dakota, and Texas – which between them are home to 37 of the 50 counties on this list. Here is a look at America’s best health care system.
Click here to see counties with the worst health care coverage
Click here to read our detailed methodology

50. Clinch County, GA
> Adults under 65, no health insurance: 33.9%
> Adults under 65, VA coverage (or multiple types): 2.1% – #1,133 highest of 3,129 counties
> Adults under 65, employer-based insurance (or multiple types): 56.1% – #1,928 highest of 3,129 counties
> Adults under 65, direct-purchase insurance (or multiple types): 3.9% – #3,098 highest of 3,129 counties
[in-text-ad]
49. Roosevelt County, MT
> Adults under 65, no health insurance: 34.1%
> Adults under 65, VA coverage (or multiple types): 2.0% – #1,248 highest of 3,129 counties
> Adults under 65, employer-based insurance (or multiple types): 38.0% – #3,000 highest of 3,129 counties
> Adults under 65, direct-purchase insurance (or multiple types): 8.5% – #2,577 highest of 3,129 counties
[recirclink id=1053569]

48. Atkinson County, GA
> Adults under 65, no health insurance: 34.1%
> Adults under 65, VA coverage (or multiple types): 0.4% – #3,042 highest of 3,129 counties
> Adults under 65, employer-based insurance (or multiple types): 46.0% – #2,750 highest of 3,129 counties
> Adults under 65, direct-purchase insurance (or multiple types): 4.1% – #3,092 highest of 3,129 counties

47. Cochran County, TX
> Adults under 65, no health insurance: 34.2%
> Adults under 65, VA coverage (or multiple types): 1.8% – #1,500 highest of 3,129 counties
> Adults under 65, employer-based insurance (or multiple types): 45.5% – #2,775 highest of 3,129 counties
> Adults under 65, direct-purchase insurance (or multiple types): 8.7% – #2,524 highest of 3,129 counties
[in-text-ad-2]

46. La Salle County, TX
> Adults under 65, no health insurance: 34.2%
> Adults under 65, VA coverage (or multiple types): 1.9% – #1,369 highest of 3,129 counties
> Adults under 65, employer-based insurance (or multiple types): 52.3% – #2,333 highest of 3,129 counties
> Adults under 65, direct-purchase insurance (or multiple types): 4.1% – #3,092 highest of 3,129 counties

45. Crockett County, TX
> Adults under 65, no health insurance: 34.2%
> Adults under 65, VA coverage (or multiple types): 0.0% – #3,116 highest of 3,129 counties
> Adults under 65, employer-based insurance (or multiple types): 59.2% – #1,553 highest of 3,129 counties
> Adults under 65, direct-purchase insurance (or multiple types): 5.1% – #3,061 highest of 3,129 counties
[in-text-ad]

44. Menominee County, WI
> Adults under 65, no health insurance: 34.3%
> Adults under 65, VA coverage (or multiple types): 1.8% – #1,500 highest of 3,129 counties
> Adults under 65, employer-based insurance (or multiple types): 34.3% – #3,039 highest of 3,129 counties
> Adults under 65, direct-purchase insurance (or multiple types): 4.1% – #3,092 highest of 3,129 counties
[recirclink id=1073006]

43. Hale County, TX
> Adults under 65, no health insurance: 34.4%
> Adults under 65, VA coverage (or multiple types): 1.3% – #2,226 highest of 3,129 counties
> Adults under 65, employer-based insurance (or multiple types): 51.6% – #2,391 highest of 3,129 counties
> Adults under 65, direct-purchase insurance (or multiple types): 6.1% – #2,996 highest of 3,129 counties
42. Big Horn County, MT
> Adults under 65, no health insurance: 34.6%
> Adults under 65, VA coverage (or multiple types): 1.0% – #2,609 highest of 3,129 counties
> Adults under 65, employer-based insurance (or multiple types): 34.5% – #3,037 highest of 3,129 counties
> Adults under 65, direct-purchase insurance (or multiple types): 7.7% – #2,767 highest of 3,129 counties
[in-text-ad-2]
41. Lamb County, TX
> Adults under 65, no health insurance: 34.7%
> Adults under 65, VA coverage (or multiple types): 1.1% – #2,485 highest of 3,129 counties
> Adults under 65, employer-based insurance (or multiple types): 45.7% – #2,767 highest of 3,129 counties
> Adults under 65, direct-purchase insurance (or multiple types): 12.6% – #1,038 highest of 3,129 counties

40. McIntosh County, OK
> Adults under 65, no health insurance: 34.9%
> Adults under 65, VA coverage (or multiple types): 3.9% – #188 highest of 3,129 counties
> Adults under 65, employer-based insurance (or multiple types): 37.8% – #3,004 highest of 3,129 counties
> Adults under 65, direct-purchase insurance (or multiple types): 12.9% – #943 highest of 3,129 counties
[in-text-ad]

39. Terry County, TX
> Adults under 65, no health insurance: 35.0%
> Adults under 65, VA coverage (or multiple types): 1.7% – #1,625 highest of 3,129 counties
> Adults under 65, employer-based insurance (or multiple types): 44.7% – #2,810 highest of 3,129 counties
> Adults under 65, direct-purchase insurance (or multiple types): 12.4% – #1,102 highest of 3,129 counties
[recirclink id=1085403]

38. Early County, GA
> Adults under 65, no health insurance: 35.1%
> Adults under 65, VA coverage (or multiple types): 1.6% – #1,764 highest of 3,129 counties
> Adults under 65, employer-based insurance (or multiple types): 44.6% – #2,811 highest of 3,129 counties
> Adults under 65, direct-purchase insurance (or multiple types): 9.0% – #2,435 highest of 3,129 counties

37. Rolette County, ND
> Adults under 65, no health insurance: 35.3%
> Adults under 65, VA coverage (or multiple types): 1.1% – #2,485 highest of 3,129 counties
> Adults under 65, employer-based insurance (or multiple types): 34.7% – #3,035 highest of 3,129 counties
> Adults under 65, direct-purchase insurance (or multiple types): 8.3% – #2,640 highest of 3,129 counties
[in-text-ad-2]

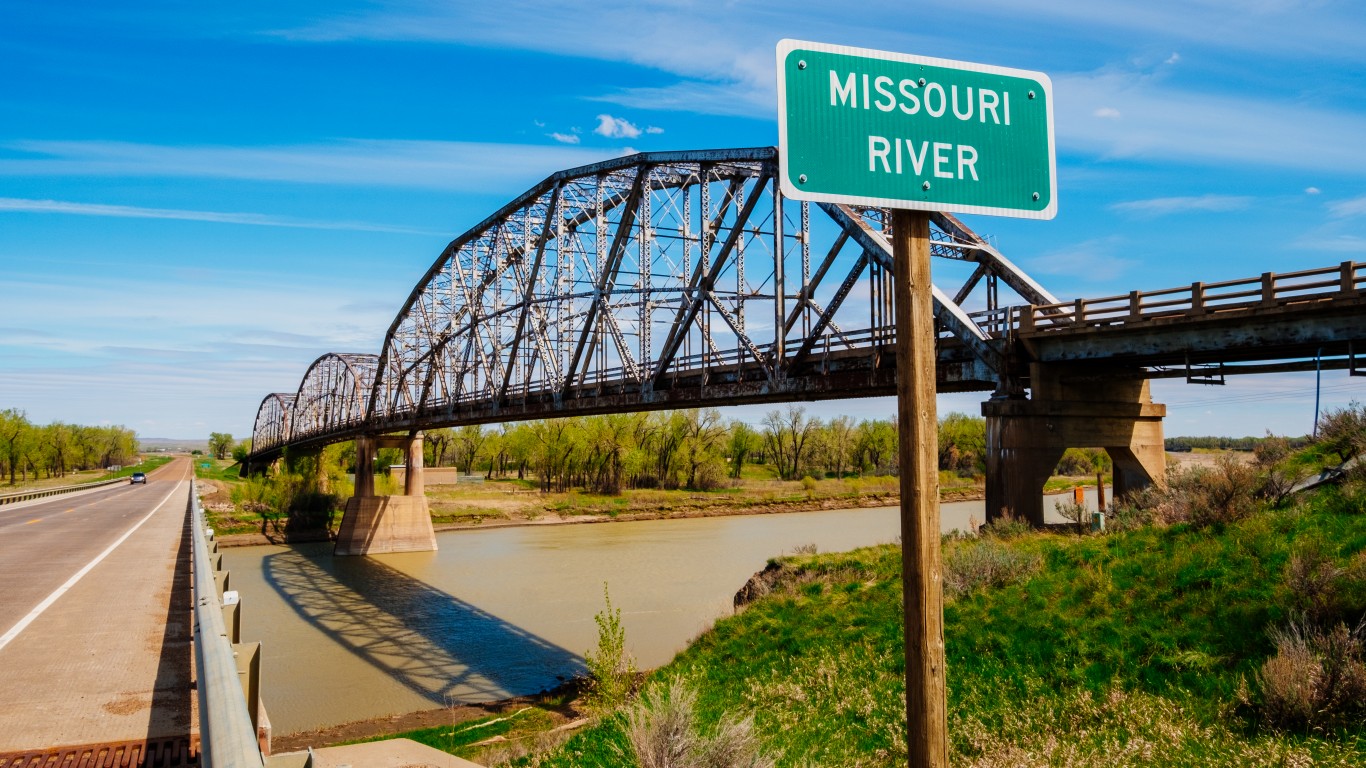
36. Scotland County, MO
> Adults under 65, no health insurance: 35.3%
> Adults under 65, VA coverage (or multiple types): 1.7% – #1,625 highest of 3,129 counties
> Adults under 65, employer-based insurance (or multiple types): 50.8% – #2,465 highest of 3,129 counties
> Adults under 65, direct-purchase insurance (or multiple types): 10.0% – #2,031 highest of 3,129 counties

35. Hamilton County, KS
> Adults under 65, no health insurance: 35.6%
> Adults under 65, VA coverage (or multiple types): 0.0% – #3,116 highest of 3,129 counties
> Adults under 65, employer-based insurance (or multiple types): 42.4% – #2,909 highest of 3,129 counties
> Adults under 65, direct-purchase insurance (or multiple types): 26.2% – # 49 highest of 3,129 counties
[in-text-ad]

34. Quitman County, GA
> Adults under 65, no health insurance: 35.7%
> Adults under 65, VA coverage (or multiple types): 0.9% – #2,705 highest of 3,129 counties
> Adults under 65, employer-based insurance (or multiple types): 46.8% – #2,716 highest of 3,129 counties
> Adults under 65, direct-purchase insurance (or multiple types): 9.3% – #2,322 highest of 3,129 counties
[recirclink id=1087270]

33. Mills County, TX
> Adults under 65, no health insurance: 36.2%
> Adults under 65, VA coverage (or multiple types): 1.1% – #2,485 highest of 3,129 counties
> Adults under 65, employer-based insurance (or multiple types): 41.9% – #2,924 highest of 3,129 counties
> Adults under 65, direct-purchase insurance (or multiple types): 16.1% – #418 highest of 3,129 counties

32. Adair County, OK
> Adults under 65, no health insurance: 36.4%
> Adults under 65, VA coverage (or multiple types): 2.2% – #1,036 highest of 3,129 counties
> Adults under 65, employer-based insurance (or multiple types): 35.7% – #3,023 highest of 3,129 counties
> Adults under 65, direct-purchase insurance (or multiple types): 9.6% – #2,209 highest of 3,129 counties
[in-text-ad-2]
31. Castro County, TX
> Adults under 65, no health insurance: 36.5%
> Adults under 65, VA coverage (or multiple types): 3.4% – #290 highest of 3,129 counties
> Adults under 65, employer-based insurance (or multiple types): 47.9% – #2,654 highest of 3,129 counties
> Adults under 65, direct-purchase insurance (or multiple types): 8.3% – #2,640 highest of 3,129 counties

30. Coleman County, TX
> Adults under 65, no health insurance: 36.7%
> Adults under 65, VA coverage (or multiple types): 1.1% – #2,485 highest of 3,129 counties
> Adults under 65, employer-based insurance (or multiple types): 46.2% – #2,739 highest of 3,129 counties
> Adults under 65, direct-purchase insurance (or multiple types): 7.5% – #2,806 highest of 3,129 counties
[in-text-ad]

29. Schleicher County, TX
> Adults under 65, no health insurance: 36.9%
> Adults under 65, VA coverage (or multiple types): 0.4% – #3,042 highest of 3,129 counties
> Adults under 65, employer-based insurance (or multiple types): 52.5% – #2,318 highest of 3,129 counties
> Adults under 65, direct-purchase insurance (or multiple types): 4.1% – #3,092 highest of 3,129 counties
[recirclink id=1089828]

28. Gaines County, TX
> Adults under 65, no health insurance: 37.2%
> Adults under 65, Medicare coverage (or multiple types): 3.4% – #2,406 highest of 3,129 counties
> Adults under 65, employer-based insurance (or multiple types): 47.7% – #2,669 highest of 3,129 counties
> Adults under 65, direct-purchase insurance (or multiple types): 7.8% – #2,751 highest of 3,129 counties

27. Dimmit County, TX
> Adults under 65, no health insurance: 37.3%
> Adults under 65, VA coverage (or multiple types): 0.3% – #3,070 highest of 3,129 counties
> Adults under 65, employer-based insurance (or multiple types): 38.8% – #2,983 highest of 3,129 counties
> Adults under 65, direct-purchase insurance (or multiple types): 7.0% – #2,897 highest of 3,129 counties
[in-text-ad-2]

26. Hudspeth County, TX
> Adults under 65, no health insurance: 37.5%
> Adults under 65, VA coverage (or multiple types): 5.6% – # 52 highest of 3,129 counties
> Adults under 65, employer-based insurance (or multiple types): 33.6% – #3,046 highest of 3,129 counties
> Adults under 65, direct-purchase insurance (or multiple types): 4.9% – #3,072 highest of 3,129 counties
25. Corson County, SD
> Adults under 65, no health insurance: 37.6%
> Adults under 65, VA coverage (or multiple types): 2.0% – #1,248 highest of 3,129 counties
> Adults under 65, employer-based insurance (or multiple types): 26.7% – #3,090 highest of 3,129 counties
> Adults under 65, direct-purchase insurance (or multiple types): 12.7% – #1,002 highest of 3,129 counties
[in-text-ad]

24. Hall County, TX
> Adults under 65, no health insurance: 38.2%
> Adults under 65, VA coverage (or multiple types): 1.9% – #1,369 highest of 3,129 counties
> Adults under 65, employer-based insurance (or multiple types): 39.4% – #2,974 highest of 3,129 counties
> Adults under 65, direct-purchase insurance (or multiple types): 16.8% – #370 highest of 3,129 counties
[recirclink id=1053569]

23. San Saba County, TX
> Adults under 65, no health insurance: 38.4%
> Adults under 65, VA coverage (or multiple types): 0.9% – #2,705 highest of 3,129 counties
> Adults under 65, employer-based insurance (or multiple types): 43.8% – #2,847 highest of 3,129 counties
> Adults under 65, direct-purchase insurance (or multiple types): 15.2% – #524 highest of 3,129 counties

22. Sioux County, ND
> Adults under 65, no health insurance: 38.5%
> Adults under 65, VA coverage (or multiple types): 1.5% – #1,913 highest of 3,129 counties
> Adults under 65, employer-based insurance (or multiple types): 29.8% – #3,066 highest of 3,129 counties
> Adults under 65, direct-purchase insurance (or multiple types): 10.4% – #1,858 highest of 3,129 counties
[in-text-ad-2]

21. Brooks County, TX
> Adults under 65, no health insurance: 40.0%> Adults under 65, VA coverage (or multiple types): 0.6% – #2,951 highest of 3,129 counties
> Adults under 65, employer-based insurance (or multiple types): 34.9% – #3,032 highest of 3,129 counties
> Adults under 65, direct-purchase insurance (or multiple types): 6.3% – #2,980 highest of 3,129 counties

20. Presidio County, TX
> Adults under 65, no health insurance: 40.0%
> Adults under 65, VA coverage (or multiple types): 0.0% – #3,116 highest of 3,129 counties
> Adults under 65, employer-based insurance (or multiple types): 41.9% – #2,924 highest of 3,129 counties
> Adults under 65, direct-purchase insurance (or multiple types): 7.0% – #2,897 highest of 3,129 counties
[in-text-ad]

19. Dewey County, SD
> Adults under 65, no health insurance: 40.1%
> Adults under 65, VA coverage (or multiple types): 1.4% – #2,085 highest of 3,129 counties
> Adults under 65, employer-based insurance (or multiple types): 33.8% – #3,043 highest of 3,129 counties
> Adults under 65, direct-purchase insurance (or multiple types): 7.8% – #2,751 highest of 3,129 counties
[recirclink id=1073006]

18. Willacy County, TX
> Adults under 65, no health insurance: 40.4%
> Adults under 65, VA coverage (or multiple types): 2.8% – #537 highest of 3,129 counties
> Adults under 65, employer-based insurance (or multiple types): 33.8% – #3,043 highest of 3,129 counties
> Adults under 65, direct-purchase insurance (or multiple types): 8.0% – #2,710 highest of 3,129 counties
17. Jackson County, SD
> Adults under 65, no health insurance: 40.4%
> Adults under 65, VA coverage (or multiple types): 3.9% – #188 highest of 3,129 counties
> Adults under 65, employer-based insurance (or multiple types): 35.5% – #3,025 highest of 3,129 counties
> Adults under 65, direct-purchase insurance (or multiple types): 7.4% – #2,834 highest of 3,129 counties
[in-text-ad-2]

16. LaGrange County, IN
> Adults under 65, no health insurance: 40.7%
> Adults under 65, VA coverage (or multiple types): 0.9% – #2,705 highest of 3,129 counties
> Adults under 65, employer-based insurance (or multiple types): 46.4% – #2,730 highest of 3,129 counties
> Adults under 65, direct-purchase insurance (or multiple types): 5.6% – #3,033 highest of 3,129 counties
15. Holmes County, OH
> Adults under 65, no health insurance: 41.2%
> Adults under 65, VA coverage (or multiple types): 0.7% – #2,878 highest of 3,129 counties
> Adults under 65, employer-based insurance (or multiple types): 42.2% – #2,915 highest of 3,129 counties
> Adults under 65, direct-purchase insurance (or multiple types): 10.1% – #1,990 highest of 3,129 counties
[in-text-ad]

14. Webb County, TX
> Adults under 65, no health insurance: 41.4%
> Adults under 65, VA coverage (or multiple types): 1.0% – #2,609 highest of 3,129 counties
> Adults under 65, employer-based insurance (or multiple types): 41.5% – #2,933 highest of 3,129 counties
> Adults under 65, direct-purchase insurance (or multiple types): 10.4% – #1,858 highest of 3,129 counties
[recirclink id=1085403]
13. Cameron County, TX
> Adults under 65, no health insurance: 41.7%
> Adults under 65, VA coverage (or multiple types): 1.4% – #2,085 highest of 3,129 counties
> Adults under 65, employer-based insurance (or multiple types): 40.2% – #2,958 highest of 3,129 counties
> Adults under 65, direct-purchase insurance (or multiple types): 7.5% – #2,806 highest of 3,129 counties

12. Maverick County, TX
> Adults under 65, no health insurance: 41.7%
> Adults under 65, VA coverage (or multiple types): 0.6% – #2,951 highest of 3,129 counties
> Adults under 65, employer-based insurance (or multiple types): 43.3% – #2,868 highest of 3,129 counties
> Adults under 65, direct-purchase insurance (or multiple types): 7.9% – #2,731 highest of 3,129 counties
[in-text-ad-2]

11. Ziebach County, SD
> Adults under 65, no health insurance: 41.8%
> Adults under 65, VA coverage (or multiple types): 1.6% – #1,764 highest of 3,129 counties
> Adults under 65, employer-based insurance (or multiple types): 26.2% – #3,092 highest of 3,129 counties
> Adults under 65, direct-purchase insurance (or multiple types): 12.1% – #1,189 highest of 3,129 counties

10. Zapata County, TX
> Adults under 65, no health insurance: 42.5%
> Adults under 65, VA coverage (or multiple types): 0.7% – #2,878 highest of 3,129 counties
> Adults under 65, employer-based insurance (or multiple types): 34.9% – #3,032 highest of 3,129 counties
> Adults under 65, direct-purchase insurance (or multiple types): 11.6% – #1,377 highest of 3,129 counties
[in-text-ad]

9. Real County, TX
> Adults under 65, no health insurance: 44.1%
> Adults under 65, VA coverage (or multiple types): 0.0% – #3,116 highest of 3,129 counties
> Adults under 65, employer-based insurance (or multiple types): 31.2% – #3,057 highest of 3,129 counties
> Adults under 65, direct-purchase insurance (or multiple types): 7.5% – #2,806 highest of 3,129 counties
[recirclink id=1087270]
8. Hidalgo County, TX
> Adults under 65, no health insurance: 45.5%
> Adults under 65, VA coverage (or multiple types): 1.1% – #2,485 highest of 3,129 counties
> Adults under 65, employer-based insurance (or multiple types): 36.7% – #3,012 highest of 3,129 counties
> Adults under 65, direct-purchase insurance (or multiple types): 9.7% – #2,163 highest of 3,129 counties

7. Aleutians East Borough, AK
> Adults under 65, no health insurance: 46.8%
> Adults under 65, VA coverage (or multiple types): 0.8% – #2,793 highest of 3,129 counties
> Adults under 65, employer-based insurance (or multiple types): 40.9% – #2,943 highest of 3,129 counties
> Adults under 65, direct-purchase insurance (or multiple types): 3.5% – #3,107 highest of 3,129 counties
[in-text-ad-2]

6. Glacier County, MT
> Adults under 65, no health insurance: 47.9%
> Adults under 65, VA coverage (or multiple types): 2.1% – #1,133 highest of 3,129 counties
> Adults under 65, employer-based insurance (or multiple types): 26.6% – #3,091 highest of 3,129 counties
> Adults under 65, direct-purchase insurance (or multiple types): 3.2% – #3,112 highest of 3,129 counties

5. Starr County, TX
> Adults under 65, no health insurance: 48.9%
> Adults under 65, VA coverage (or multiple types): 0.5% – #3,000 highest of 3,129 counties
> Adults under 65, employer-based insurance (or multiple types): 31.6% – #3,054 highest of 3,129 counties
> Adults under 65, direct-purchase insurance (or multiple types): 6.9% – #2,908 highest of 3,129 counties
[in-text-ad]

4. Todd County, SD
> Adults under 65, no health insurance: 50.0%
> Adults under 65, VA coverage (or multiple types): 0.9% – #2,705 highest of 3,129 counties
> Adults under 65, employer-based insurance (or multiple types): 20.4% – #3,118 highest of 3,129 counties
> Adults under 65, direct-purchase insurance (or multiple types): 2.4% – #3,119 highest of 3,129 counties
[recirclink id=1089828]

3. Mellette County, SD
> Adults under 65, no health insurance: 54.5%
> Adults under 65, VA coverage (or multiple types): 0.3% – #3,070 highest of 3,129 counties
> Adults under 65, employer-based insurance (or multiple types): 17.5% – #3,126 highest of 3,129 counties
> Adults under 65, direct-purchase insurance (or multiple types): 8.7% – #2,524 highest of 3,129 counties

2. Oglala Lakota County, SD
> Adults under 65, no health insurance: 55.4%
> Adults under 65, VA coverage (or multiple types): 1.3% – #2,226 highest of 3,129 counties
> Adults under 65, employer-based insurance (or multiple types): 17.5% – #3,126 highest of 3,129 counties
> Adults under 65, direct-purchase insurance (or multiple types): 2.2% – #3,121 highest of 3,129 counties
[in-text-ad-2]
1. Buffalo County, SD
> Adults under 65, no health insurance: 58.1%
> Adults under 65, VA coverage (or multiple types): 1.4% – #2,085 highest of 3,129 counties
> Adults under 65, employer-based insurance (or multiple types): 13.6% – #3,129 highest of 3,129 counties
> Adults under 65, direct-purchase insurance (or multiple types): 5.2% – #3,051 highest of 3,129 counties
Methodology
To determine the counties with the worst health insurance coverage in the nation, 24/7 Tempo reviewed five-year estimates of the percentage of the noninstitutionalized civilian population between the ages of 19 and 65 without health insurance from the U.S. Census Bureau’s 2020 American Community Survey.
Counties were excluded if the noninstitutionalized civilian population under 65 was less than 1,000, or if the sampling error associated with a county’s data was 15% or greater.
We selected the under 65 age group because Americans become eligible for Medicare at age 65, and the uninsured rate for the population above this age is less than 1% nationwide. However, because the census doesn’t publish insurance coverage estimates specifically for the under 65 age group, we aggregated the data from more granular age breakdowns.
The shares of the population covered by VA, employer, and direct-purchase insurance are for the same cohort and are also aggregated from five-year ACS estimates. The estimates reflect people who are covered by that type of insurance alone or in combination with other types on the list. When a person is covered by more than one type of insurance, that is, they are included in each group.
Contact [email protected] for any questions or corrections.