During the COVID-19 pandemic, many parents with children under the age of 18 left the workforce. With schools across the country shifting to remote learning, it made more financial sense for many parents to give up their job and stay home with their children rather than pay for child care – especially as child care costs skyrocketed during the pandemic.
According to the Economic Policy Institute, a nonprofit think tank, a family with two children, age four and eight, is projected to pay an average of $16,659 on child care in 2022. This amount varies across the country, however, from state to state, and city to city.
Using data from the EPI’s Family Budget Calculator, 24/7 Wall St. identified the metro area in each state where families pay the least for child care. Metro areas in each state were ranked on estimated child care expenditure in 2022 for two children, age four and eight.
It is important to note that four states – Delaware, New Hampshire, Rhode Island, and Vermont – each have only one metro area. As a result, the metro area in these places ranks as having the lowest child care costs by default only. Among the metro areas on this list, estimated average child care costs range from $8,321 up to $25,798 – and in most cases, they are over $500 less than the statewide average. Here is a look at the best and worst states to raise a family.
As is often the case with factors that affect cost of living, child care costs appear to be driven in part by what residents can afford. In the vast majority of metro areas on this list, the median annual family income is below the median across the state as a whole. Here is a look at the income needed to be middle class in each state.
Click here to see the city with the lowest child care costs in every state
Click here to read our detailed methodology

Alabama: Decatur
> Est. annual child care costs (2 children): $12,826 (Alabama: $13,811)
> Median family income: $65,097 (Alabama: $66,772)
> Share of population under age 15: 18.7% (Alabama: 18.5%)
> Share of households occupied by families: 67.2% (Alabama: 65.4%)
> No. of metros considered in ranking: 12
[in-text-ad]

Alaska: Anchorage
> Est. annual child care costs (2 children): $23,882 (Alaska: $22,447)
> Median family income: $98,403 (Alaska: $92,648)
> Share of population under age 15: 20.9% (Alaska: 21.0%)
> Share of households occupied by families: 66.4% (Alaska: 65.8%)
> No. of metros considered in ranking: 2
[recirclink id=1076681]

Arizona: Sierra Vista-Douglas
> Est. annual child care costs (2 children): $15,567 (Arizona: $17,391)
> Median family income: $64,128 (Arizona: $73,456)
> Share of population under age 15: 17.9% (Arizona: 18.9%)
> Share of households occupied by families: 62.2% (Arizona: 65.1%)
> No. of metros considered in ranking: 7
Arkansas: Pine Bluff
> Est. annual child care costs (2 children): $12,509 (Arkansas: $11,931)
> Median family income: $53,908 (Arkansas: $62,067)
> Share of population under age 15: 17.5% (Arkansas: 19.4%)
> Share of households occupied by families: 63.7% (Arkansas: 65.8%)
> No. of metros considered in ranking: 6
[in-text-ad-2]
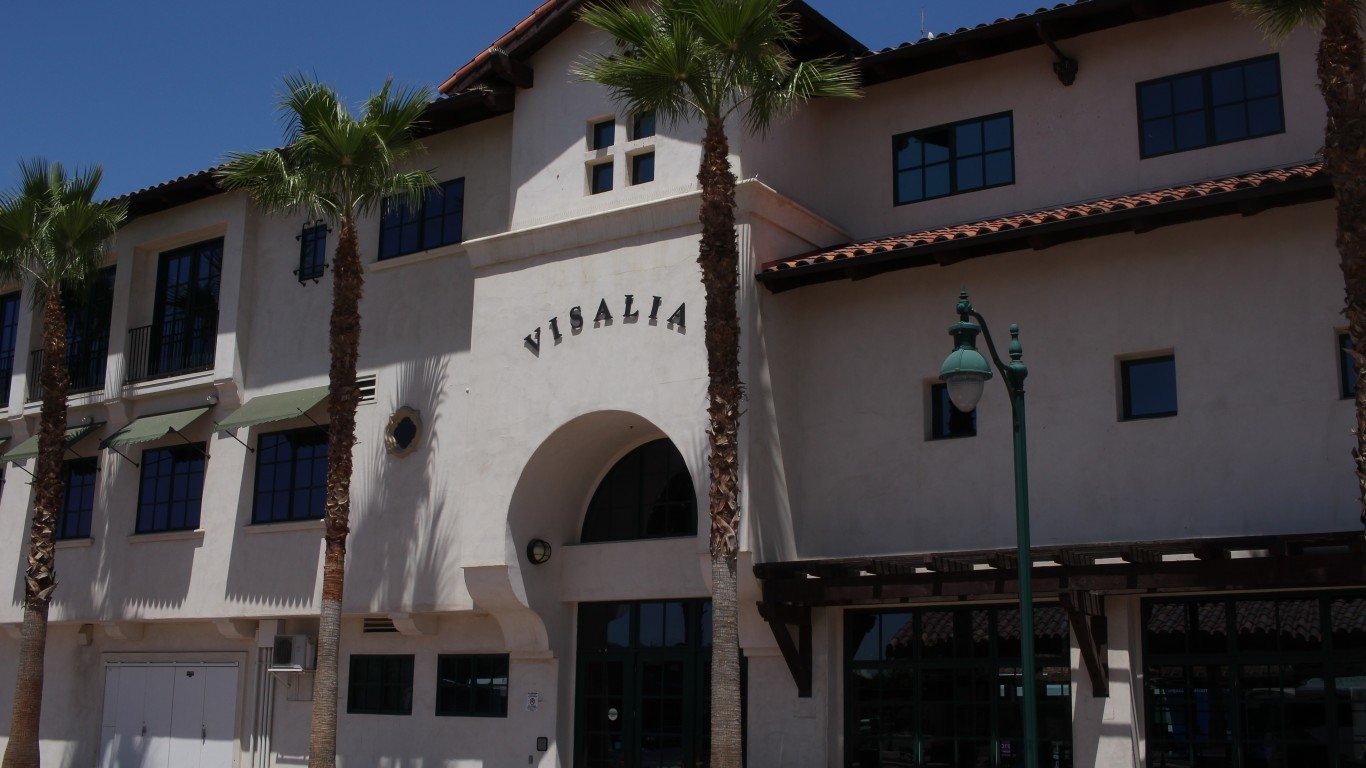
California: Visalia
> Est. annual child care costs (2 children): $11,834 (California: $15,816)
> Median family income: $55,395 (California: $89,798)
> Share of population under age 15: 25.7% (California: 18.9%)
> Share of households occupied by families: 77.9% (California: 68.6%)
> No. of metros considered in ranking: 26

Colorado: Pueblo
> Est. annual child care costs (2 children): $15,702 (Colorado: $19,418)
> Median family income: $62,959 (Colorado: $92,752)
> Share of population under age 15: 18.5% (Colorado: 18.4%)
> Share of households occupied by families: 61.7% (Colorado: 63.6%)
> No. of metros considered in ranking: 7
[in-text-ad]

Connecticut: Norwich-New London
> Est. annual child care costs (2 children): $17,420 (Connecticut: $18,113)
> Median family income: $94,894 (Connecticut: $102,061)
> Share of population under age 15: 15.9% (Connecticut: 16.7%)
> Share of households occupied by families: 65.2% (Connecticut: 65.2%)
> No. of metros considered in ranking: 4
[recirclink id=1085348]

Delaware: Dover
> Est. annual child care costs (2 children): $14,780 (Delaware: $14,930)
> Median family income: $70,383 (Delaware: $84,825)
> Share of population under age 15: 19.1% (Delaware: 17.5%)
> Share of households occupied by families: 67.6% (Delaware: 65.5%)
> No. of metros considered in ranking: 1
*Because Dover is the only eligible metro in Delaware, it is the metro with the lowest highest child care costs by default.
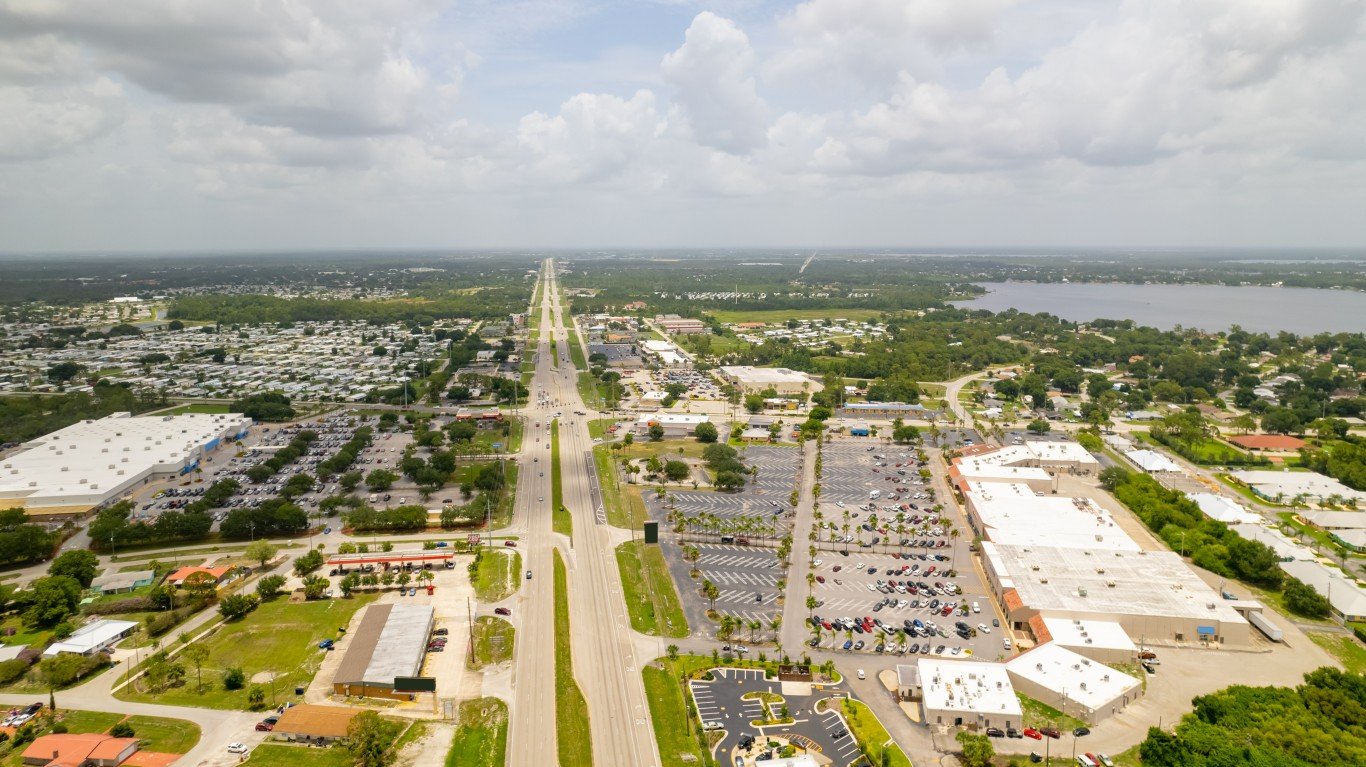
Florida: Sebring-Avon Park
> Est. annual child care costs (2 children): $10,626 (Florida: $12,948)
> Median family income: $52,793 (Florida: $69,670)
> Share of population under age 15: 14.1% (Florida: 16.4%)
> Share of households occupied by families: 63.6% (Florida: 64.5%)
> No. of metros considered in ranking: 22
[in-text-ad-2]

Georgia: Dalton
> Est. annual child care costs (2 children): $10,094 (Georgia: $11,399)
> Median family income: $58,145 (Georgia: $74,127)
> Share of population under age 15: 21.0% (Georgia: 19.7%)
> Share of households occupied by families: 72.6% (Georgia: 67.0%)
> No. of metros considered in ranking: 14

Hawaii: Kahului-Wailuku-Lahaina
> Est. annual child care costs (2 children): $17,835 (Hawaii: $18,852)
> Median family income: $92,627 (Hawaii: $97,813)
> Share of population under age 15: 18.2% (Hawaii: 18.0%)
> Share of households occupied by families: 71.3% (Hawaii: 69.3%)
> No. of metros considered in ranking: 2
[in-text-ad]

Idaho: Pocatello
> Est. annual child care costs (2 children): $13,517 (Idaho: $14,012)
> Median family income: $66,208 (Idaho: $70,885)
> Share of population under age 15: 21.9% (Idaho: 21.0%)
> Share of households occupied by families: 64.1% (Idaho: 68.0%)
> No. of metros considered in ranking: 5
[recirclink id=1087666]

Illinois: Danville
> Est. annual child care costs (2 children): $15,468 (Illinois: $18,131)
> Median family income: $60,958 (Illinois: $86,251)
> Share of population under age 15: 19.6% (Illinois: 18.5%)
> Share of households occupied by families: 61.4% (Illinois: 63.8%)
> No. of metros considered in ranking: 9

Indiana: Muncie
> Est. annual child care costs (2 children): $17,891 (Indiana: $18,107)
> Median family income: $61,415 (Indiana: $73,265)
> Share of population under age 15: 14.9% (Indiana: 19.4%)
> Share of households occupied by families: 58.4% (Indiana: 64.5%)
> No. of metros considered in ranking: 12
[in-text-ad-2]

Iowa: Cedar Rapids
> Est. annual child care costs (2 children): $13,988 (Iowa: $12,837)
> Median family income: $85,854 (Iowa: $79,186)
> Share of population under age 15: 19.1% (Iowa: 19.2%)
> Share of households occupied by families: 63.4% (Iowa: 62.9%)
> No. of metros considered in ranking: 8

Kansas: Topeka
> Est. annual child care costs (2 children): $14,535 (Kansas: $13,976)
> Median family income: $75,758 (Kansas: $77,620)
> Share of population under age 15: 19.5% (Kansas: 20.2%)
> Share of households occupied by families: 63.9% (Kansas: 64.6%)
> No. of metros considered in ranking: 4
[in-text-ad]

Kentucky: Owensboro
> Est. annual child care costs (2 children): $14,852 (Kentucky: $13,879)
> Median family income: $68,358 (Kentucky: $65,893)
> Share of population under age 15: 20.3% (Kentucky: 18.7%)
> Share of households occupied by families: 67.5% (Kentucky: 65.2%)
> No. of metros considered in ranking: 5
[recirclink id=1086915]

Louisiana: Monroe
> Est. annual child care costs (2 children): $9,106 (Louisiana: $9,718)
> Median family income: $56,295 (Louisiana: $65,427)
> Share of population under age 15: 20.3% (Louisiana: 19.6%)
> Share of households occupied by families: 61.7% (Louisiana: 63.7%)
> No. of metros considered in ranking: 9

Maine: Lewiston-Auburn
> Est. annual child care costs (2 children): $12,647 (Maine: $12,929)
> Median family income: $70,817 (Maine: $76,192)
> Share of population under age 15: 18.0% (Maine: 15.3%)
> Share of households occupied by families: 60.5% (Maine: 61.4%)
> No. of metros considered in ranking: 3
[in-text-ad-2]

Maryland: Cumberland
> Est. annual child care costs (2 children): $13,749 (Maryland: $17,251)
> Median family income: $63,095 (Maryland: $105,790)
> Share of population under age 15: 14.8% (Maryland: 18.4%)
> Share of households occupied by families: 61.9% (Maryland: 66.3%)
> No. of metros considered in ranking: 5

Massachusetts: Pittsfield
> Est. annual child care costs (2 children): $21,659 (Massachusetts: $26,377)
> Median family income: $82,207 (Massachusetts: $106,526)
> Share of population under age 15: 13.6% (Massachusetts: 16.2%)
> Share of households occupied by families: 58.0% (Massachusetts: 63.2%)
> No. of metros considered in ranking: 5
[in-text-ad]

Michigan: Flint
> Est. annual child care costs (2 children): $15,917 (Michigan: $17,276)
> Median family income: $62,084 (Michigan: $75,470)
> Share of population under age 15: 18.5% (Michigan: 17.8%)
> Share of households occupied by families: 63.6% (Michigan: 63.5%)
> No. of metros considered in ranking: 14
[recirclink id=1012509]

Minnesota: Duluth
> Est. annual child care costs (2 children): $19,110 (Minnesota: $20,635)
> Median family income: $77,796 (Minnesota: $92,692)
> Share of population under age 15: 16.1% (Minnesota: 19.3%)
> Share of households occupied by families: 58.3% (Minnesota: 63.6%)
> No. of metros considered in ranking: 5

Mississippi: Hattiesburg
> Est. annual child care costs (2 children): $8,321 (Mississippi: $6,215)
> Median family income: $58,430 (Mississippi: $58,923)
> Share of population under age 15: 20.0% (Mississippi: 19.6%)
> Share of households occupied by families: 67.6% (Mississippi: 66.3%)
> No. of metros considered in ranking: 3
[in-text-ad-2]

Missouri: Jefferson City
> Est. annual child care costs (2 children): $12,213 (Missouri: $12,936)
> Median family income: $75,505 (Missouri: $72,834)
> Share of population under age 15: 18.5% (Missouri: 18.7%)
> Share of households occupied by families: 65.4% (Missouri: 63.6%)
> No. of metros considered in ranking: 8

Montana: Great Falls
> Est. annual child care costs (2 children): $17,324 (Montana: $17,025)
> Median family income: $67,789 (Montana: $72,773)
> Share of population under age 15: 19.1% (Montana: 17.9%)
> Share of households occupied by families: 60.8% (Montana: 61.3%)
> No. of metros considered in ranking: 3
[in-text-ad]

Nebraska: Omaha-Council Bluffs
> Est. annual child care costs (2 children): $20,221 (Nebraska: $18,934)
> Median family income: $87,733 (Nebraska: $80,125)
> Share of population under age 15: 21.4% (Nebraska: 20.6%)
> Share of households occupied by families: 64.6% (Nebraska: 63.8%)
> No. of metros considered in ranking: 2
[recirclink id=1076681]

Nevada: Carson City
> Est. annual child care costs (2 children): $16,340 (Nevada: $17,051)
> Median family income: $69,727 (Nevada: $74,077)
> Share of population under age 15: 16.9% (Nevada: 18.9%)
> Share of households occupied by families: 62.7% (Nevada: 63.7%)
> No. of metros considered in ranking: 3

New Hampshire: Manchester-Nashua
> Est. annual child care costs (2 children): $16,390 (New Hampshire: $15,612)
> Median family income: $103,238 (New Hampshire: $97,001)
> Share of population under age 15: 16.7% (New Hampshire: 15.5%)
> Share of households occupied by families: 64.7% (New Hampshire: 65.2%)
> No. of metros considered in ranking: 1
*Because Manchester-Nashua is the only eligible metro in New Hampshire, it is the metro with the lowest highest child care costs by default.
[in-text-ad-2]
New Jersey: Ocean City
> Est. annual child care costs (2 children): $18,197 (New Jersey: $20,144)
> Median family income: $87,716 (New Jersey: $104,804)
> Share of population under age 15: 14.4% (New Jersey: 18.1%)
> Share of households occupied by families: 66.6% (New Jersey: 68.7%)
> No. of metros considered in ranking: 4

New Mexico: Las Cruces
> Est. annual child care costs (2 children): $13,601 (New Mexico: $14,800)
> Median family income: $51,928 (New Mexico: $62,611)
> Share of population under age 15: 20.4% (New Mexico: 19.1%)
> Share of households occupied by families: 65.6% (New Mexico: 62.7%)
> No. of metros considered in ranking: 4
[in-text-ad]

New York: Utica-Rome
> Est. annual child care costs (2 children): $23,900 (New York: $31,874)
> Median family income: $75,037 (New York: $87,270)
> Share of population under age 15: 17.4% (New York: 17.3%)
> Share of households occupied by families: 63.1% (New York: 63.0%)
> No. of metros considered in ranking: 13
[recirclink id=1085348]

North Carolina: Hickory-Lenoir-Morganton
> Est. annual child care costs (2 children): $12,201 (North Carolina: $13,940)
> Median family income: $60,878 (North Carolina: $70,978)
> Share of population under age 15: 16.8% (North Carolina: 18.3%)
> Share of households occupied by families: 68.2% (North Carolina: 65.1%)
> No. of metros considered in ranking: 14

North Dakota: Grand Forks
> Est. annual child care costs (2 children): $25,798 (North Dakota: $20,541)
> Median family income: $82,257 (North Dakota: $86,798)
> Share of population under age 15: 18.7% (North Dakota: 19.9%)
> Share of households occupied by families: 53.8% (North Dakota: 59.0%)
> No. of metros considered in ranking: 3
[in-text-ad-2]

Ohio: Canton-Massillon
> Est. annual child care costs (2 children): $13,705 (Ohio: $14,489)
> Median family income: $70,028 (Ohio: $74,391)
> Share of population under age 15: 17.5% (Ohio: 18.3%)
> Share of households occupied by families: 63.8% (Ohio: 62.6%)
> No. of metros considered in ranking: 11

Oklahoma: Lawton
> Est. annual child care costs (2 children): $14,517 (Oklahoma: $14,910)
> Median family income: $65,335 (Oklahoma: $67,511)
> Share of population under age 15: 19.9% (Oklahoma: 20.2%)
> Share of households occupied by families: 64.9% (Oklahoma: 65.3%)
> No. of metros considered in ranking: 4
[in-text-ad]

Oregon: Medford
> Est. annual child care costs (2 children): $17,344 (Oregon: $19,026)
> Median family income: $70,436 (Oregon: $80,630)
> Share of population under age 15: 17.2% (Oregon: 17.2%)
> Share of households occupied by families: 63.7% (Oregon: 63.0%)
> No. of metros considered in ranking: 8
[recirclink id=1087666]

Pennsylvania: Johnstown
> Est. annual child care costs (2 children): $16,467 (Pennsylvania: $19,039)
> Median family income: $65,560 (Pennsylvania: $80,996)
> Share of population under age 15: 15.7% (Pennsylvania: 17.1%)
> Share of households occupied by families: 61.5% (Pennsylvania: 63.7%)
> No. of metros considered in ranking: 17

Rhode Island: Providence-Warwick
> Est. annual child care costs (2 children): $20,580 (Rhode Island: $18,589)
> Median family income: $89,555 (Rhode Island: $89,330)
> Share of population under age 15: 16.3% (Rhode Island: 15.9%)
> Share of households occupied by families: 63.4% (Rhode Island: 62.2%)
> No. of metros considered in ranking: 1
*Because Providence-Warwick is the only eligible metro in Rhode Island, it is the metro with the lowest highest child care costs by default.
[in-text-ad-2]

South Carolina: Florence
> Est. annual child care costs (2 children): $9,232 (South Carolina: $9,741)
> Median family income: $58,215 (South Carolina: $68,813)
> Share of population under age 15: 19.1% (South Carolina: 18.0%)
> Share of households occupied by families: 64.1% (South Carolina: 65.3%)
> No. of metros considered in ranking: 7

South Dakota: Sioux Falls
> Est. annual child care costs (2 children): $14,734 (South Dakota: $13,056)
> Median family income: $84,874 (South Dakota: $77,042)
> Share of population under age 15: 22.0% (South Dakota: 20.6%)
> Share of households occupied by families: 63.8% (South Dakota: 62.9%)
> No. of metros considered in ranking: 2
[in-text-ad]

Tennessee: Johnson City
> Est. annual child care costs (2 children): $10,761 (Tennessee: $11,647)
> Median family income: $60,890 (Tennessee: $68,793)
> Share of population under age 15: 15.4% (Tennessee: 18.5%)
> Share of households occupied by families: 62.5% (Tennessee: 65.4%)
> No. of metros considered in ranking: 10
[recirclink id=1086915]

Texas: McAllen-Edinburg-Mission
> Est. annual child care costs (2 children): $10,320 (Texas: $12,449)
> Median family income: $46,609 (Texas: $76,073)
> Share of population under age 15: 27.2% (Texas: 21.5%)
> Share of households occupied by families: 80.2% (Texas: 69.0%)
> No. of metros considered in ranking: 25

Utah: Logan
> Est. annual child care costs (2 children): $14,005 (Utah: $16,111)
> Median family income: $69,237 (Utah: $84,590)
> Share of population under age 15: 25.4% (Utah: 24.6%)
> Share of households occupied by families: 76.6% (Utah: 74.4%)
> No. of metros considered in ranking: 5
[in-text-ad-2]

Vermont: Burlington-South Burlington
> Est. annual child care costs (2 children): $20,476 (Vermont: $16,503)
> Median family income: $95,011 (Vermont: $83,023)
> Share of population under age 15: 15.3% (Vermont: 15.1%)
> Share of households occupied by families: 59.2% (Vermont: 59.8%)
> No. of metros considered in ranking: 1
*Because Burlington-South Burlington is the only eligible metro in Vermont, it is the metro with the lowest highest child care costs by default.

Virginia: Lynchburg
> Est. annual child care costs (2 children): $14,014 (Virginia: $17,347)
> Median family income: $70,981 (Virginia: $93,284)
> Share of population under age 15: 16.3% (Virginia: 18.2%)
> Share of households occupied by families: 66.9% (Virginia: 66.0%)
> No. of metros considered in ranking: 9
[in-text-ad]

Washington: Kennewick-Richland
> Est. annual child care costs (2 children): $16,039 (Washington: $18,876)
> Median family income: $80,918 (Washington: $92,422)
> Share of population under age 15: 23.9% (Washington: 18.4%)
> Share of households occupied by families: 71.4% (Washington: 64.5%)
> No. of metros considered in ranking: 10
[recirclink id=1012509]

West Virginia: Weirton-Steubenville
> Est. annual child care costs (2 children): $14,358 (West Virginia: $14,553)
> Median family income: $61,496 (West Virginia: $61,707)
> Share of population under age 15: 15.4% (West Virginia: 16.7%)
> Share of households occupied by families: 61.6% (West Virginia: 64.1%)
> No. of metros considered in ranking: 6

Wisconsin: Sheboygan
> Est. annual child care costs (2 children): $15,736 (Wisconsin: $17,092)
> Median family income: $76,845 (Wisconsin: $80,844)
> Share of population under age 15: 18.1% (Wisconsin: 18.1%)
> Share of households occupied by families: 63.1% (Wisconsin: 62.2%)
> No. of metros considered in ranking: 12
[in-text-ad-2]

Wyoming: Casper
> Est. annual child care costs (2 children): $20,486 (Wyoming: $20,746)
> Median family income: $78,926 (Wyoming: $81,290)
> Share of population under age 15: 20.0% (Wyoming: 19.4%)
> Share of households occupied by families: 62.7% (Wyoming: 64.0%)
> No. of metros considered in ranking: 2
Methodology
To determine the metro areas with the lowest child care costs for a family of four in every state, 24/7 Wall St. reviewed data on child care costs from the Economic Policy Institute’s 2022 Family Budget Calculator.
In the Family Budget Calculator, the EPI estimates the annual child care budget necessary for families to maintain a modest yet adequate standard of living. The budgets are created for 10 family types for U.S. counties and metro areas. To estimate child care costs for a family of four, the EPI assumes families consist of a married couple with one 4-year-old child and one school-age child.
State-level child care cost estimates are aggregated from the county level using five-year estimates of total households from the U.S. Census Bureau’s 2020 American Community Survey.
We used the 384 metropolitan statistical areas as delineated by the United States Office of Management and Budget and used by the Census Bureau as our definition of metros.
Metro areas in each state are ranked based on the EPI’s annual child care cost estimates to find the metro with the highest cost. Additional information on median family income, the share of the population that is under the age of 15, and the share of households that are occupied by families are from the U.S. Census Bureau’s 2020 American Community Survey. Because the Census Bureau didn’t release one-year estimates for 2020 due to data collection issues caused by the COVID-19 pandemic, all ACS data are five-year estimates.
Contact [email protected] for any questions or corrections.