
America’s high-tech sector has been a key driver of economic growth in recent years – and this will likely continue. STEM fields – those in the areas of science, technology, engineering, and mathematics – are critical for the U.S. to remain competitive globally. According to the Bureau of Labor Statistics, which refers to STEM careers as “tomorrow’s jobs,” employment in STEM occupations is projected to grow by 10.5% between 2020 and 2030, compared to 7.5% growth in non-STEM jobs.
Workers in high-tech industries also tend to be better compensated than those working in other sectors. The typical worker in a STEM occupation earned $95,420 in 2021, more than double the median wage of $40,120 in non-STEM jobs.
While demand for STEM workers is growing nationwide, high-tech jobs tend to be concentrated in some major cities. Using data from th BLS, 24/7 Wall St. identified the 25 metropolitan areas with the most high-tech jobs. Metro areas are ranked by the share of workers employed in high-tech occupations.
Many of the metro areas on this list are home to hubs of corporate tech giants. These places include Austin, Texas – home to Dell Technologies, Amazon, Apple, and IBM; Denver, Colorado – home to Cisco, Amazon, and Facebook; and, not surprisingly, California’s Silicon Valley and Bay Area – home the the headquarters of many of the largest tech companies in the world as well as thousands of tech startups. Here is a look at the city with the fastest job growth in America.
In most metro areas on this list, the average pay among STEM workers is at least twice as high as the average pay for all workers in the metro area. Here is a look at the best paying large companies in America.
Click here to see 25 cities where the most people work in tech
Click here to read our detailed methodology
Editor’s note: In a previous version of this article, metro area tech worker wages were compared to wage statistics for tech workers across all U.S. metro areas. The correct context is overall wages for the metro area in question only. This error has been corrected.

25. Cincinnati, OH-KY-IN
> High-tech sector employment: 10.3% of workforce (103,624 jobs)
> Avg. annual high-tech pay: $126,973 (2.1 times above metro area avg.)
> Adults with bachelor’s degree or higher: 34.5%
> Most concentrated high-tech field: Aerospace product and parts manufacturing (1.1% of workforce, 3.0 times the national share)
[in-text-ad]

24. Raleigh, NC
> High-tech sector employment: 10.3% of workforce (63,383 jobs)
> Avg. annual high-tech pay: $205,393 (3.3 times above metro area avg.)
> Adults with bachelor’s degree or higher: 47.8%
> Most concentrated high-tech field: Architectural and engineering services (2.1% of workforce, 2.0 times the national share)
[recirclink id=1107968]

23. Houston-The Woodlands-Sugar Land, TX
> High-tech sector employment: 10.4% of workforce (298,361 jobs)
> Avg. annual high-tech pay: $174,781 (2.5 times above metro area avg.)
> Adults with bachelor’s degree or higher: 33.6%
> Most concentrated high-tech field: Oil and gas extraction (1.2% of workforce, 13.0 times the national share)

22. Dallas-Fort Worth-Arlington, TX
> High-tech sector employment: 10.5% of workforce (366,874 jobs)
> Avg. annual high-tech pay: $163,544 (2.4 times above metro area avg.)
> Adults with bachelor’s degree or higher: 36.0%
> Most concentrated high-tech field: Computer systems design and related services (2.4% of workforce, 1.5 times the national share)
[in-text-ad-2]

21. St. Louis, MO-IL
> High-tech sector employment: 10.5% of workforce (132,315 jobs)
> Avg. annual high-tech pay: $124,487 (2.1 times above metro area avg.)
> Adults with bachelor’s degree or higher: 35.4%
> Most concentrated high-tech field: Aerospace product and parts manufacturing (1.4% of workforce, 3.8 times the national share)
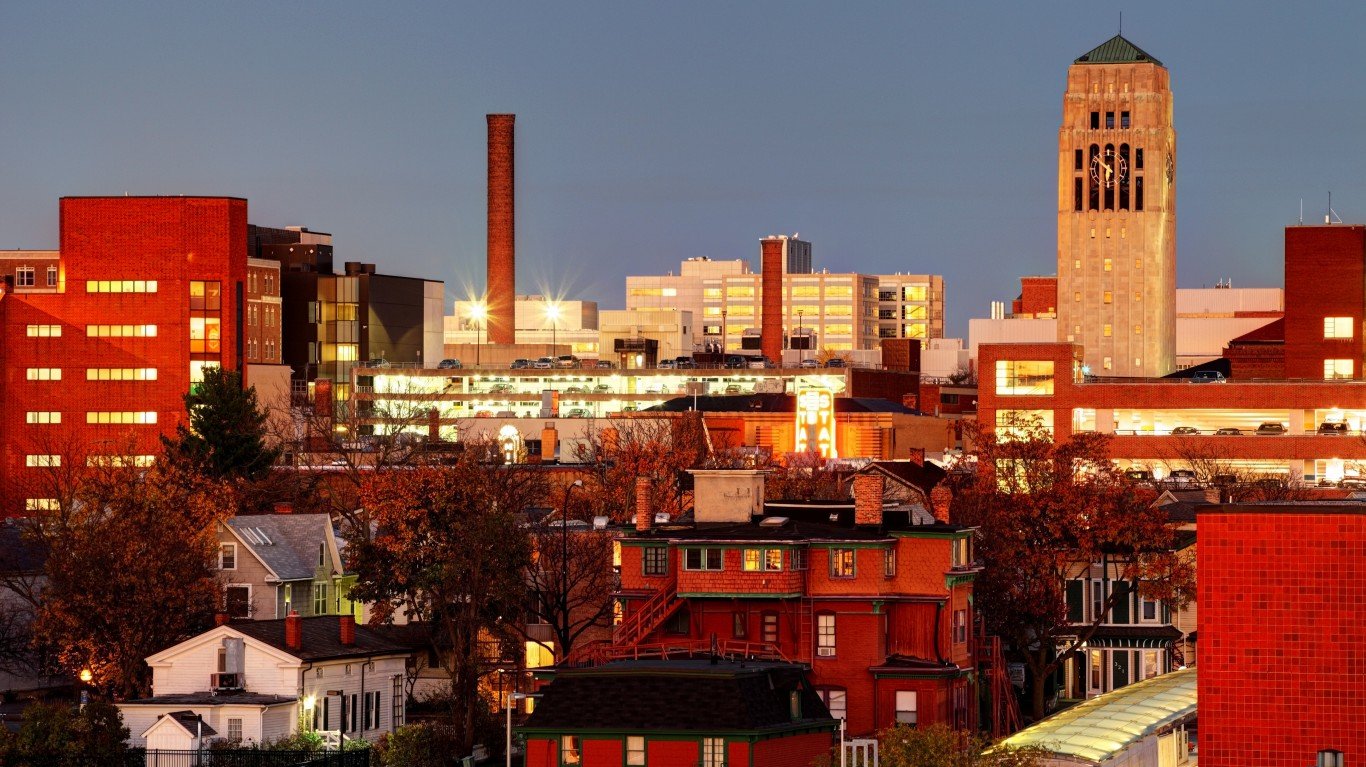
20. Ann Arbor, MI
> High-tech sector employment: 10.8% of workforce (21,782 jobs)
> Avg. annual high-tech pay: $142,542 (2.1 times above metro area avg.)
> Adults with bachelor’s degree or higher: 56.7%
> Most concentrated high-tech field: Scientific research and development services (1.8% of workforce, 3.3 times the national share)
[in-text-ad]

19. Pittsburgh, PA
> High-tech sector employment: 10.8% of workforce (111,808 jobs)
> Avg. annual high-tech pay: $147,225 (2.4 times above metro area avg.)
> Adults with bachelor’s degree or higher: 35.9%
> Most concentrated high-tech field: Management of companies and enterprises (3.2% of workforce, 1.9 times the national share)
[recirclink id=1029855]
18. Bridgeport-Stamford-Norwalk, CT
> High-tech sector employment: 10.9% of workforce (41,709 jobs)
> Avg. annual high-tech pay: $189,069 (2.0 times above metro area avg.)
> Adults with bachelor’s degree or higher: 48.9%
> Most concentrated high-tech field: Scientific research and development services (1.0% of workforce, 1.8 times the national share)

17. Baltimore-Columbia-Towson, MD
> High-tech sector employment: 11.1% of workforce (138,771 jobs)
> Avg. annual high-tech pay: $128,428 (1.9 times above metro area avg.)
> Adults with bachelor’s degree or higher: 41.0%
> Most concentrated high-tech field: Scientific research and development services (1.1% of workforce, 1.9 times the national share)
[in-text-ad-2]

16. Atlanta-Sandy Springs-Roswell, GA
> High-tech sector employment: 11.6% of workforce (294,940 jobs)
> Avg. annual high-tech pay: $123,035 (1.9 times above metro area avg.)
> Adults with bachelor’s degree or higher: 39.5%
> Most concentrated high-tech field: Management of companies and enterprises (3.0% of workforce, 1.8 times the national share)

15. Trenton, NJ
> High-tech sector employment: 11.9% of workforce (29,237 jobs)
> Avg. annual high-tech pay: $196,740 (2.4 times above metro area avg.)
> Adults with bachelor’s degree or higher: 43.5%
> Most concentrated high-tech field: Pharmaceutical and medicine manufacturing (1.5% of workforce, 6.6 times the national share)
[in-text-ad]

14. Minneapolis-St. Paul-Bloomington, MN-WI
> High-tech sector employment: 12.8% of workforce (230,908 jobs)
> Avg. annual high-tech pay: $131,741 (1.9 times above metro area avg.)
> Adults with bachelor’s degree or higher: 42.7%
> Most concentrated high-tech field: Electronic instrument manufacturing (1.4% of workforce, 4.5 times the national share)
[recirclink id=1055049]

13. Austin-Round Rock, TX
> High-tech sector employment: 13.2% of workforce (135,610 jobs)
> Avg. annual high-tech pay: $156,335 (2.2 times above metro area avg.)
> Adults with bachelor’s degree or higher: 46.0%
> Most concentrated high-tech field: Semiconductor and electronic component manufacturing (1.3% of workforce, 5.1 times the national share)
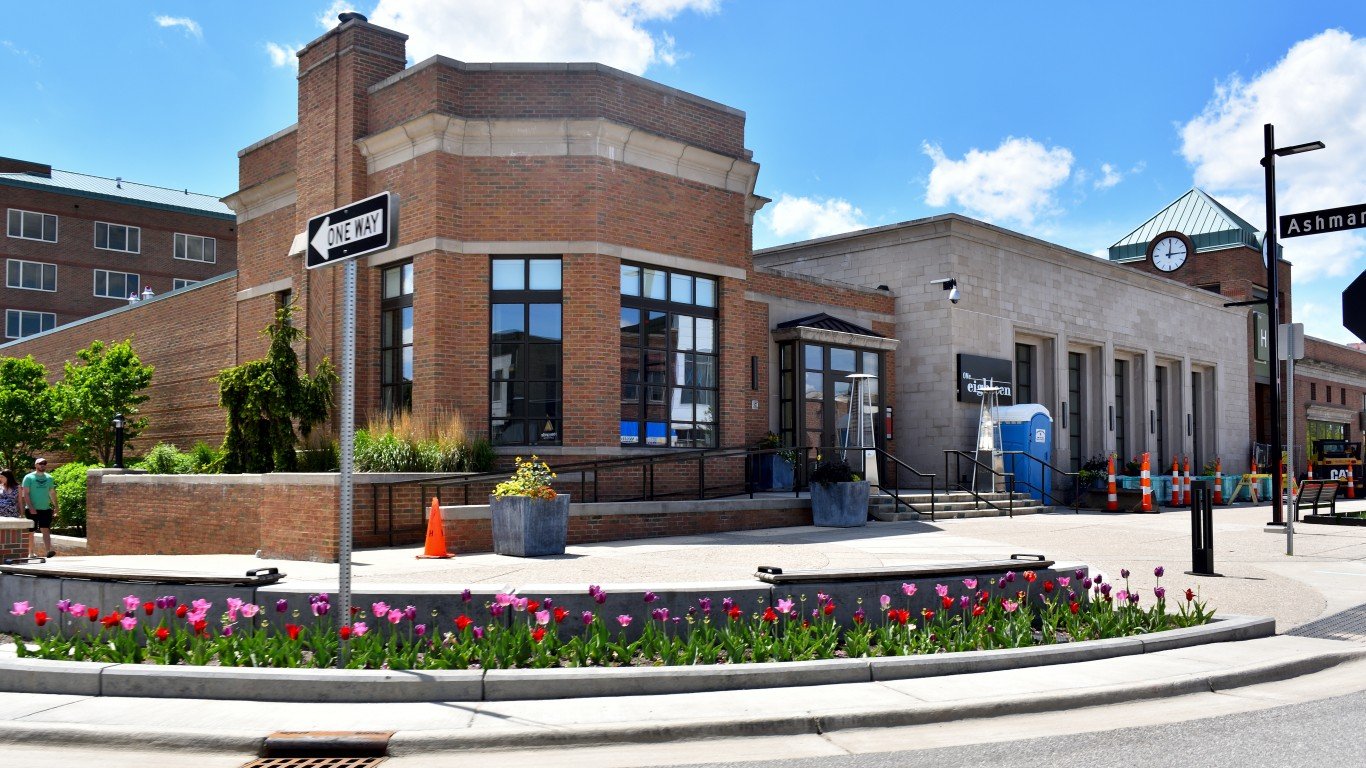
12. Midland, MI
> High-tech sector employment: 13.3% of workforce (4,470 jobs)
> Avg. annual high-tech pay: $1,259,761 (18.9 times above metro area avg.)
> Adults with bachelor’s degree or higher: 34.8%
> Most concentrated high-tech field: Management of companies and enterprises (11.3% of workforce, 6.8 times the national share)
[in-text-ad-2]

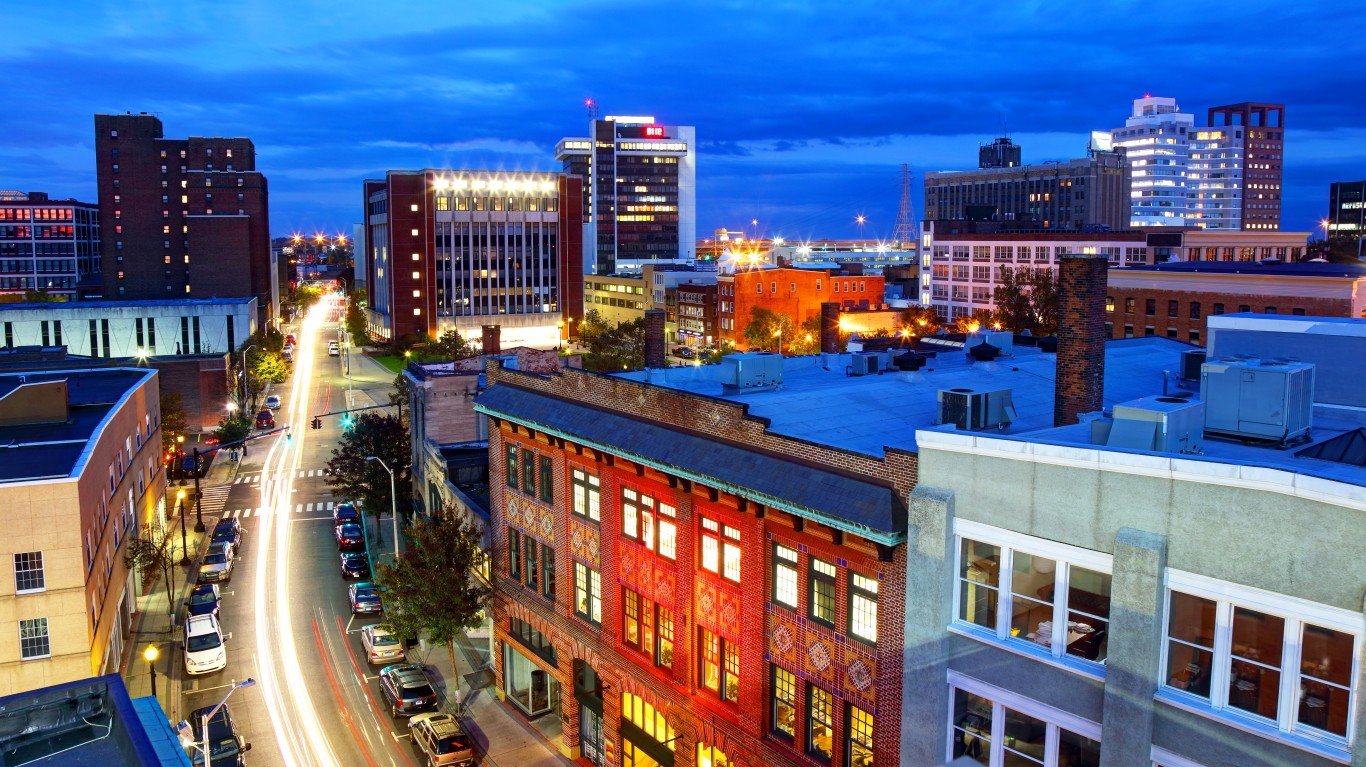
11. Manchester-Nashua, NH
> High-tech sector employment: 13.3% of workforce (25,704 jobs)
> Avg. annual high-tech pay: $151,926 (2.2 times above metro area avg.)
> Adults with bachelor’s degree or higher: 38.6%
> Most concentrated high-tech field: Electronic instrument manufacturing (4.0% of workforce, 13.5 times the national share)

10. Denver-Aurora-Lakewood, CO
> High-tech sector employment: 14.1% of workforce (203,903 jobs)
> Avg. annual high-tech pay: $141,713 (1.9 times above metro area avg.)
> Adults with bachelor’s degree or higher: 44.7%
> Most concentrated high-tech field: Wired telecommunications carriers (1.1% of workforce, 3.2 times the national share)
[in-text-ad]

9. San Diego-Carlsbad, CA
> High-tech sector employment: 14.8% of workforce (202,472 jobs)
> Avg. annual high-tech pay: $136,494 (1.9 times above metro area avg.)
> Adults with bachelor’s degree or higher: 39.5%
> Most concentrated high-tech field: Scientific research and development services (2.6% of workforce, 4.8 times the national share)
[recirclink id=1107968]

8. Boston-Cambridge-Newton, MA-NH
> High-tech sector employment: 14.8% of workforce (368,862 jobs)
> Avg. annual high-tech pay: $177,997 (2.0 times above metro area avg.)
> Adults with bachelor’s degree or higher: 48.9%
> Most concentrated high-tech field: Scientific research and development services (3.1% of workforce, 5.6 times the national share)

7. Palm Bay-Melbourne-Titusville, FL
> High-tech sector employment: 16.4% of workforce (35,365 jobs)
> Avg. annual high-tech pay: $106,139 (1.9 times above metro area avg.)
> Adults with bachelor’s degree or higher: 30.9%
> Most concentrated high-tech field: Semiconductor and electronic component manufacturing (4.0% of workforce, 15.3 times the national share)
[in-text-ad-2]

6. Seattle-Tacoma-Bellevue, WA
> High-tech sector employment: 17.1% of workforce (329,412 jobs)
> Avg. annual high-tech pay: $381,524 (4.1 times above metro area avg.)
> Adults with bachelor’s degree or higher: 43.6%
> Most concentrated high-tech field: Aerospace product and parts manufacturing (4.0% of workforce, 10.9 times the national share)

5. Huntsville, AL
> High-tech sector employment: 17.6% of workforce (39,811 jobs)
> Avg. annual high-tech pay: $190,484 (2.9 times above metro area avg.)
> Adults with bachelor’s degree or higher: 39.8%
> Most concentrated high-tech field: Architectural and engineering services (7.0% of workforce, 6.5 times the national share)
[in-text-ad]

4. San Francisco-Oakland-Hayward, CA
> High-tech sector employment: 19.7% of workforce (441,604 jobs)
> Avg. annual high-tech pay: $229,896 (1.9 times above metro area avg.)
> Adults with bachelor’s degree or higher: 50.7%
> Most concentrated high-tech field: Other information services (2.3% of workforce, 9.0 times the national share)
[recirclink id=1029855]
3. California-Lexington Park, MD
> High-tech sector employment: 22.5% of workforce (10,241 jobs)
> Avg. annual high-tech pay: $233,720 (3.1 times above metro area avg.)
> Adults with bachelor’s degree or higher: 32.0%
> Most concentrated high-tech field: Architectural and engineering services (12.8% of workforce, 11.9 times the national share)
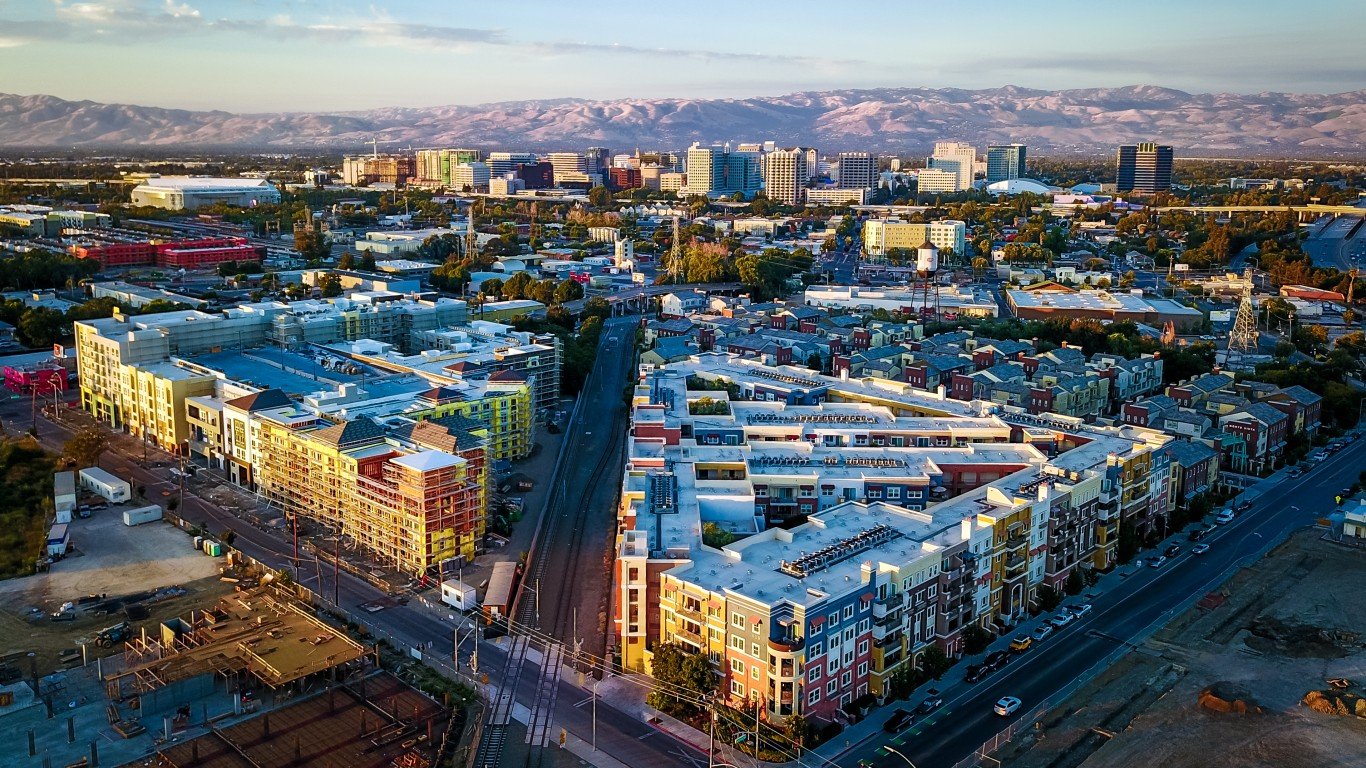
2. San Jose-Sunnyvale-Santa Clara, CA
> High-tech sector employment: 22.8% of workforce (243,457 jobs)
> Avg. annual high-tech pay: $416,830 (2.6 times above metro area avg.)
> Adults with bachelor’s degree or higher: 52.5%
> Most concentrated high-tech field: Computer and peripheral equipment manufacturing (5.3% of workforce, 46.5 times the national share)
[in-text-ad-2]

1. Boulder, CO
> High-tech sector employment: 25.0% of workforce (44,690 jobs)
> Avg. annual high-tech pay: $146,158 (1.9 times above metro area avg.)
> Adults with bachelor’s degree or higher: 63.0%
> Most concentrated high-tech field: Electronic instrument manufacturing (3.6% of workforce, 12.1 times the national share)
Methodology
To determine the cities with the most high-tech jobs, 24/7 Wall St. reviewed employment data by detailed industry for 2020 from the Bureau of Labor Statistics Quarterly Census of Employment and Wages. Metropolitan statistical areas were ranked based on employment in industries defined as “high-tech” by the BLS as a percentage of total employment. The BLS identified high-tech industries in a March 2018 publication titled “High-tech industries: an analysis of employment, wages, and output” as those with a concentration of STEM (science, technology, engineering, and mathematics) occupations at least 2.5 times greater than their average concentration nationwide in goods-producing and service-providing industries.
Data on average annual pay by detailed industry also came from the BLS QCEW. Supplemental data on the percentage of adults 25 years and older with a bachelor’s degree or higher came from the U.S. Census Bureau’s American Community Survey and are five-year estimates for 2020.
High-tech industries include: oil and gas extraction; electric power generation, transmission and distribution; basic chemical manufacturing; pharmaceutical and medicine manufacturing; industrial machinery manufacturing; commercial and service industry machinery manufacturing, including digital camera manufacturing; computer and peripheral equipment manufacturing, excluding digital camera manufacturing; communications equipment manufacturing; audio and video equipment manufacturing; semiconductor and other electronic component manufacturing; navigational, measuring, electromedical, and control instruments manufacturing; manufacturing and reproducing magnetic and optical media; electrical equipment manufacturing; aerospace product and parts manufacturing; pipeline transportation; software publishers; wired telecommunications carriers; wireless telecommunications carriers (except satellite); satellite, telecommunications resellers, and all other telecommunications; other telecommunications; data processing, hosting, and related services; other information services; architectural, engineering, and related services; computer systems design and related services; management, scientific, and technical consulting services; scientific research and development services; and management of companies and enterprises.
The industry listed as the most concentrated high-tech field is the high-tech industry with the highest location quotient — the share of employment within an industry relative to the national share of employment in that industry. Only industries that constitute at least 1% of the local workforce were considered.
Contact [email protected] for any questions or corrections.