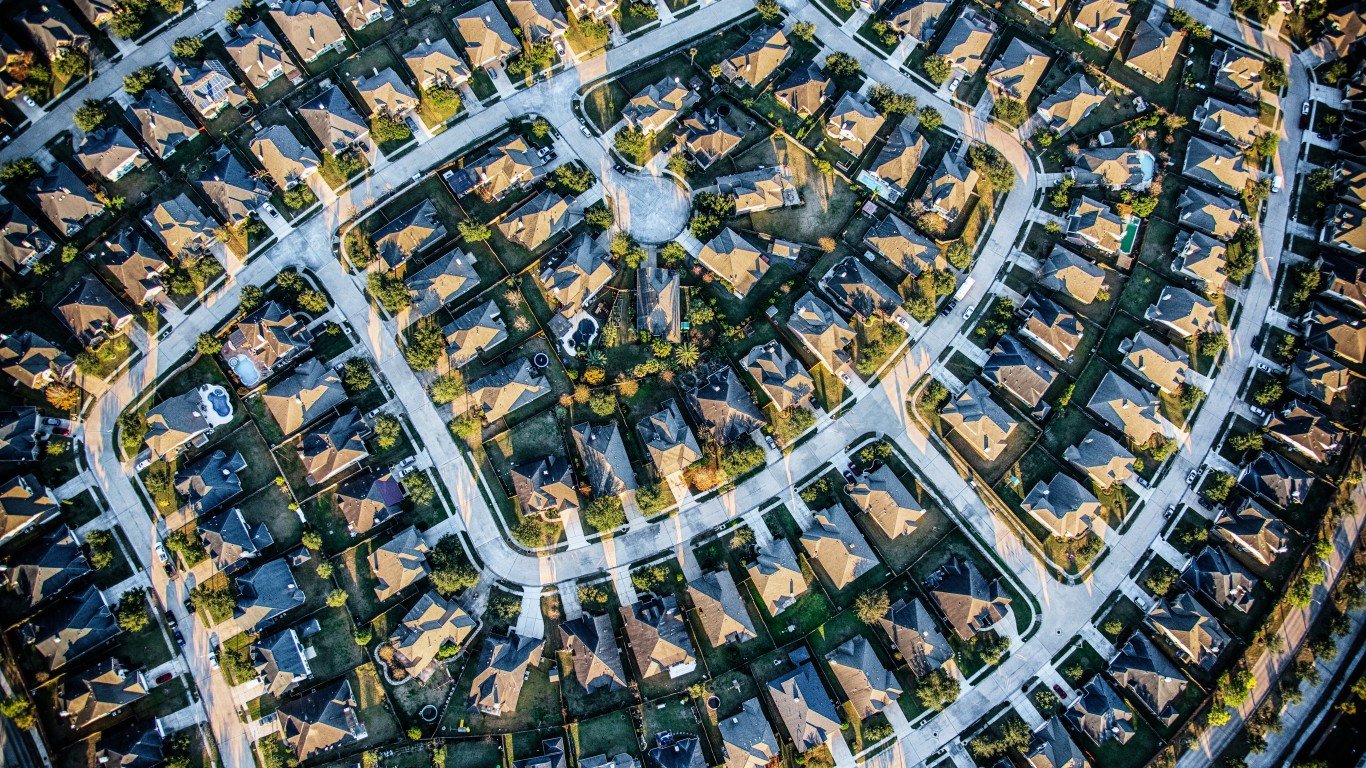
The American housing market took off during the early months of the COVID-19 pandemic. The homeownership rate – or the share of housing units occupied by their owner – jumped by 2.6 percentage points from the first quarter to the second quarter of 2020, by far the largest increase ever recorded. By the end of 2020, there were 2.1 million more homeowners in the United States than there were a year earlier.
The surge in home sales was fueled by several factors, including historically low mortgage rates, and, as some experts speculate, the pandemic, which led many Americans to re-evaluate where and how they live. Here is a look at the mortgage rate in America every year since 1972.
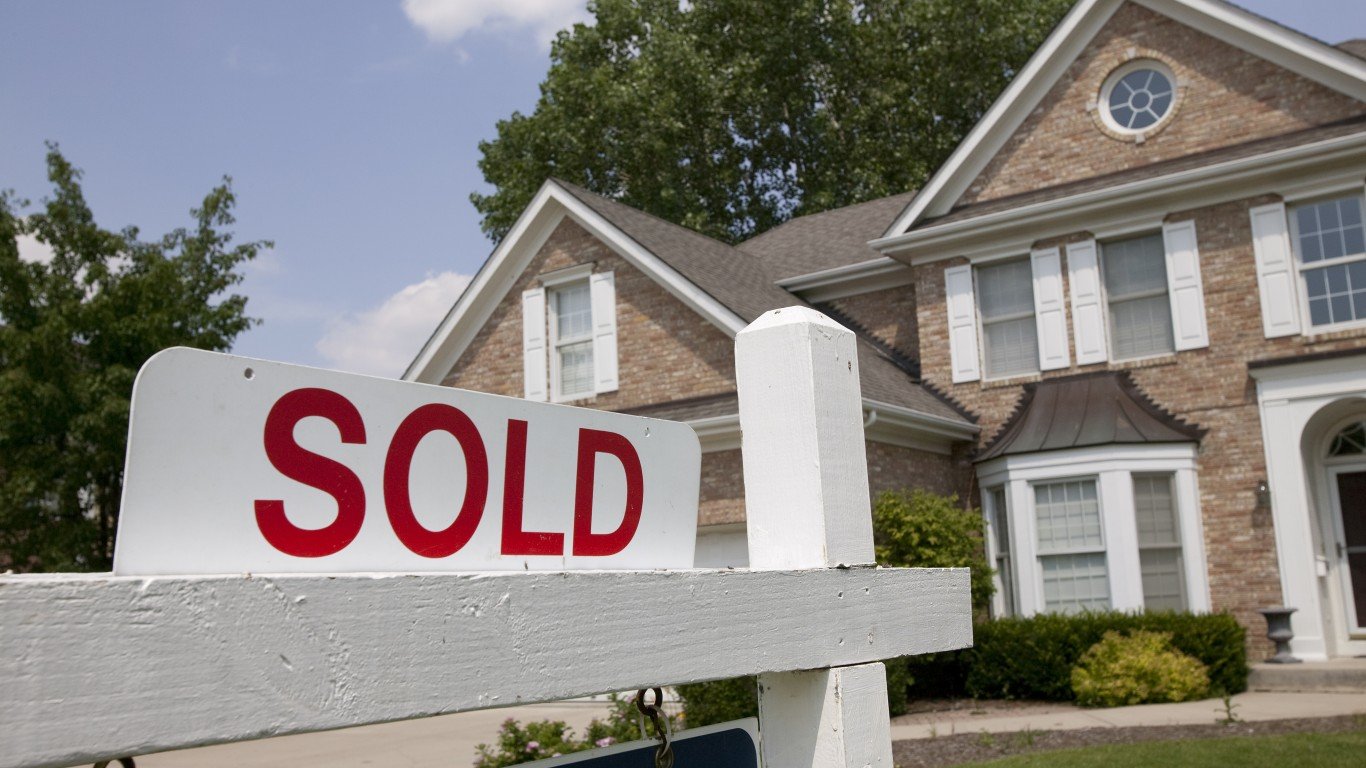
Nationwide, the homeownership rate stands at 64.4%, according to the latest American Community Survey data from the U.S. Census Bureau. This rate varies substantially across the country, however, from state to state, and city to city.
Using census data, 24/7 Wall St. identified the metro area in every state with the lowest homeownership rate. Metro areas are ranked by the share of housing units occupied by their owners.
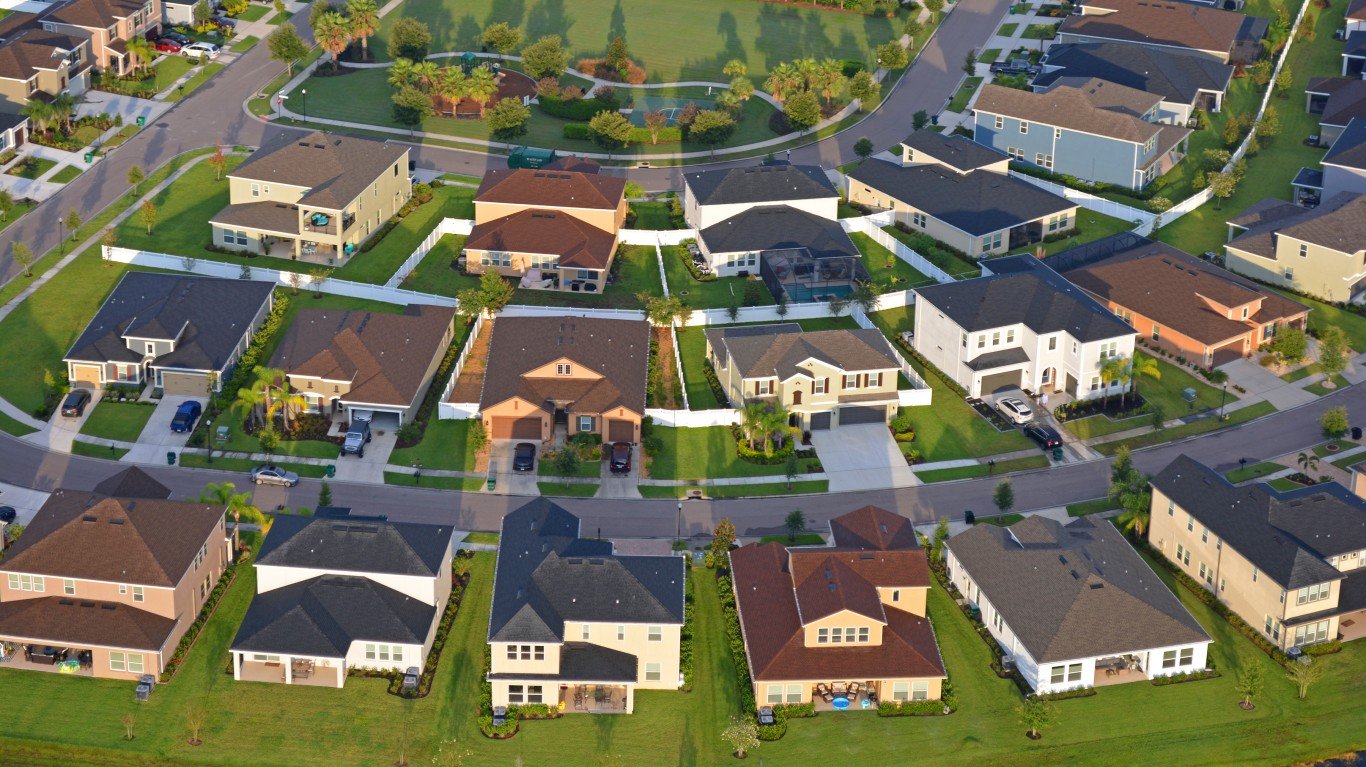
It is important to note that four states – Delaware, New Hampshire, Rhode Island, and Vermont – each have only one metro area, and it ranks as having the lowest homeownership rate by default only. Among the places on this list, homeownership rates range from 48.7% to 70.6% and are lower than the state homeownership rate in nearly every case.
Homeownership can be expensive, and in most of the metro areas on this list, the typical household earns less than the median household income across the state as a whole. These area’s low incomes may make homeownership less affordable for larger shares of the population. Here is a look at the 20 cities where the middle class can no longer afford housing.
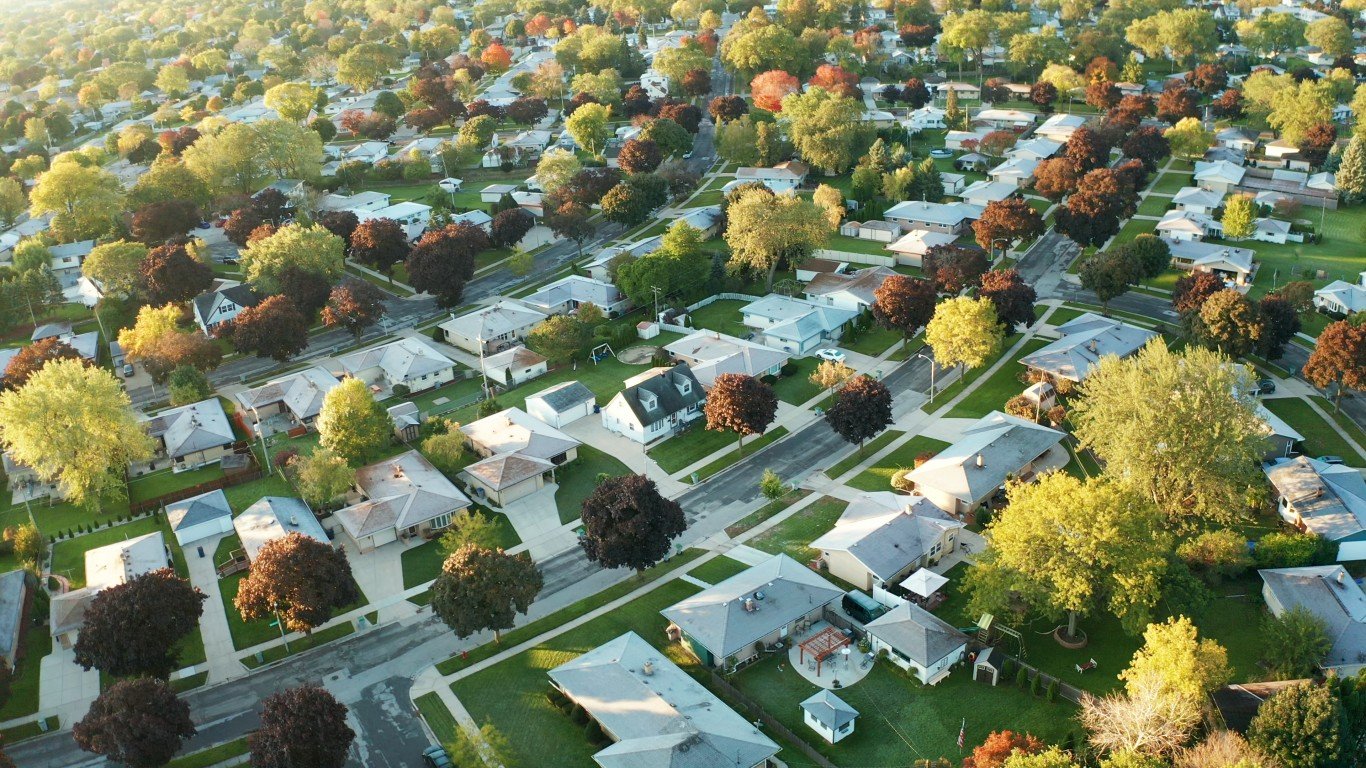
Many of the metro areas on this list are home to large colleges or universities. Because a significant share of the population in college towns reside there temporarily, the transient population are more likely to rent a home than buy one. These places include New Haven, Connecticut, home to Yale University; Ann Arbor, Michigan, home to the University of Michigan; and Ames, Iowa, home to Iowa State University.
Click here to see the metro area with the lowest homeownership rate in each state
Click here to read our detailed methodology

Alabama: Auburn-Opelika
> Homeownership rate: 63.4% (Alabama: 69.2%)
> Median home value: $173,700 (Alabama: $149,600)
> Median monthly housing costs (w/ a mortgage): $1,289 (Alabama: $1,196)
> Median monthly housing costs (no mortgage): $379 (Alabama: $367)
> Median household income: $52,930 (Alabama: $52,035)
> No. of metros considered in ranking: 12
[in-text-ad]

Alaska: Fairbanks
> Homeownership rate: 58.9% (Alaska: 64.8%)
> Median home value: $240,300 (Alaska: $275,600)
> Median monthly housing costs (w/ a mortgage): $1,824 (Alaska: $1,937)
> Median monthly housing costs (no mortgage): $620 (Alaska: $591)
> Median household income: $76,464 (Alaska: $77,790)
> No. of metros considered in ranking: 2
[recirclink id=1081420]

Arizona: Flagstaff
> Homeownership rate: 60.8% (Arizona: 65.3%)
> Median home value: $299,100 (Arizona: $242,000)
> Median monthly housing costs (w/ a mortgage): $1,636 (Arizona: $1,464)
> Median monthly housing costs (no mortgage): $377 (Arizona: $430)
> Median household income: $59,000 (Arizona: $61,529)
> No. of metros considered in ranking: 7

Arkansas: Jonesboro
> Homeownership rate: 58.1% (Arkansas: 65.8%)
> Median home value: $136,000 (Arkansas: $133,600)
> Median monthly housing costs (w/ a mortgage): $1,052 (Arkansas: $1,103)
> Median monthly housing costs (no mortgage): $345 (Arkansas: $353)
> Median household income: $47,610 (Arkansas: $49,475)
> No. of metros considered in ranking: 6
[in-text-ad-2]
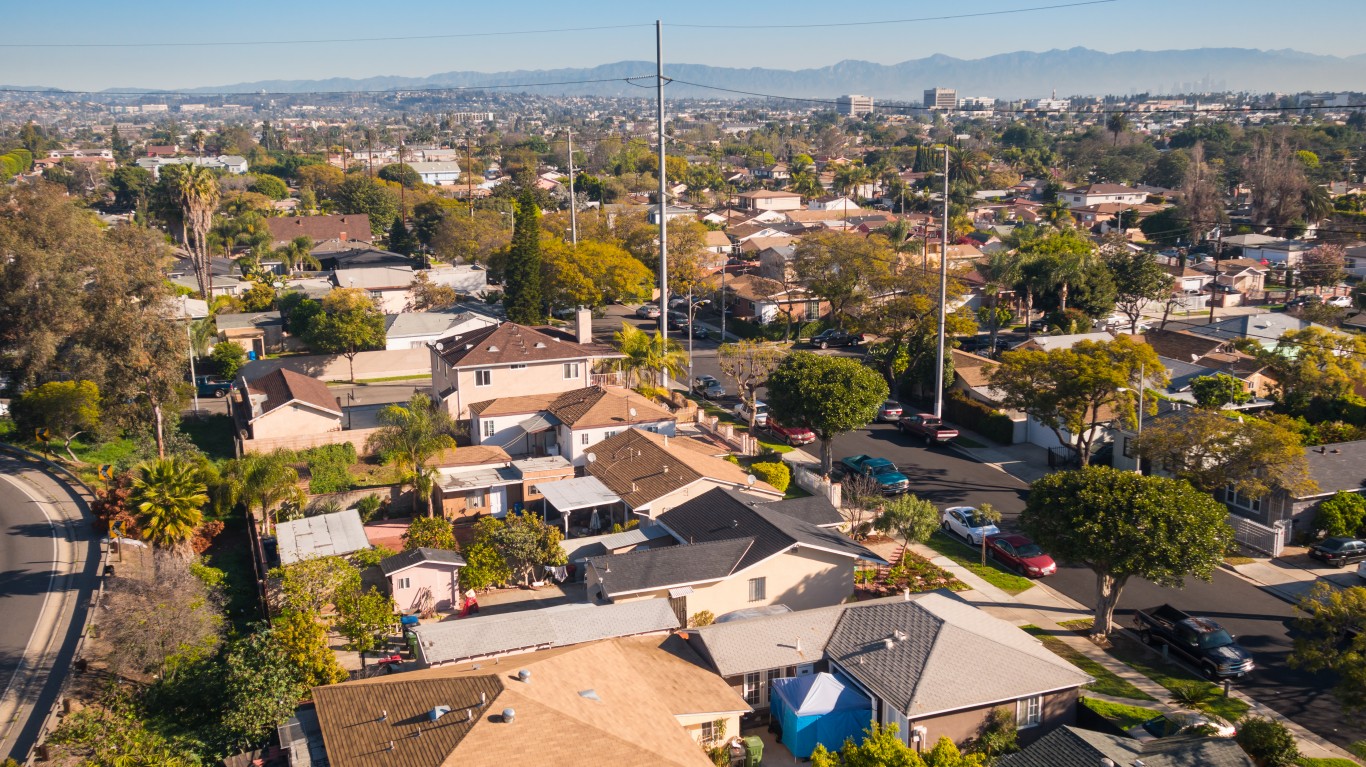
California: Los Angeles-Long Beach-Anaheim
> Homeownership rate: 48.7% (California: 55.3%)
> Median home value: $641,300 (California: $538,500)
> Median monthly housing costs (w/ a mortgage): $2,658 (California: $2,422)
> Median monthly housing costs (no mortgage): $648 (California: $618)
> Median household income: $76,399 (California: $78,672)
> No. of metros considered in ranking: 26

Colorado: Boulder
> Homeownership rate: 63.6% (Colorado: 66.2%)
> Median home value: $539,100 (Colorado: $369,900)
> Median monthly housing costs (w/ a mortgage): $2,137 (Colorado: $1,808)
> Median monthly housing costs (no mortgage): $610 (Colorado: $488)
> Median household income: $87,476 (Colorado: $75,231)
> No. of metros considered in ranking: 7
[in-text-ad]

Connecticut: New Haven-Milford
> Homeownership rate: 62.1% (Connecticut: 66.1%)
> Median home value: $252,300 (Connecticut: $279,700)
> Median monthly housing costs (w/ a mortgage): $2,039 (Connecticut: $2,127)
> Median monthly housing costs (no mortgage): $897 (Connecticut: $900)
> Median household income: $71,370 (Connecticut: $79,855)
> No. of metros considered in ranking: 4
[recirclink id=1082534]

Delaware: Dover
> Homeownership rate: 68.8% (Delaware: 71.4%)
> Median home value: $226,600 (Delaware: $258,300)
> Median monthly housing costs (w/ a mortgage): $1,479 (Delaware: $1,591)
> Median monthly housing costs (no mortgage): $420 (Delaware: $475)
> Median household income: $60,117 (Delaware: $69,110)
> No. of metros considered in ranking: 1
*Because Dover is the only eligible metro in Delaware, it is the metro with the lowest homeownership rate by default.

Florida: Tallahassee
> Homeownership rate: 58.2% (Florida: 66.2%)
> Median home value: $187,400 (Florida: $232,000)
> Median monthly housing costs (w/ a mortgage): $1,372 (Florida: $1,539)
> Median monthly housing costs (no mortgage): $418 (Florida: $513)
> Median household income: $53,423 (Florida: $57,703)
> No. of metros considered in ranking: 22
[in-text-ad-2]

Georgia: Hinesville
> Homeownership rate: 49.3% (Georgia: 64.0%)
> Median home value: $133,000 (Georgia: $190,200)
> Median monthly housing costs (w/ a mortgage): $1,204 (Georgia: $1,449)
> Median monthly housing costs (no mortgage): $404 (Georgia: $435)
> Median household income: $50,588 (Georgia: $61,224)
> No. of metros considered in ranking: 14

Hawaii: Urban Honolulu
> Homeownership rate: 57.5% (Hawaii: 60.3%)
> Median home value: $702,300 (Hawaii: $636,400)
> Median monthly housing costs (w/ a mortgage): $2,641 (Hawaii: $2,443)
> Median monthly housing costs (no mortgage): $614 (Hawaii: $540)
> Median household income: $87,722 (Hawaii: $83,173)
> No. of metros considered in ranking: 2
[in-text-ad]

Idaho: Pocatello
> Homeownership rate: 68.3% (Idaho: 70.8%)
> Median home value: $165,800 (Idaho: $235,600)
> Median monthly housing costs (w/ a mortgage): $1,139 (Idaho: $1,312)
> Median monthly housing costs (no mortgage): $384 (Idaho: $388)
> Median household income: $51,914 (Idaho: $58,915)
> No. of metros considered in ranking: 6
[recirclink id=1083492]

Illinois: Champaign-Urbana
> Homeownership rate: 55.3% (Illinois: 66.3%)
> Median home value: $163,900 (Illinois: $202,100)
> Median monthly housing costs (w/ a mortgage): $1,396 (Illinois: $1,709)
> Median monthly housing costs (no mortgage): $575 (Illinois: $650)
> Median household income: $54,897 (Illinois: $68,428)
> No. of metros considered in ranking: 10

Indiana: Bloomington
> Homeownership rate: 58.3% (Indiana: 69.5%)
> Median home value: $177,700 (Indiana: $148,900)
> Median monthly housing costs (w/ a mortgage): $1,198 (Indiana: $1,155)
> Median monthly housing costs (no mortgage): $453 (Indiana: $416)
> Median household income: $52,226 (Indiana: $58,235)
> No. of metros considered in ranking: 12
[in-text-ad-2]

Iowa: Ames
> Homeownership rate: 59.7% (Iowa: 71.2%)
> Median home value: $179,700 (Iowa: $153,900)
> Median monthly housing costs (w/ a mortgage): $1,403 (Iowa: $1,279)
> Median monthly housing costs (no mortgage): $577 (Iowa: $495)
> Median household income: $60,442 (Iowa: $61,836)
> No. of metros considered in ranking: 8

Kansas: Manhattan
> Homeownership rate: 49.1% (Kansas: 66.2%)
> Median home value: $180,500 (Kansas: $157,600)
> Median monthly housing costs (w/ a mortgage): $1,519 (Kansas: $1,400)
> Median monthly housing costs (no mortgage): $563 (Kansas: $517)
> Median household income: $54,488 (Kansas: $61,091)
> No. of metros considered in ranking: 4
[in-text-ad]

Kentucky: Lexington-Fayette
> Homeownership rate: 59.8% (Kentucky: 67.6%)
> Median home value: $193,700 (Kentucky: $147,100)
> Median monthly housing costs (w/ a mortgage): $1,320 (Kentucky: $1,191)
> Median monthly housing costs (no mortgage): $463 (Kentucky: $379)
> Median household income: $60,769 (Kentucky: $52,238)
> No. of metros considered in ranking: 5
[recirclink id=1090849]

Louisiana: Shreveport-Bossier City
> Homeownership rate: 62.9% (Louisiana: 66.6%)
> Median home value: $156,900 (Louisiana: $168,100)
> Median monthly housing costs (w/ a mortgage): $1,234 (Louisiana: $1,310)
> Median monthly housing costs (no mortgage): $350 (Louisiana: $344)
> Median household income: $46,610 (Louisiana: $50,800)
> No. of metros considered in ranking: 9

Maine: Lewiston-Auburn
> Homeownership rate: 64.9% (Maine: 72.9%)
> Median home value: $166,600 (Maine: $198,000)
> Median monthly housing costs (w/ a mortgage): $1,356 (Maine: $1,404)
> Median monthly housing costs (no mortgage): $546 (Maine: $500)
> Median household income: $55,002 (Maine: $59,489)
> No. of metros considered in ranking: 3
[in-text-ad-2]

Maryland: Baltimore-Columbia-Towson
> Homeownership rate: 66.6% (Maryland: 67.1%)
> Median home value: $307,200 (Maryland: $325,400)
> Median monthly housing costs (w/ a mortgage): $1,954 (Maryland: $2,038)
> Median monthly housing costs (no mortgage): $619 (Maryland: $633)
> Median household income: $83,811 (Maryland: $87,063)
> No. of metros considered in ranking: 5

Massachusetts: Boston-Cambridge-Newton
> Homeownership rate: 61.7% (Massachusetts: 62.5%)
> Median home value: $461,500 (Massachusetts: $398,800)
> Median monthly housing costs (w/ a mortgage): $2,472 (Massachusetts: $2,268)
> Median monthly housing costs (no mortgage): $923 (Massachusetts: $829)
> Median household income: $93,537 (Massachusetts: $84,385)
> No. of metros considered in ranking: 5
[in-text-ad]

Michigan: Ann Arbor
> Homeownership rate: 61.5% (Michigan: 71.7%)
> Median home value: $278,500 (Michigan: $162,600)
> Median monthly housing costs (w/ a mortgage): $1,807 (Michigan: $1,312)
> Median monthly housing costs (no mortgage): $719 (Michigan: $495)
> Median household income: $75,730 (Michigan: $59,234)
> No. of metros considered in ranking: 14
[recirclink id=1090988]

Minnesota: Mankato
> Homeownership rate: 65.3% (Minnesota: 71.9%)
> Median home value: $198,100 (Minnesota: $235,700)
> Median monthly housing costs (w/ a mortgage): $1,415 (Minnesota: $1,606)
> Median monthly housing costs (no mortgage): $525 (Minnesota: $548)
> Median household income: $63,288 (Minnesota: $73,382)
> No. of metros considered in ranking: 5

Mississippi: Hattiesburg
> Homeownership rate: 65.1% (Mississippi: 68.8%)
> Median home value: $135,600 (Mississippi: $125,500)
> Median monthly housing costs (w/ a mortgage): $1,202 (Mississippi: $1,161)
> Median monthly housing costs (no mortgage): $353 (Mississippi: $358)
> Median household income: $48,231 (Mississippi: $46,511)
> No. of metros considered in ranking: 3
[in-text-ad-2]

Missouri: Columbia
> Homeownership rate: 58.4% (Missouri: 67.1%)
> Median home value: $189,900 (Missouri: $163,600)
> Median monthly housing costs (w/ a mortgage): $1,364 (Missouri: $1,287)
> Median monthly housing costs (no mortgage): $475 (Missouri: $449)
> Median household income: $57,980 (Missouri: $57,290)
> No. of metros considered in ranking: 8

Montana: Missoula
> Homeownership rate: 58.6% (Montana: 68.5%)
> Median home value: $302,200 (Montana: $244,900)
> Median monthly housing costs (w/ a mortgage): $1,626 (Montana: $1,456)
> Median monthly housing costs (no mortgage): $520 (Montana: $451)
> Median household income: $56,247 (Montana: $56,539)
> No. of metros considered in ranking: 3
[in-text-ad]

Nebraska: Lincoln
> Homeownership rate: 59.8% (Nebraska: 66.2%)
> Median home value: $188,700 (Nebraska: $164,000)
> Median monthly housing costs (w/ a mortgage): $1,433 (Nebraska: $1,412)
> Median monthly housing costs (no mortgage): $574 (Nebraska: $539)
> Median household income: $62,883 (Nebraska: $63,015)
> No. of metros considered in ranking: 3
[recirclink id=1081420]

Nevada: Las Vegas-Henderson-Paradise
> Homeownership rate: 54.8% (Nevada: 57.1%)
> Median home value: $285,100 (Nevada: $290,200)
> Median monthly housing costs (w/ a mortgage): $1,567 (Nevada: $1,574)
> Median monthly housing costs (no mortgage): $438 (Nevada: $433)
> Median household income: $61,048 (Nevada: $62,043)
> No. of metros considered in ranking: 3

New Hampshire: Manchester-Nashua
> Homeownership rate: 65.7% (New Hampshire: 71.2%)
> Median home value: $287,900 (New Hampshire: $272,300)
> Median monthly housing costs (w/ a mortgage): $2,073 (New Hampshire: $1,967)
> Median monthly housing costs (no mortgage): $872 (New Hampshire: $812)
> Median household income: $82,099 (New Hampshire: $77,923)
> No. of metros considered in ranking: 1
*Because Manchester-Nashua is the only eligible metro in New Hampshire, it is the metro with the lowest homeownership rate by default.
[in-text-ad-2]

New Jersey: Trenton-Princeton
> Homeownership rate: 63.5% (New Jersey: 64.0%)
> Median home value: $290,100 (New Jersey: $343,500)
> Median monthly housing costs (w/ a mortgage): $2,311 (New Jersey: $2,476)
> Median monthly housing costs (no mortgage): $998 (New Jersey: $1,062)
> Median household income: $83,306 (New Jersey: $85,245)
> No. of metros considered in ranking: 4

New Mexico: Las Cruces
> Homeownership rate: 64.6% (New Mexico: 68.0%)
> Median home value: $153,600 (New Mexico: $175,700)
> Median monthly housing costs (w/ a mortgage): $1,190 (New Mexico: $1,293)
> Median monthly housing costs (no mortgage): $335 (New Mexico: $360)
> Median household income: $44,024 (New Mexico: $51,243)
> No. of metros considered in ranking: 4
[in-text-ad]

New York: New York-Newark-Jersey City
> Homeownership rate: 51.6% (New York: 54.1%)
> Median home value: $465,400 (New York: $325,000)
> Median monthly housing costs (w/ a mortgage): $2,825 (New York: $2,174)
> Median monthly housing costs (no mortgage): $1,115 (New York: $781)
> Median household income: $81,951 (New York: $71,117)
> No. of metros considered in ranking: 13
[recirclink id=1082534]

North Carolina: Greenville
> Homeownership rate: 52.6% (North Carolina: 65.7%)
> Median home value: $146,700 (North Carolina: $182,100)
> Median monthly housing costs (w/ a mortgage): $1,279 (North Carolina: $1,328)
> Median monthly housing costs (no mortgage): $448 (North Carolina: $402)
> Median household income: $49,337 (North Carolina: $56,642)
> No. of metros considered in ranking: 15

North Dakota: Grand Forks
> Homeownership rate: 55.2% (North Dakota: 62.5%)
> Median home value: $195,500 (North Dakota: $199,900)
> Median monthly housing costs (w/ a mortgage): $1,426 (North Dakota: $1,457)
> Median monthly housing costs (no mortgage): $506 (North Dakota: $476)
> Median household income: $55,122 (North Dakota: $65,315)
> No. of metros considered in ranking: 3
[in-text-ad-2]

Ohio: Columbus
> Homeownership rate: 61.8% (Ohio: 66.3%)
> Median home value: $195,900 (Ohio: $151,400)
> Median monthly housing costs (w/ a mortgage): $1,512 (Ohio: $1,286)
> Median monthly housing costs (no mortgage): $570 (Ohio: $480)
> Median household income: $66,715 (Ohio: $58,116)
> No. of metros considered in ranking: 11

Oklahoma: Lawton
> Homeownership rate: 54.4% (Oklahoma: 66.1%)
> Median home value: $121,500 (Oklahoma: $142,400)
> Median monthly housing costs (w/ a mortgage): $1,165 (Oklahoma: $1,246)
> Median monthly housing costs (no mortgage): $386 (Oklahoma: $406)
> Median household income: $52,219 (Oklahoma: $53,840)
> No. of metros considered in ranking: 4
[in-text-ad]

Oregon: Corvallis
> Homeownership rate: 56.8% (Oregon: 62.8%)
> Median home value: $357,900 (Oregon: $336,700)
> Median monthly housing costs (w/ a mortgage): $1,776 (Oregon: $1,741)
> Median monthly housing costs (no mortgage): $594 (Oregon: $553)
> Median household income: $65,142 (Oregon: $65,667)
> No. of metros considered in ranking: 8
[recirclink id=1083492]

Pennsylvania: State College
> Homeownership rate: 62.5% (Pennsylvania: 69.0%)
> Median home value: $242,700 (Pennsylvania: $187,500)
> Median monthly housing costs (w/ a mortgage): $1,624 (Pennsylvania: $1,505)
> Median monthly housing costs (no mortgage): $535 (Pennsylvania: $542)
> Median household income: $61,921 (Pennsylvania: $63,627)
> No. of metros considered in ranking: 18

Rhode Island: Providence-Warwick
> Homeownership rate: 62.0% (Rhode Island: 61.6%)
> Median home value: $290,500 (Rhode Island: $276,600)
> Median monthly housing costs (w/ a mortgage): $1,915 (Rhode Island: $1,879)
> Median monthly housing costs (no mortgage): $731 (Rhode Island: $745)
> Median household income: $70,676 (Rhode Island: $70,305)
> No. of metros considered in ranking: 1
*Because Providence-Warwick is the only eligible metro in Rhode Island, it is the metro with the lowest homeownership rate by default.
[in-text-ad-2]

South Carolina: Charleston-North Charleston
> Homeownership rate: 66.8% (South Carolina: 70.1%)
> Median home value: $249,800 (South Carolina: $170,100)
> Median monthly housing costs (w/ a mortgage): $1,567 (South Carolina: $1,265)
> Median monthly housing costs (no mortgage): $472 (South Carolina: $377)
> Median household income: $65,894 (South Carolina: $54,864)
> No. of metros considered in ranking: 8

South Dakota: Sioux Falls
> Homeownership rate: 66.2% (South Dakota: 68.0%)
> Median home value: $208,400 (South Dakota: $174,600)
> Median monthly housing costs (w/ a mortgage): $1,442 (South Dakota: $1,367)
> Median monthly housing costs (no mortgage): $514 (South Dakota: $495)
> Median household income: $67,713 (South Dakota: $59,896)
> No. of metros considered in ranking: 2
[in-text-ad]

Tennessee: Clarksville
> Homeownership rate: 59.3% (Tennessee: 66.5%)
> Median home value: $165,100 (Tennessee: $177,600)
> Median monthly housing costs (w/ a mortgage): $1,242 (Tennessee: $1,272)
> Median monthly housing costs (no mortgage): $397 (Tennessee: $389)
> Median household income: $54,911 (Tennessee: $54,833)
> No. of metros considered in ranking: 10
[recirclink id=1090849]

Texas: College Station-Bryan
> Homeownership rate: 51.1% (Texas: 62.3%)
> Median home value: $201,900 (Texas: $187,200)
> Median monthly housing costs (w/ a mortgage): $1,624 (Texas: $1,654)
> Median monthly housing costs (no mortgage): $532 (Texas: $526)
> Median household income: $51,261 (Texas: $63,826)
> No. of metros considered in ranking: 25

Utah: Logan
> Homeownership rate: 64.7% (Utah: 70.5%)
> Median home value: $252,800 (Utah: $305,400)
> Median monthly housing costs (w/ a mortgage): $1,373 (Utah: $1,597)
> Median monthly housing costs (no mortgage): $398 (Utah: $437)
> Median household income: $60,466 (Utah: $74,197)
> No. of metros considered in ranking: 5
[in-text-ad-2]

Vermont: Burlington-South Burlington
> Homeownership rate: 66.8% (Vermont: 71.3%)
> Median home value: $285,200 (Vermont: $230,900)
> Median monthly housing costs (w/ a mortgage): $1,860 (Vermont: $1,630)
> Median monthly housing costs (no mortgage): $754 (Vermont: $686)
> Median household income: $73,447 (Vermont: $63,477)
> No. of metros considered in ranking: 1
*Because Burlington-South Burlington is the only eligible metro in Vermont, it is the metro with the lowest homeownership rate by default.

Virginia: Blacksburg-Christiansburg
> Homeownership rate: 60.3% (Virginia: 66.7%)
> Median home value: $189,300 (Virginia: $282,800)
> Median monthly housing costs (w/ a mortgage): $1,291 (Virginia: $1,822)
> Median monthly housing costs (no mortgage): $410 (Virginia: $481)
> Median household income: $55,475 (Virginia: $76,398)
> No. of metros considered in ranking: 9
[in-text-ad]

Washington: Seattle-Tacoma-Bellevue
> Homeownership rate: 60.2% (Washington: 63.3%)
> Median home value: $471,900 (Washington: $366,800)
> Median monthly housing costs (w/ a mortgage): $2,305 (Washington: $1,939)
> Median monthly housing costs (no mortgage): $765 (Washington: $605)
> Median household income: $90,790 (Washington: $77,006)
> No. of metros considered in ranking: 11
[recirclink id=1090988]

West Virginia: Morgantown
> Homeownership rate: 63.6% (West Virginia: 73.7%)
> Median home value: $181,600 (West Virginia: $123,200)
> Median monthly housing costs (w/ a mortgage): $1,237 (West Virginia: $1,058)
> Median monthly housing costs (no mortgage): $357 (West Virginia: $331)
> Median household income: $53,681 (West Virginia: $48,037)
> No. of metros considered in ranking: 7

Wisconsin: Milwaukee-Waukesha
> Homeownership rate: 59.8% (Wisconsin: 67.1%)
> Median home value: $223,700 (Wisconsin: $189,200)
> Median monthly housing costs (w/ a mortgage): $1,621 (Wisconsin: $1,436)
> Median monthly housing costs (no mortgage): $636 (Wisconsin: $556)
> Median household income: $63,739 (Wisconsin: $63,293)
> No. of metros considered in ranking: 12
[in-text-ad-2]

Wyoming: Casper
> Homeownership rate: 70.6% (Wyoming: 71.0%)
> Median home value: $215,400 (Wyoming: $228,000)
> Median monthly housing costs (w/ a mortgage): $1,416 (Wyoming: $1,474)
> Median monthly housing costs (no mortgage): $398 (Wyoming: $429)
> Median household income: $62,168 (Wyoming: $65,304)
> No. of metros considered in ranking: 2
Methodology
To determine the metro area with the lowest homeownership rate in every state, 24/7 Wall St. reviewed five-year estimates of the share of housing units that are occupied by their owners from the U.S. Census Bureau’s 2020 American Community Survey.
We used the 384 metropolitan statistical areas as delineated by the United States Office of Management and Budget and used by the Census Bureau as our definition of metros.
Metro areas were ranked based on the percentage of housing units that are occupied by their owners. To break ties, we used the number of housing units that are occupied by their owners.
Additional information on median home value, median housing costs with and without a mortgage, and median household income are also five-year estimates from the 2020 ACS. Because the Census Bureau didn’t release one-year estimates for 2020 due to data collection issues caused by the COVID-19 pandemic, all ACS data are five-year estimates.
Contact [email protected] for any questions or corrections.