
According to a study by the Federal Reserve of St. Louis, about 10,000 people will turn 65 each day for the next two decades. Among those who choose to retire at that age, some also choose to move — and many prefer certain locations that offer outdoor attractions and activities, a temperate climate, low-stress communities, and lower taxes. (Here is what it costs to retire comfortably in every state.)
To identify the counties where retirees are moving to, 24/7 Wall St. reviewed several measures from the U.S. Census Bureau’s Current Population Survey. Specifically, we considered counties with the largest increase in the 65 and older population from 2018 to 2020, while only including those counties where net migration was positive from 2018 to 2019 and 2019 to 2020 and where overall population growth from 2018 to 2020 was positive. Counties are ordered by the change in the 65 and over population from 2018 to 2020.
We also included for reference the change in the 65+ population from 2011 to 2020. Only counties with populations greater than 10,000 were considered. All data is from the CPS, and years begin on July 1 and end on June 30.
The population 65 and over in the counties on the list increased between 13.3% to 20.6% between 2018 and 2020 and by 59% to 128% from 2011 to 2020. Nationwide, the 65 and over population grew by 6.3% from 2018 to 2020 and by 32% from 2011 to 2020.
Based on the census data, all but two of the 25 counties where retirees might be moving to are in 11 states in the West and the South. Two counties are in states in the Midwest, and none are in the Northeast. While several of the counties are quite large by population, 10 have about 60,000 residents or fewer.
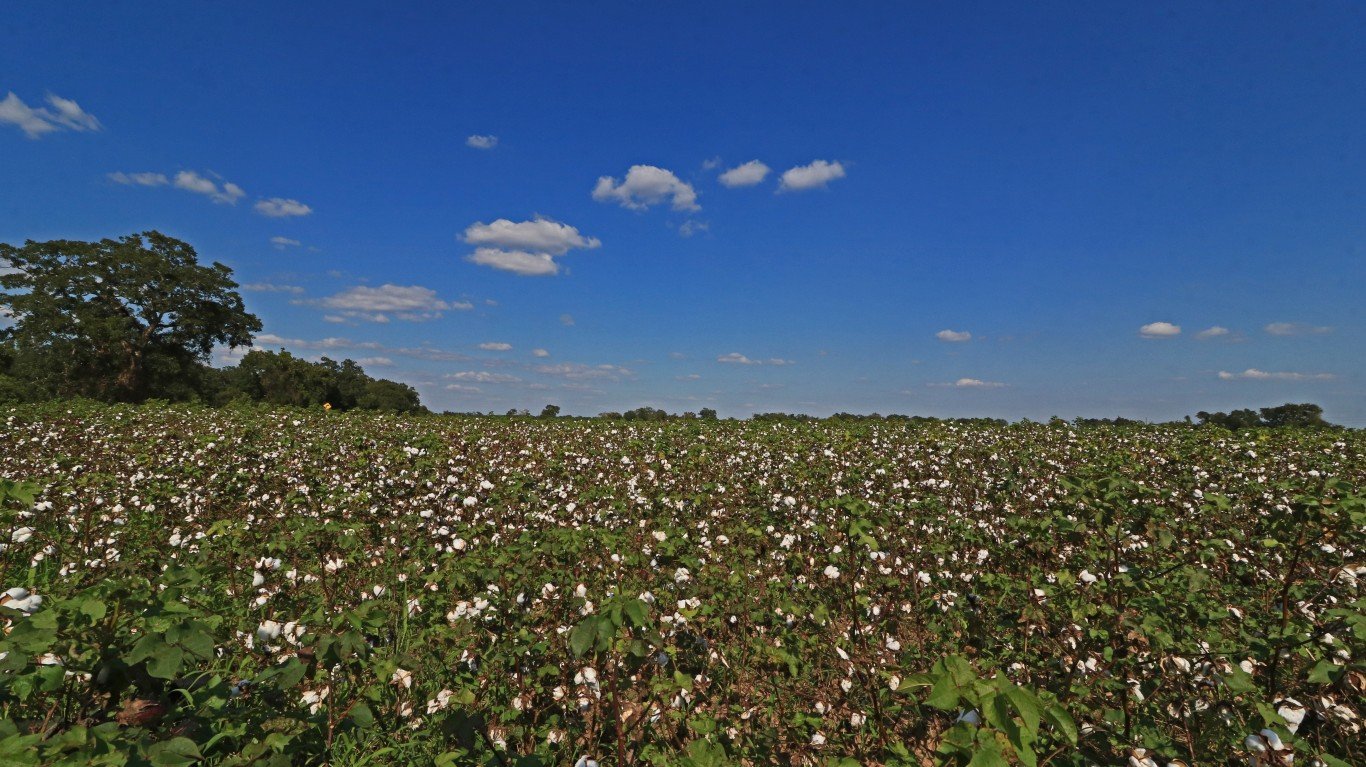
Texas has three counties in the top 10 and six overall, the most of any state. Included on the list are the more populous counties of Denton, Fort Bend, and Williamson, the three largest on the list by population. Retirees are likely drawn to Texas because of its lack of income tax, but also perhaps because of its numerous inland lakes, and amount of buildable land. (These are the states where people are paying the most taxes.)
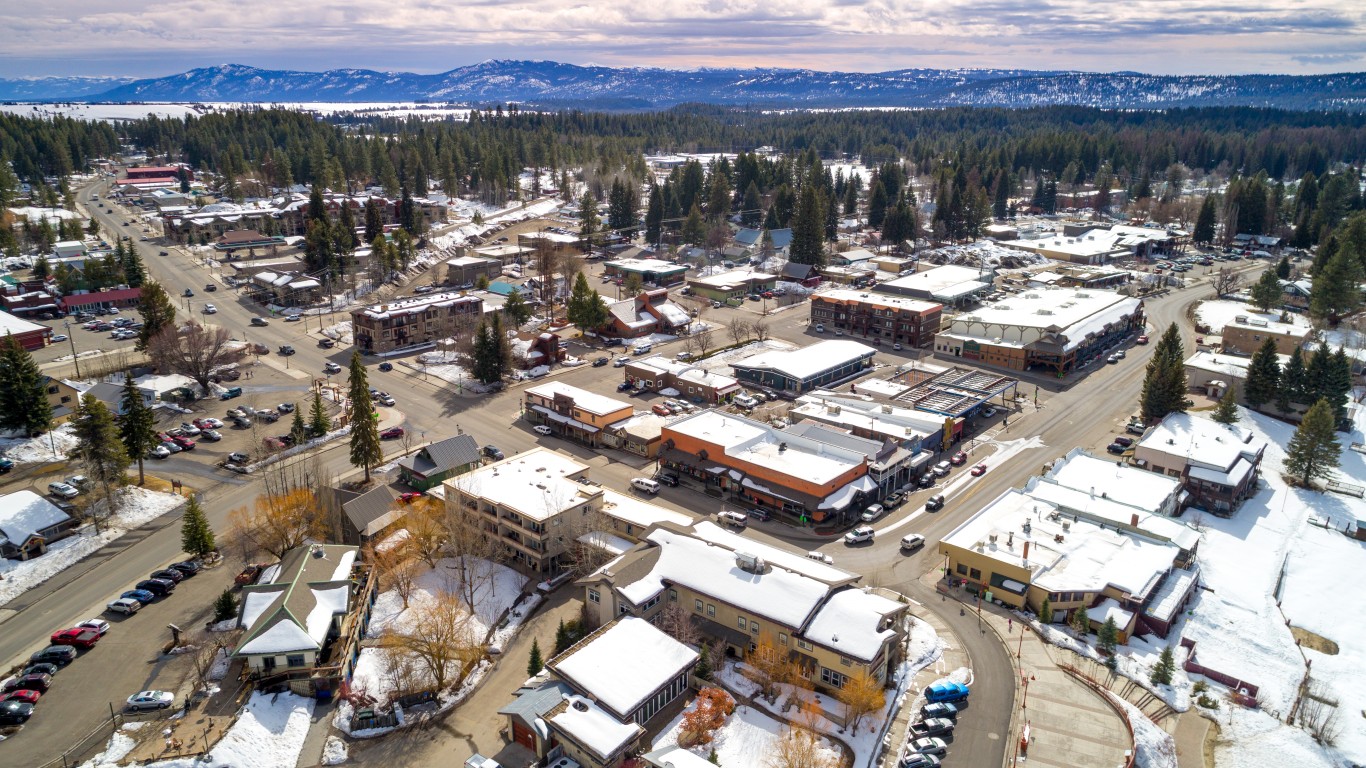
Idaho and Utah, two of the least-populous states in the nation, have a combined five counties on the list. While Ada County is the most populous of the three Idaho counties on the list, Teton County and Valley County are considerably smaller with a population of about 12,000 each.
Both states boast some of America’s most spectacular national parks such as Yellowstone and Zion. Idaho does not tax Social Security benefits and has a low crime rate. Utah is home to the prestigious Sundance Film Festival and some of America’s premier skiing resorts.
Click here to see where retirees are moving

25. Rockwall County, Texas
> Short-term change in 65+ pop, 2018-2020: +13.3% (+1,661)
> Long-term change in 65+ pop, 2011-2020: +74.5% (+6,035)
> Total 65+ population, July 1, 2020: 14,136, or 12.9% – #420 out of 1,027 counties
> Total population, July 1, 2020: 109,888 – #312 out of 1,027
[in-text-ad]

24. St. Bernard Parish, Louisiana
> Short-term change in 65+ pop, 2018-2020: +13.4% (+712)
> Long-term change in 65+ pop, 2018-2020: +71.0% (+2,503)
> Total 65+ population, July 1, 2020: 6,028, or 12.7% – #729 out of 1,027 counties
> Total population, July 1, 2020: 47,647 – #553 out of 1,027
[recirclink id=1124978]

23. Ada County, Idaho
> Short-term change in 65+ pop, 2018-2020: +13.4% (+9,085)
> Long-term change in 65+ pop, 2018-2020: +76.6% (+33,287)
> Total 65+ population, July 1, 2020: 76,757 – #76 out of 1,027 counties
> Total population, July 1, 2020: 494,399, or 15.5% – #56 out of 1,027

22. Carver County, Minnesota
> Short-term change in 65+ pop, 2018-2020: +13.9% (+1,732)
> Long-term change in 65+ pop, 2018-2020: +75.8% (+6,138)
> Total 65+ population, July 1, 2020: 14,232, or 13.4% – #418 out of 1,027 counties
> Total population, July 1, 2020: 106,565 – #324 out of 1,027
[in-text-ad-2]

21. Pinal County, Arizona
> Short-term change in 65+ pop, 2018-2020: +14.0% (+12,729)
> Long-term change in 65+ pop, 2018-2020: +83.2% (+47,137)
> Total 65+ population, July 1, 2020: 103,815, or 21.6% – #37 out of 1,027 counties
> Total population, July 1, 2020: 480,828 – #59 out of 1,027
20. Valley County, Idaho
> Short-term change in 65+ pop, 2018-2020: +14.0% (+389)
> Long-term change in 65+ pop, 2018-2020: +81.5% (+1,424)
> Total 65+ population, July 1, 2020: 3,172, or 26.9% – #949 out of 1,027 counties
> Total population, July 1, 2020: 11,792 – #997 out of 1,027
[in-text-ad]

19. Park County, Colorado
> Short-term change in 65+ pop, 2018-2020: +14.0% (+530)
> Long-term change in 65+ pop, 2018-2020: +110.9% (+2,267)
> Total 65+ population, July 1, 2020: 4,312, or 22.7% – #846 out of 1,027 counties
> Total population, July 1, 2020: 18,955 – #863 out of 1,027
[recirclink id=1042742]

18. Cherokee County, Georgia
> Short-term change in 65+ pop, 2018-2020: +14.1% (+5,020)
> Long-term change in 65+ pop, 2018-2020: +89.4% (+19,125)
> Total 65+ population, July 1, 2020: 40,519, or 15.3% – #153 out of 1,027 counties
> Total population, July 1, 2020: 265,274 – #128 out of 1,027

17. Currituck County, North Carolina
> Short-term change in 65+ pop, 2018-2020: +14.2% (+626)
> Long-term change in 65+ pop, 2018-2020: +58.8% (+1,869)
> Total 65+ population, July 1, 2020: 5,047, or 17.4% – #782 out of 1,027 counties
> Total population, July 1, 2020: 29,052 – #718 out of 1,027
[in-text-ad-2]

16. Long County, Georgia
> Short-term change in 65+ pop, 2018-2020: +14.3% (+266)
> Long-term change in 65+ pop, 2018-2020: +89.5% (+1,001)
> Total 65+ population, July 1, 2020: 2,120, or 10.5% – #1012 out of 1,027 counties
> Total population, July 1, 2020: 20,171 – #843 out of 1,027

15. Douglas County, Colorado
> Short-term change in 65+ pop, 2018-2020: +14.4% (+5,928)
> Long-term change in 65+ pop, 2018-2020: +108.0% (+24,479)
> Total 65+ population, July 1, 2020: 47,154, or 13.1% – #130 out of 1,027 counties
> Total population, July 1, 2020: 360,750 – #89 out of 1,027
[in-text-ad]

14. Teton County, Idaho
> Short-term change in 65+ pop, 2018-2020: +14.4% (+207)
> Long-term change in 65+ pop, 2018-2020: +126.0% (+915)
> Total 65+ population, July 1, 2020: 1,641, or 13.1% – #1023 out of 1,027 counties
> Total population, July 1, 2020: 12,501 – #977 out of 1,027
[recirclink id=1018379]

13. St. Johns County, Florida
> Short-term change in 65+ pop, 2018-2020: +14.7% (+7,495)
> Long-term change in 65+ pop, 2018-2020: +84.1% (+26,739)
> Total 65+ population, July 1, 2020: 58,541, or 21% – #94 out of 1,027 counties
> Total population, July 1, 2020: 278,715 – #125 out of 1,027

12. Williamson County, Texas
> Short-term change in 65+ pop, 2018-2020: +14.7% (+10,180)
> Long-term change in 65+ pop, 2018-2020: +93.7% (+38,450)
> Total 65+ population, July 1, 2020: 79,469, or 12.9% – #72 out of 1,027 counties
> Total population, July 1, 2020: 617,855 – #38 out of 1,027
[in-text-ad-2]

11. Comal County, Texas
> Short-term change in 65+ pop, 2018-2020: +14.7% (+3,969)
> Long-term change in 65+ pop, 2018-2020: +73.9% (+13,129)
> Total 65+ population, July 1, 2020: 30,883, or 18.7% – #203 out of 1,027 counties
> Total population, July 1, 2020: 164,812 – #219 out of 1,027

10. Skamania County, Washington
> Short-term change in 65+ pop, 2018-2020: +14.9% (+374)
> Long-term change in 65+ pop, 2018-2020: +69.2% (+1,178)
> Total 65+ population, July 1, 2020: 2,880, or 23.8% – #971 out of 1,027 counties
> Total population, July 1, 2020: 12,107 – #993 out of 1,027
[in-text-ad]

9. Horry County, South Carolina
> Short-term change in 65+ pop, 2018-2020: +15.1% (+12,427)
> Long-term change in 65+ pop, 2018-2020: +93.9% (+45,944)
> Total 65+ population, July 1, 2020: 94,875, or 26.0% – #46 out of 1,027 counties
> Total population, July 1, 2020: 365,449 – #88 out of 1,027
[recirclink id=1124835]

8. Brunswick County, North Carolina
> Short-term change in 65+ pop, 2018-2020: +15.1% (+6,556)
> Long-term change in 65+ pop, 2018-2020: +99.7% (+24,897)
> Total 65+ population, July 1, 2020: 49,876, or 33.5% – #120 out of 1,027 counties
> Total population, July 1, 2020: 149,039 – #250 out of 1,027
7. Fort Bend County, Texas
> Short-term change in 65+ pop, 2018-2020: +15.2% (+13,361)
> Long-term change in 65+ pop, 2018-2020: +115.1% (+54,078)
> Total 65+ population, July 1, 2020: 101,065, or 12.0% – #41 out of 1,027 counties
> Total population, July 1, 2020: 839,706 – #21 out of 1,027
[in-text-ad-2]

6. Iron County, Utah
> Short-term change in 65+ pop, 2018-2020: +15.5% (+1,049)
> Long-term change in 65+ pop, 2018-2020: +65.2% (+3,077)
> Total 65+ population, July 1, 2020: 7,798, or 13.7% – #631 out of 1,027 counties
> Total population, July 1, 2020: 56,814 – #491 out of 1,027

5. Hays County, Texas
> Short-term change in 65+ pop, 2018-2020: +16.1% (+3,925)
> Long-term change in 65+ pop, 2018-2020: +98.8% (+14,092)
> Total 65+ population, July 1, 2020: 28,354, or 11.7% – #230 out of 1,027 counties
> Total population, July 1, 2020: 241,365 – #144 out of 1,027
[in-text-ad]

4. Denton County, Texas
> Short-term change in 65+ pop, 2018-2020: +16.1% (+14,066)
> Long-term change in 65+ pop, 2018-2020: +101.8% (+51,204)
> Total 65+ population, July 1, 2020: 101,526, or 11.0% – #40 out of 1,027 counties
> Total population, July 1, 2020: 919,324 – #19 out of 1,027
[recirclink id=1085610]

3. Wasatch County, Utah
> Short-term change in 65+ pop, 2018-2020: +16.3% (+624)
> Long-term change in 65+ pop, 2018-2020: +108.1% (+2,311)
> Total 65+ population, July 1, 2020: 4,448, or 12.6% – #835 out of 1,027 counties
> Total population, July 1, 2020: 35,300 – #658 out of 1,027

2. Lincoln County, South Dakota
> Short-term change in 65+ pop, 2018-2020: +16.5% (+1,256)
> Long-term change in 65+ pop, 2018-2020: +107.4% (+4,594)
> Total 65+ population, July 1, 2020: 8,873, or 14.1% – #568 out of 1,027 counties
> Total population, July 1, 2020: 63,019 – #461 out of 1,027
[in-text-ad-2]

1. Jasper County, South Carolina
> Short-term change in 65+ pop, 2018-2020: +20.6% (+1,175)
> Long-term change in 65+ pop, 2018-2020: +128.7% (+3,867)
> Total 65+ population, July 1, 2020: 6,871, or 21.8% – #675 out of 1,027 counties
> Total population, July 1, 2020: 31,588 – #689 out of 1,027
Contact [email protected] for any questions or corrections.