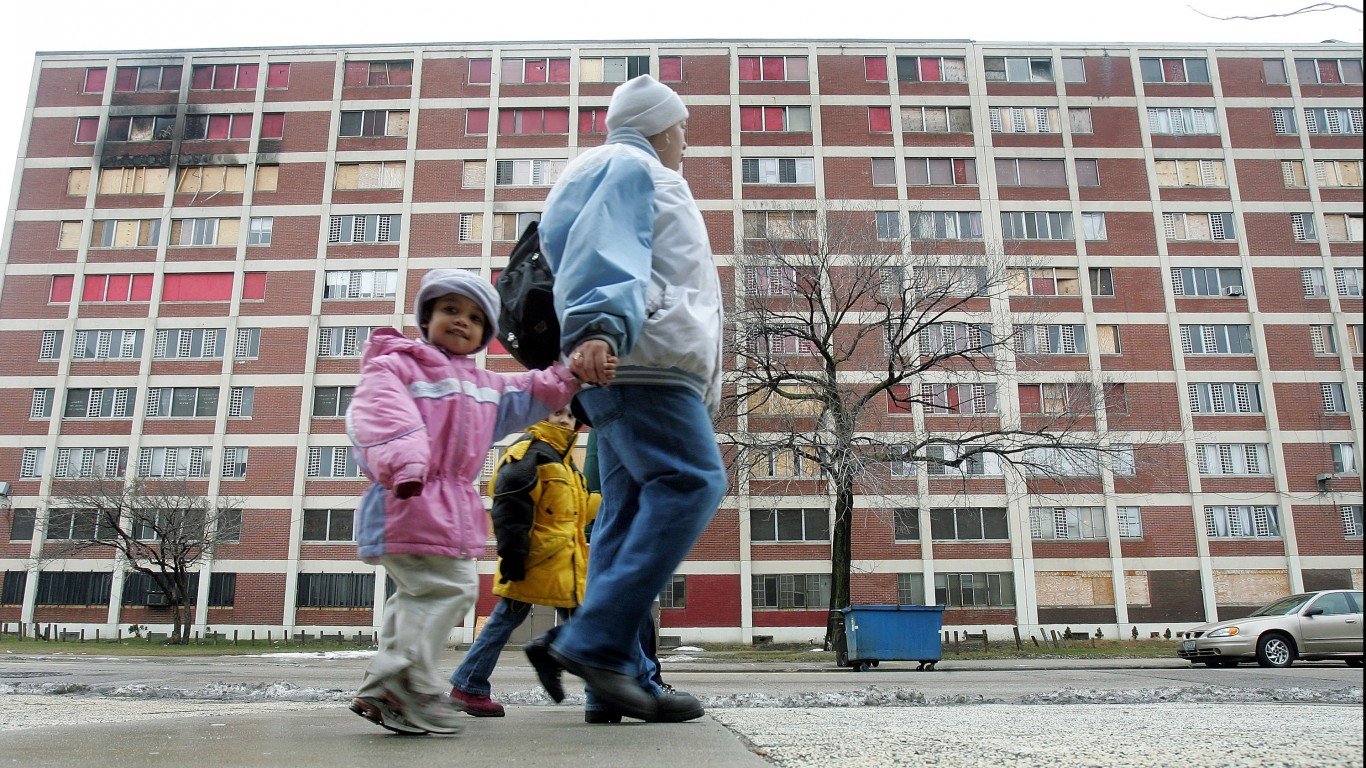
More than 40 million Americans live below the poverty line, and of those facing such financial hardship, children are disproportionately affected. Nearly 12.6 million children under age 18 live in households with poverty level income.
Not only are children at higher risk of poverty, they are also especially vulnerable to poverty’s harmful effects, both in the immediate and long-term. Childhood poverty can negatively impact brain development and has been linked with a greater likelihood of chronic illness, shorter life expectancy, and poor emotional and behavioral health. Those who spend some or all of their childhood in poverty are also less likely to succeed in school or be financially secure later in life.
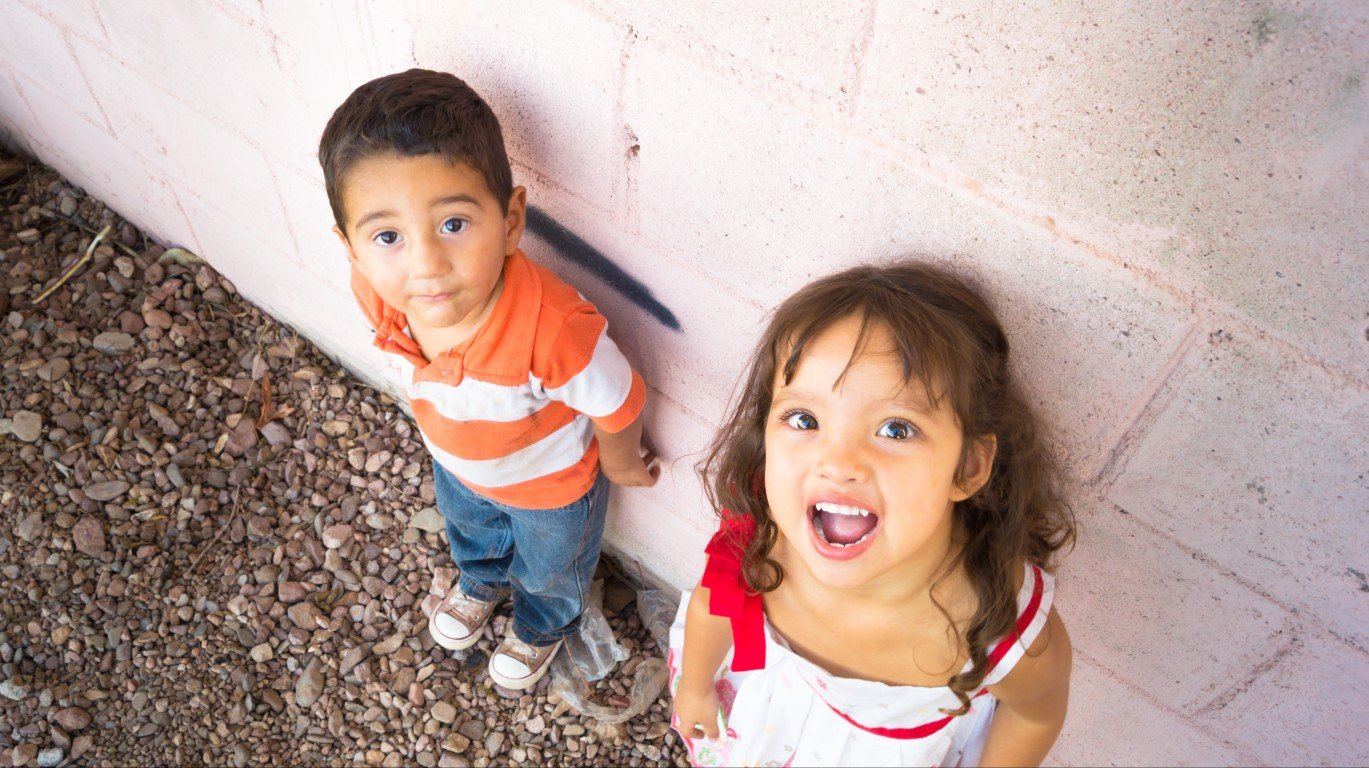
Nationwide, an estimated 17.5% of children under age 18 live below the poverty line. And though the United States has one of the worst child poverty rates among wealthy, developed countries, in parts of the U.S., child poverty is considerably less common than it is nationwide.
Using data from the U.S. Census Bureau, 24/7 Wall St. identified the 50 U.S. counties and county equivalents with the lowest child poverty rates.
In every county on this list, less than 6% of children live below the poverty line. The places on this list span the country, though seven are located in Nebraska, the most of any state. Here is a look at the income a family needs to cover normal living expenses in every state.
Not only is serious financial hardship less common in these places than in much of the country, but families also tend to be relatively well off. In most of the counties on this list, the median income among households with children exceeds the national median of $77,445, and in over half of these counties this median exceeds $100,000. Here is a look at the richest town in every state.
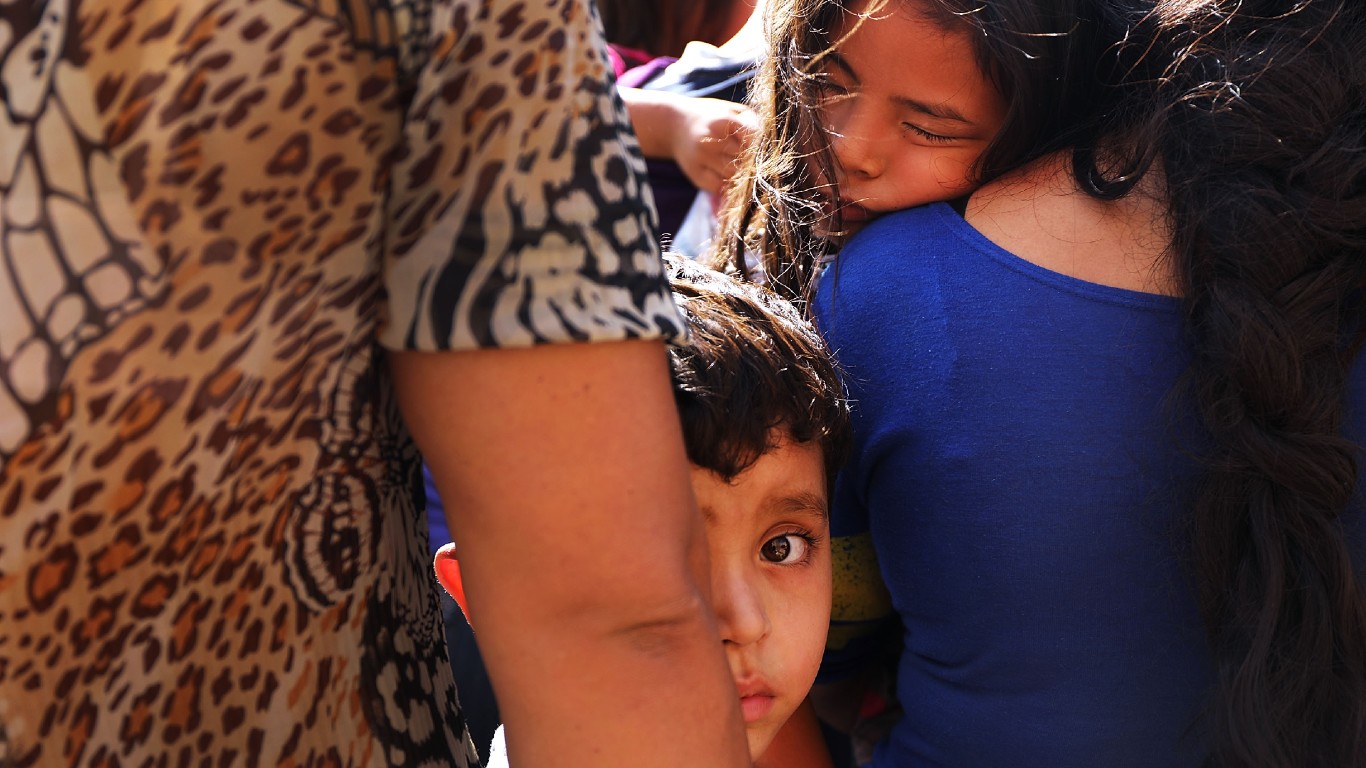
Households with two parents are more likely to be financially secure than those headed by a single parent. Single-mother households are especially vulnerable to financial insecurity, and in every county on this list, the share of households with children headed by a single mother is below the 11.7% national share.
Click here to see the counties with the lowest child poverty rates
Click here to read our detailed methodology

50. Carroll County, Maryland
> Child poverty rate: 5.3%
> Median family income, households with children: $125,162 — 40th highest of 2,924 counties
> Share of households with children receiving SNAP benefits: 7.9% — 202nd lowest of 2,931 counties
> Households headed by single mothers: 5.9% — 209th lowest of 2,931 counties
[in-text-ad]

49. Washington County, Wisconsin
> Child poverty rate: 5.3%
> Median family income, households with children: $105,466 — 122nd highest of 2,924 counties
> Share of households with children receiving SNAP benefits: 7.5% — 183rd lowest of 2,931 counties
> Households headed by single mothers: 6.8% — 389th lowest of 2,931 counties
[recirclink id=1106510]

48. Seward County, Nebraska
> Child poverty rate: 5.3%
> Median family income, households with children: $82,426 — 465th highest of 2,924 counties
> Share of households with children receiving SNAP benefits: 9.4% — 295th lowest of 2,931 counties
> Households headed by single mothers: 7.4% — 522nd lowest of 2,931 counties
47. Hamilton County, Indiana
> Child poverty rate: 5.3%
> Median family income, households with children: $125,265 — 38th highest of 2,924 counties
> Share of households with children receiving SNAP benefits: 3.9% — 35th lowest of 2,931 counties
> Households headed by single mothers: 7.6% — 588th lowest of 2,931 counties
[in-text-ad-2]

46. Delaware County, Ohio
> Child poverty rate: 5.2%
> Median family income, households with children: $144,675 — 17th highest of 2,924 counties
> Share of households with children receiving SNAP benefits: 3.9% — 34th lowest of 2,931 counties
> Households headed by single mothers: 6.2% — 263rd lowest of 2,931 counties

45. Geauga County, Ohio
> Child poverty rate: 5.2%
> Median family income, households with children: $110,638 — 95th highest of 2,924 counties
> Share of households with children receiving SNAP benefits: 6.8% — 150th lowest of 2,931 counties
> Households headed by single mothers: 3.7% — 23rd lowest of 2,931 counties
[in-text-ad]

44. Morris County, New Jersey
> Child poverty rate: 5.1%
> Median family income, households with children: $153,815 — 12th highest of 2,924 counties
> Share of households with children receiving SNAP benefits: 3.5% — 21st lowest of 2,931 counties
> Households headed by single mothers: 6.4% — 307th lowest of 2,931 counties
[recirclink id=1047662]

43. Broomfield County, Colorado
> Child poverty rate: 5.1%
> Median family income, households with children: $142,278 — 20th highest of 2,924 counties
> Share of households with children receiving SNAP benefits: 3.5% — 25th lowest of 2,931 counties
> Households headed by single mothers: 6.1% — 242nd lowest of 2,931 counties

42. St. Croix County, Wisconsin
> Child poverty rate: 5.1%
> Median family income, households with children: $103,107 — 137th highest of 2,924 counties
> Share of households with children receiving SNAP benefits: 5.5% — 83rd lowest of 2,931 counties
> Households headed by single mothers: 7.9% — 685th lowest of 2,931 counties
[in-text-ad-2]

41. Kendall County, Texas
> Child poverty rate: 5.0%
> Median family income, households with children: $131,089 — 30th highest of 2,924 counties
> Share of households with children receiving SNAP benefits: 8.9% — 248th lowest of 2,931 counties
> Households headed by single mothers: 5.6% — 169th lowest of 2,931 counties

40. LaGrange County, Indiana
> Child poverty rate: 5.0%
> Median family income, households with children: $80,141 — 555th highest of 2,924 counties
> Share of households with children receiving SNAP benefits: 8.5% — 229th lowest of 2,931 counties
> Households headed by single mothers: 7.8% — 642nd lowest of 2,931 counties
[in-text-ad]

39. Lyon County, Iowa
> Child poverty rate: 5.0%
> Median family income, households with children: $85,309 — 390th highest of 2,924 counties
> Share of households with children receiving SNAP benefits: 5.1% — 67th lowest of 2,931 counties
> Households headed by single mothers: 5.8% — 204th lowest of 2,931 counties
[recirclink id=1092222]

38. Rockwall County, Texas
> Child poverty rate: 4.9%
> Median family income, households with children: $116,647 — 73rd highest of 2,924 counties
> Share of households with children receiving SNAP benefits: 5.5% — 84th lowest of 2,931 counties
> Households headed by single mothers: 6.9% — 401st lowest of 2,931 counties

37. Teller County, Colorado
> Child poverty rate: 4.9%
> Median family income, households with children: $85,625 — 380th highest of 2,924 counties
> Share of households with children receiving SNAP benefits: 9.1% — 262nd lowest of 2,931 counties
> Households headed by single mothers: 3.9% — 34th lowest of 2,931 counties
[in-text-ad-2]

36. Powhatan County, Virginia
> Child poverty rate: 4.9%
> Median family income, households with children: $119,970 — 60th highest of 2,924 counties
> Share of households with children receiving SNAP benefits: 6.5% — 132nd lowest of 2,931 counties
> Households headed by single mothers: 4.8% — 90th lowest of 2,931 counties

35. Woodford County, Illinois
> Child poverty rate: 4.8%
> Median family income, households with children: $95,593 — 203rd highest of 2,924 counties
> Share of households with children receiving SNAP benefits: 11.8% — 501st lowest of 2,931 counties
> Households headed by single mothers: 6.9% — 414th lowest of 2,931 counties
[in-text-ad]

34. Dodge County, Minnesota
> Child poverty rate: 4.8%
> Median family income, households with children: $90,028 — 274th highest of 2,924 counties
> Share of households with children receiving SNAP benefits: 6.0% — 105th lowest of 2,931 counties
> Households headed by single mothers: 8.0% — 721st lowest of 2,931 counties
[recirclink id=1097516]

33. Tolland County, Connecticut
> Child poverty rate: 4.7%
> Median family income, households with children: $118,141 — 65th highest of 2,924 counties
> Share of households with children receiving SNAP benefits: 9.0% — 261st lowest of 2,931 counties
> Households headed by single mothers: 7.6% — 615th lowest of 2,931 counties

32. Jefferson County, Montana
> Child poverty rate: 4.7%
> Median family income, households with children: $90,821 — 264th highest of 2,924 counties
> Share of households with children receiving SNAP benefits: 6.8% — 151st lowest of 2,931 counties
> Households headed by single mothers: 4.9% — 107th lowest of 2,931 counties
[in-text-ad-2]

31. Dallas County, Iowa
> Child poverty rate: 4.7%
> Median family income, households with children: $130,871 — 31st highest of 2,924 counties
> Share of households with children receiving SNAP benefits: 6.5% — 130th lowest of 2,931 counties
> Households headed by single mothers: 6.4% — 306th lowest of 2,931 counties

30. Emmons County, North Dakota
> Child poverty rate: 4.7%
> Median family income, households with children: $82,109 — 471st highest of 2,924 counties
> Share of households with children receiving SNAP benefits: 7.2% — 166th lowest of 2,931 counties
> Households headed by single mothers: 2.4% — 3rd lowest of 2,931 counties
[in-text-ad]

29. Elbert County, Colorado
> Child poverty rate: 4.6%
> Median family income, households with children: $119,730 — 62nd highest of 2,924 counties
> Share of households with children receiving SNAP benefits: 8.8% — 246th lowest of 2,931 counties
> Households headed by single mothers: 3.9% — 32nd lowest of 2,931 counties
[recirclink id=1012509]

28. Boone County, Nebraska
> Child poverty rate: 4.6%
> Median family income, households with children: $81,172 — 520th highest of 2,924 counties
> Share of households with children receiving SNAP benefits: 8.1% — 213th lowest of 2,931 counties
> Households headed by single mothers: 5.6% — 164th lowest of 2,931 counties

27. Washington County, Minnesota
> Child poverty rate: 4.6%
> Median family income, households with children: $120,515 — 55th highest of 2,924 counties
> Share of households with children receiving SNAP benefits: 6.1% — 113th lowest of 2,931 counties
> Households headed by single mothers: 7.7% — 640th lowest of 2,931 counties
[in-text-ad-2]

26. Pierce County, Wisconsin
> Child poverty rate: 4.6%
> Median family income, households with children: $100,270 — 164th highest of 2,924 counties
> Share of households with children receiving SNAP benefits: 6.6% — 141st lowest of 2,931 counties
> Households headed by single mothers: 5.2% — 127th lowest of 2,931 counties

25. Fayette County, Georgia
> Child poverty rate: 4.6%
> Median family income, households with children: $112,895 — 90th highest of 2,924 counties
> Share of households with children receiving SNAP benefits: 7.7% — 195th lowest of 2,931 counties
> Households headed by single mothers: 8.3% — 834th lowest of 2,931 counties
[in-text-ad]

24. Ozaukee County, Wisconsin
> Child poverty rate: 4.5%
> Median family income, households with children: $117,944 — 67th highest of 2,924 counties
> Share of households with children receiving SNAP benefits: 3.5% — 22nd lowest of 2,931 counties
> Households headed by single mothers: 6.2% — 256th lowest of 2,931 counties
[recirclink id=1106510]

23. Bristol County, Rhode Island
> Child poverty rate: 4.5%
> Median family income, households with children: $123,237 — 48th highest of 2,924 counties
> Share of households with children receiving SNAP benefits: 5.3% — 76th lowest of 2,931 counties
> Households headed by single mothers: 7.6% — 594th lowest of 2,931 counties

22. Cuming County, Nebraska
> Child poverty rate: 4.5%
> Median family income, households with children: $73,036 — 857th highest of 2,924 counties
> Share of households with children receiving SNAP benefits: 4.4% — 50th lowest of 2,931 counties
> Households headed by single mothers: 4.4% — 61st lowest of 2,931 counties
[in-text-ad-2]

21. Jefferson County, Nebraska
> Child poverty rate: 4.4%
> Median family income, households with children: $65,833 — 1,296th highest of 2,924 counties (tied)
> Share of households with children receiving SNAP benefits: 16.4% — 1,022nd lowest of 2,931 counties
> Households headed by single mothers: 7.3% — 503rd lowest of 2,931 counties

20. Williamson County, Tennessee
> Child poverty rate: 4.4%
> Median family income, households with children: $137,829 — 22nd highest of 2,924 counties
> Share of households with children receiving SNAP benefits: 3.8% — 29th lowest of 2,931 counties
> Households headed by single mothers: 6.4% — 298th lowest of 2,931 counties
[in-text-ad]

19. Deuel County, South Dakota
> Child poverty rate: 4.3%
> Median family income, households with children: $70,531 — 1,001st highest of 2,924 counties
> Share of households with children receiving SNAP benefits: 11.2% — 448th lowest of 2,931 counties
> Households headed by single mothers: 3.0% — 8th lowest of 2,931 counties
[recirclink id=1047662]

18. Calvert County, Maryland
> Child poverty rate: 4.3%
> Median family income, households with children: $133,215 — 27th highest of 2,924 counties
> Share of households with children receiving SNAP benefits: 7.2% — 167th lowest of 2,931 counties
> Households headed by single mothers: 7.0% — 438th lowest of 2,931 counties

17. Phillips County, Colorado
> Child poverty rate: 4.2%
> Median family income, households with children: $53,854 — 798th lowest of 2,924 counties
> Share of households with children receiving SNAP benefits: 20.9% — 1,317th highest of 2,931 counties
> Households headed by single mothers: 5.5% — 158th lowest of 2,931 counties
[in-text-ad-2]

16. Hamilton County, Nebraska
> Child poverty rate: 4.2%
> Median family income, households with children: $89,830 — 280th highest of 2,924 counties
> Share of households with children receiving SNAP benefits: 12.2% — 544th lowest of 2,931 counties
> Households headed by single mothers: 7.5% — 559th lowest of 2,931 counties

15. Summit County, Utah
> Child poverty rate: 4.0%
> Median family income, households with children: $121,343 — 52nd highest of 2,924 counties
> Share of households with children receiving SNAP benefits: 1.5% — 4th lowest of 2,931 counties
> Households headed by single mothers: 6.7% — 372nd lowest of 2,931 counties
[in-text-ad]
14. Thomas County, Kansas
> Child poverty rate: 4.0%
> Median family income, households with children: $82,016 — 474th highest of 2,924 counties
> Share of households with children receiving SNAP benefits: 12.2% — 552nd lowest of 2,931 counties
> Households headed by single mothers: 3.6% — 21st lowest of 2,931 counties
[recirclink id=1092222]

13. Kingsbury County, South Dakota
> Child poverty rate: 3.9%
> Median family income, households with children: $86,493 — 358th highest of 2,924 counties
> Share of households with children receiving SNAP benefits: 4.0% — 40th lowest of 2,931 counties
> Households headed by single mothers: 5.3% — 140th lowest of 2,931 counties

12. Pembina County, North Dakota
> Child poverty rate: 3.8%
> Median family income, households with children: $75,234 — 763rd highest of 2,924 counties
> Share of households with children receiving SNAP benefits: 9.7% — 324th lowest of 2,931 counties
> Households headed by single mothers: 6.3% — 279th lowest of 2,931 counties
[in-text-ad-2]

11. Holt County, Nebraska
> Child poverty rate: 3.7%
> Median family income, households with children: $70,033 — 1,028th highest of 2,924 counties
> Share of households with children receiving SNAP benefits: 8.2% — 220th lowest of 2,931 counties
> Households headed by single mothers: 5.3% — 137th lowest of 2,931 counties

10. Dickey County, North Dakota
> Child poverty rate: 3.3%
> Median family income, households with children: $93,750 — 222nd highest of 2,924 counties (tied)
> Share of households with children receiving SNAP benefits: 9.8% — 329th lowest of 2,931 counties
> Households headed by single mothers: 3.2% — 11th lowest of 2,931 counties
[in-text-ad]

9. Lincoln County, South Dakota
> Child poverty rate: 3.3%
> Median family income, households with children: $105,625 — 118th highest of 2,924 counties
> Share of households with children receiving SNAP benefits: 5.8% — 92nd lowest of 2,931 counties
> Households headed by single mothers: 8.8% — 1,000th lowest of 2,931 counties
[recirclink id=1097516]

8. Howard County, Nebraska
> Child poverty rate: 3.3%
> Median family income, households with children: $74,569 — 794th highest of 2,924 counties
> Share of households with children receiving SNAP benefits: 13.5% — 698th lowest of 2,931 counties
> Households headed by single mothers: 8.4% — 856th lowest of 2,931 counties

7. Hunterdon County, New Jersey
> Child poverty rate: 3.0%
> Median family income, households with children: $163,371 — 6th highest of 2,924 counties
> Share of households with children receiving SNAP benefits: 3.7% — 28th lowest of 2,931 counties
> Households headed by single mothers: 4.3% — 57th lowest of 2,931 counties
[in-text-ad-2]

6. Loudoun County, Virginia
> Child poverty rate: 2.9%
> Median family income, households with children: $172,331 — 3rd highest of 2,924 counties
> Share of households with children receiving SNAP benefits: 4.3% — 49th lowest of 2,931 counties
> Households headed by single mothers: 6.2% — 259th lowest of 2,931 counties

5. Rooks County, Kansas
> Child poverty rate: 2.8%
> Median family income, households with children: $62,530 — 1,384th lowest of 2,924 counties
> Share of households with children receiving SNAP benefits: 9.1% — 269th lowest of 2,931 counties
> Households headed by single mothers: 6.5% — 318th lowest of 2,931 counties
[in-text-ad]

4. Carver County, Minnesota
> Child poverty rate: 2.5%
> Median family income, households with children: $136,860 — 25th highest of 2,924 counties
> Share of households with children receiving SNAP benefits: 3.9% — 36th lowest of 2,931 counties
> Households headed by single mothers: 6.2% — 261st lowest of 2,931 counties
[recirclink id=1012509]

3. Goochland County, Virginia
> Child poverty rate: 2.4%
> Median family income, households with children: $114,842 — 80th highest of 2,924 counties
> Share of households with children receiving SNAP benefits: 11.3% — 456th lowest of 2,931 counties
> Households headed by single mothers: 4.7% — 83rd lowest of 2,931 counties

2. Douglas County, Colorado
> Child poverty rate: 2.4%
> Median family income, households with children: $144,758 — 16th highest of 2,924 counties
> Share of households with children receiving SNAP benefits: 2.1% — 9th lowest of 2,931 counties
> Households headed by single mothers: 5.1% — 119th lowest of 2,931 counties
[in-text-ad-2]

1. Stanley County, South Dakota
> Child poverty rate: 0.0% reported
> Median family income, households with children: $94,234 — 216th highest of 2,924 counties
> Share of households with children receiving SNAP benefits: 0.0% reported — the lowest of 2,931 counties
> Households headed by single mothers: 5.3% — 136th lowest of 2,931 counties
Methodology
To determine the counties and county equivalents where the fewest children live in poverty, 24/7 Wall St. reviewed five-year estimates of child poverty rates from the U.S. Census Bureau’s 2020 American Community Survey.
Counties were excluded if the child poverty rate was not available in the 2020 ACS, if the number of children for whom poverty status was determined was lower than 500, or if the sampling error associated with a county’s data was deemed too high.
The sampling error was defined as too high if the coefficient of variation — a statistical assessment of how reliable an estimate is — for a conty’s child poverty rate was above 15% and greater than two standard deviations above the mean CV for all counties’ child poverty rates. We similarly excluded counties that had a sampling error too high for their population, using the same definition.
Counties were ranked based on the share of children living in poverty. To break ties, we used the number of children living in poverty.
Additional information on median income for families with children, the share of households with children receiving benefits from the Supplemental Nutrition Assistance Program, and the share of households headed by single mothers are also five-year estimates from the 2020 ACS.
Contact [email protected] for any questions or corrections.