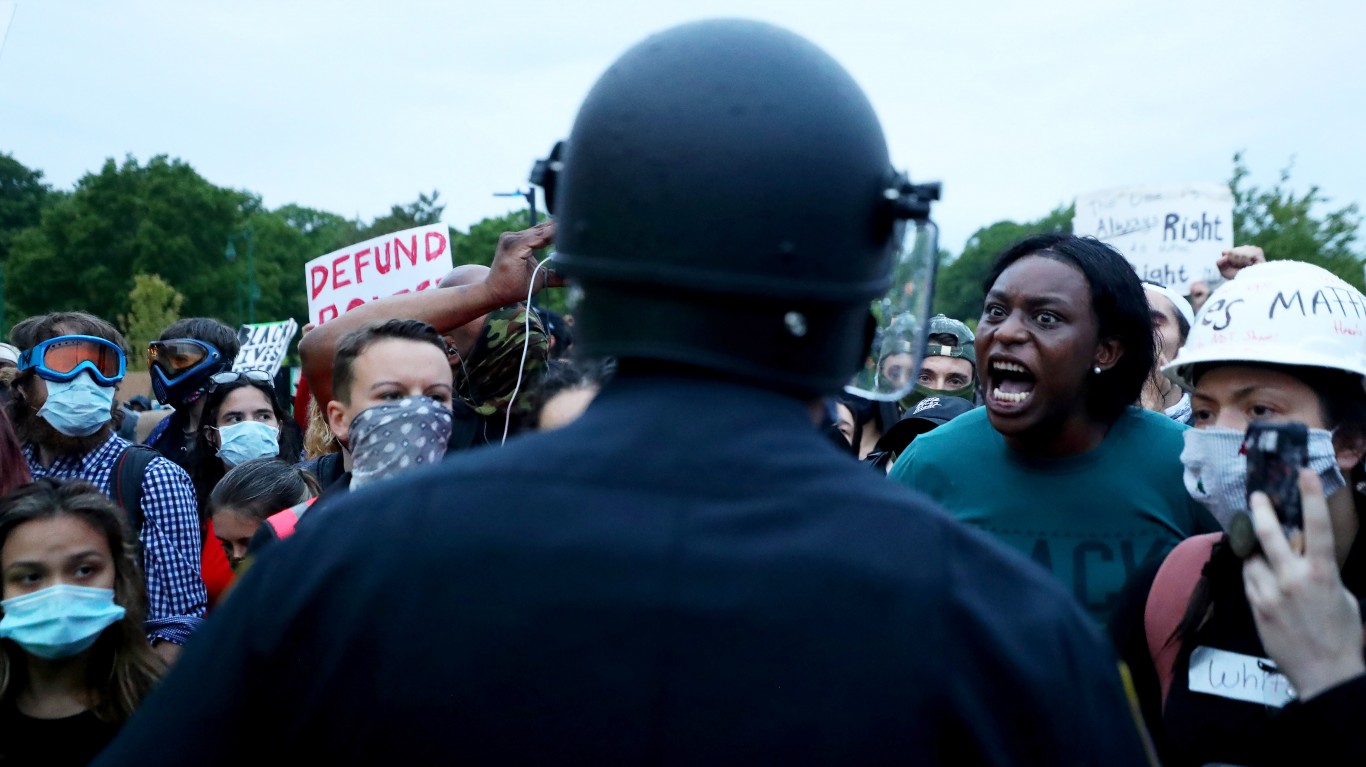
The effects of the COVID-19 pandemic on small businesses across the country was catastrophic, with minority and Black-owned businesses, in particular, disproportionately affected.
A recent report from Facebook’s parent company, Meta, revealed that 26% of minority-owned businesses were closed in January 2022, compared to 19% of non-minority owned businesses. Additionally, over half of Black-owned businesses reported a year-over-year decline in sales, compared to 36% of other small businesses
Black entrepreneurs have faced unique challenges in the United States long before the lockdowns, labor shortages, and supply chain issues triggered by the pandemic. These include limited access to financing and higher rates of financial distress. (Here is a look at the worst cities for Black Americans.)
Today, there are only about 134,600 Black-owned businesses nationwide, equal to just 2.3% of all businesses. In some major metropolitan areas, however, Black-owned businesses are far more common than average.
Using data from the U.S. Census Bureau, 24/7 Wall St. identified the cities with the most Black-owned businesses.
The metro areas on the list are heavily concentrated in the South. And in every metro area on the list, over 3% of businesses are owned by Black entrepreneurs. Here is a look at 27 Black inventors who made life easier.
It is important to note that while a larger than average share of businesses in these metro areas are Black owned, these places are also home to larger than average Black populations. In most of the metro areas on this list, at least 20% of the population are Black, compared to 12.6% of the total U.S. population.
Click here to see the cities with the most Black-owned businesses
Click here to read our detailed methodology
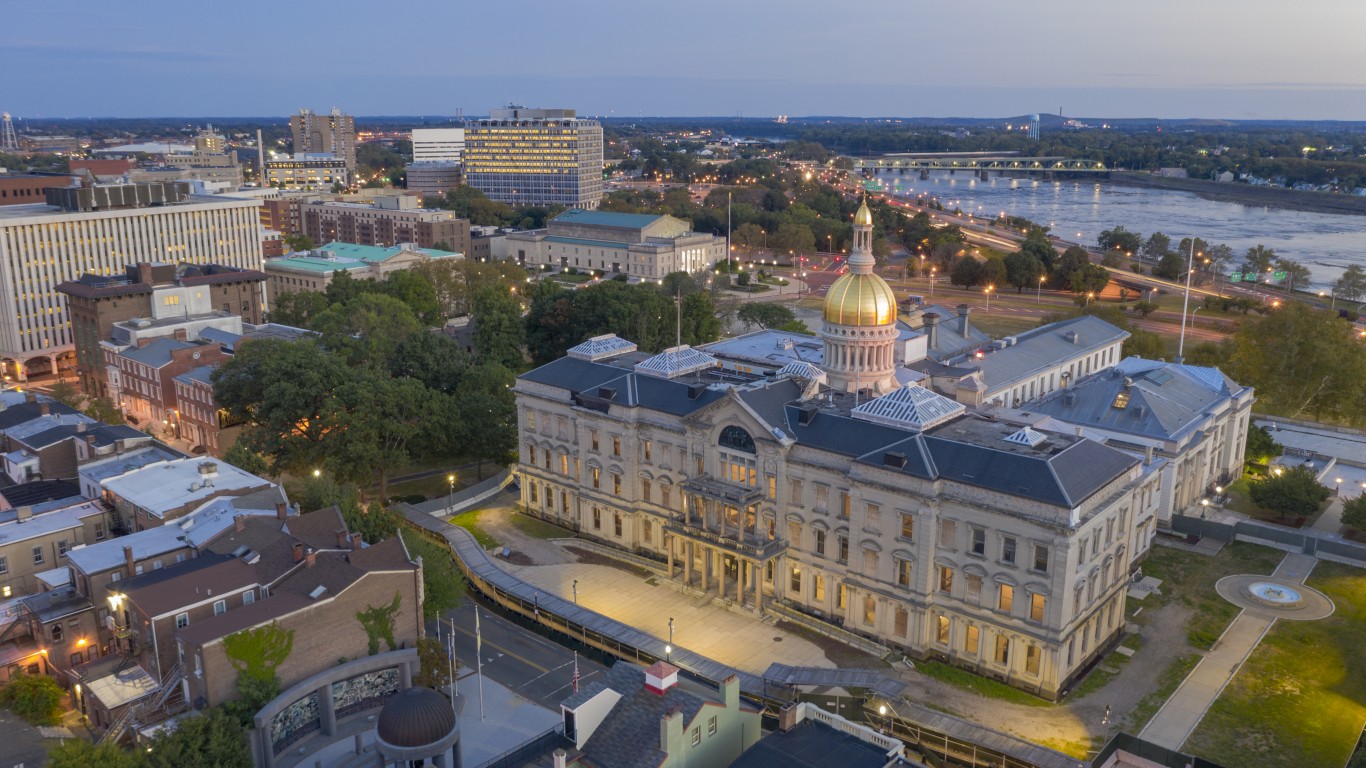
25. Trenton, NJ
> Firms owned by Black residents: 3.1% (250)
> Black population share: 20.5% (75,292)
> Black median household income: $48,688 (vs. $83,306 for all races)
> Black homeownership rate: 41.2% (vs. 63.5% for all races)
[in-text-ad]
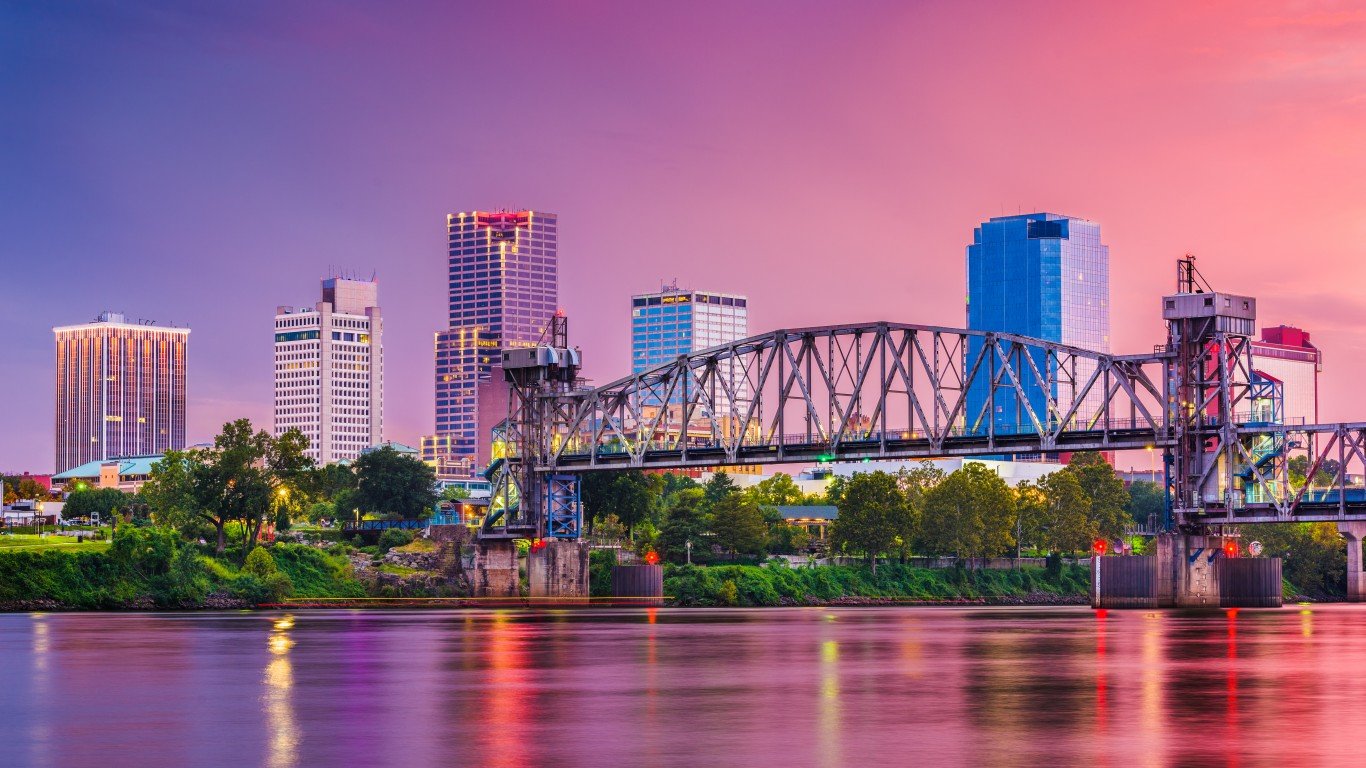
24. Little Rock-North Little Rock-Conway, AR
> Firms owned by Black residents: 3.1% (440)
> Black population share: 23.5% (174,046)
> Black median household income: $38,085 (vs. $55,983 for all races)
> Black homeownership rate: 42.7% (vs. 63.9% for all races)
[recirclink id=1108184]
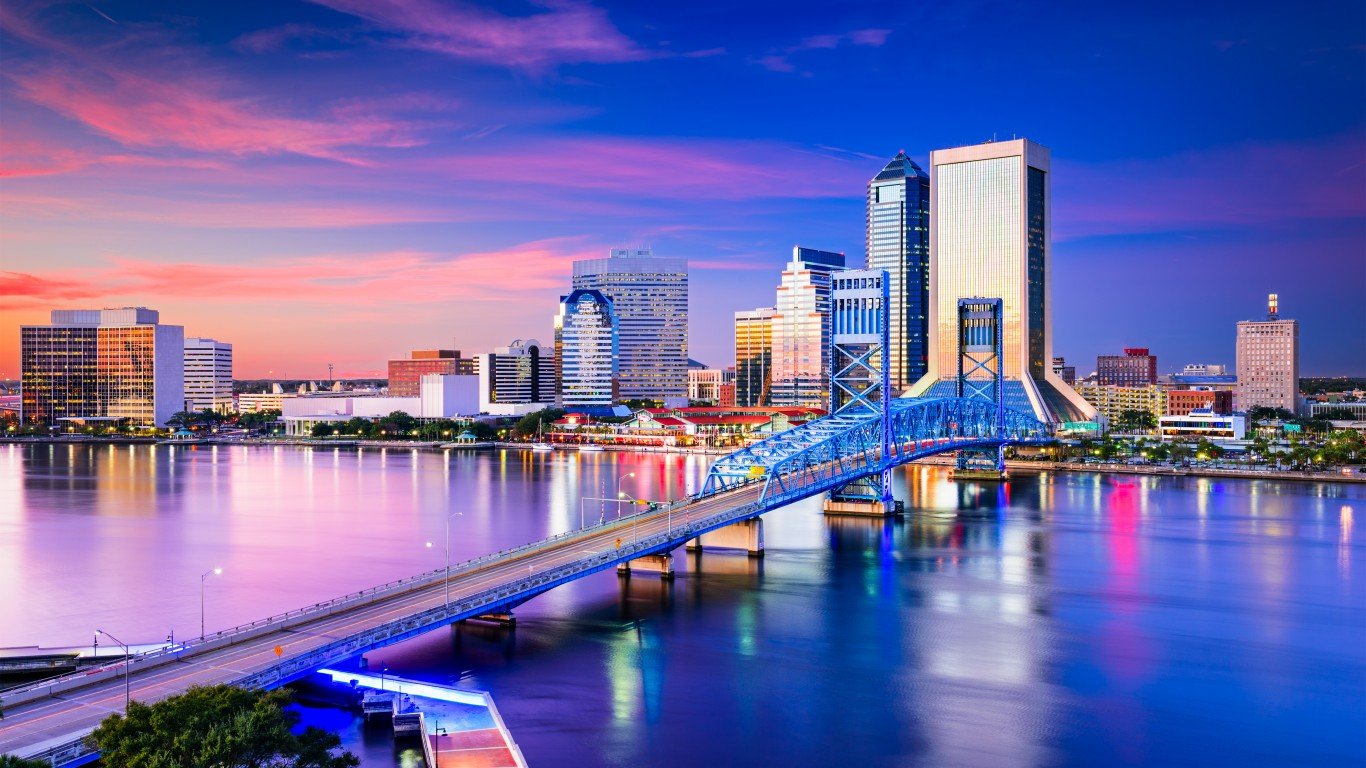
23. Jacksonville, FL
> Firms owned by Black residents: 3.4% (993)
> Black population share: 21.3% (326,975)
> Black median household income: $43,144 (vs. $63,064 for all races)
> Black homeownership rate: 44.5% (vs. 65.3% for all races)
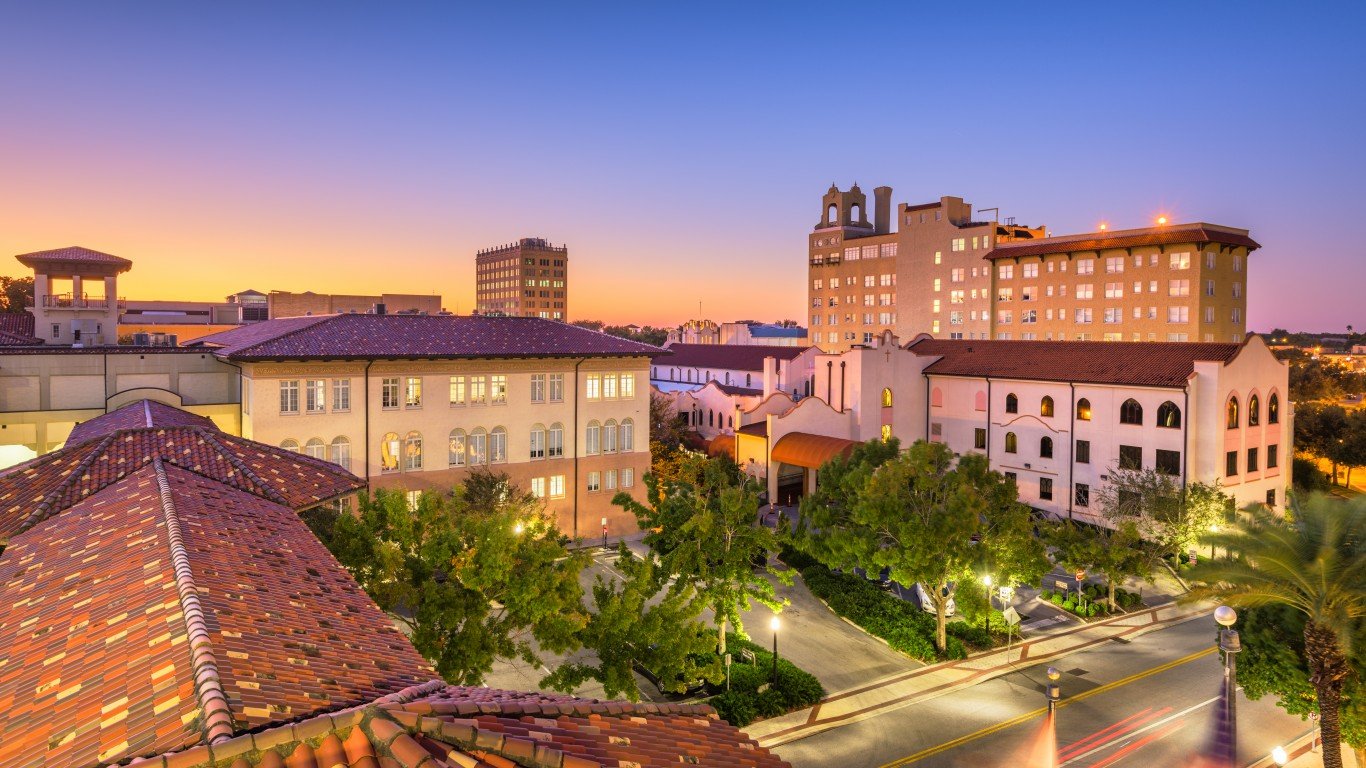
22. Lakeland-Winter Haven, FL
> Firms owned by Black residents: 3.4% (312)
> Black population share: 15.3% (107,633)
> Black median household income: $39,255 (vs. $51,535 for all races)
> Black homeownership rate: 50.6% (vs. 69.5% for all races)
[in-text-ad-2]
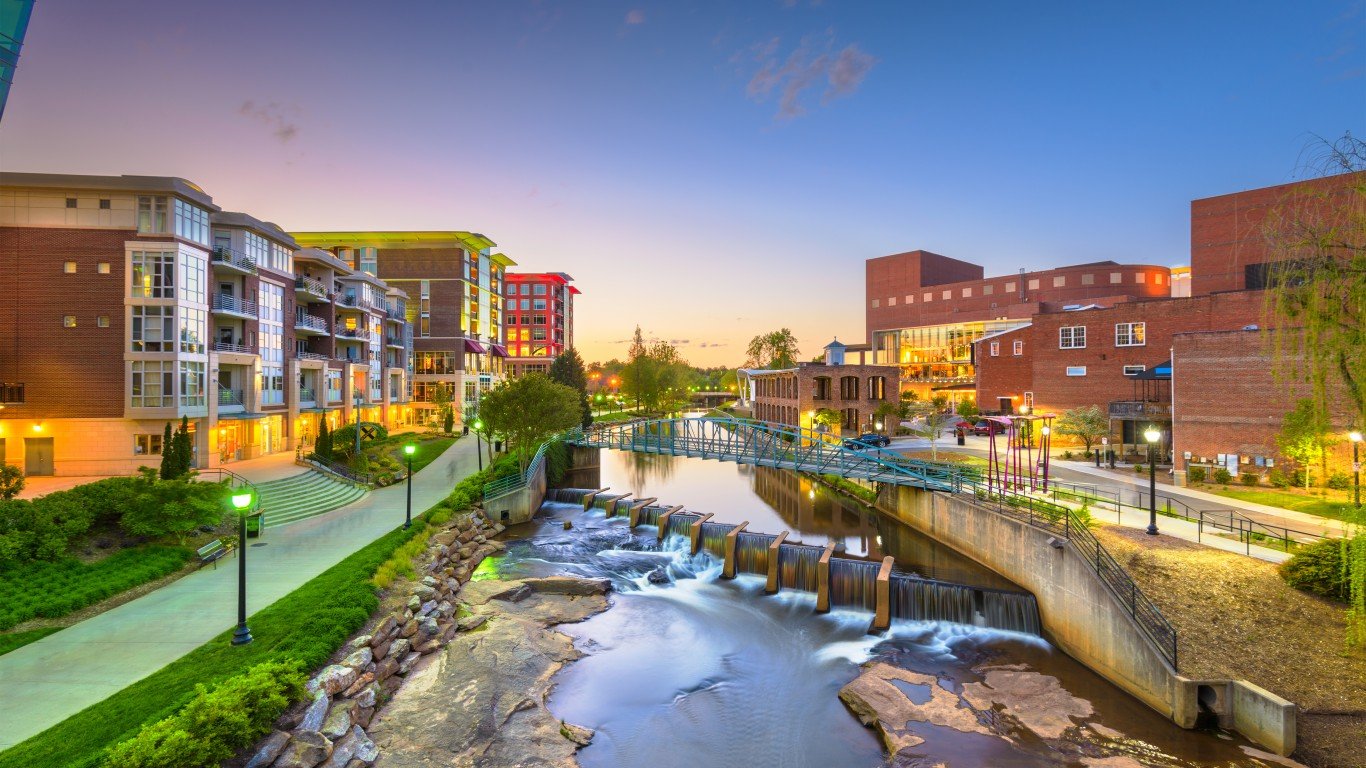
21. Greenville-Anderson-Mauldin, SC
> Firms owned by Black residents: 3.5% (527)
> Black population share: 16.1% (145,890)
> Black median household income: $36,908 (vs. $57,432 for all races)
> Black homeownership rate: 44.5% (vs. 69.5% for all races)
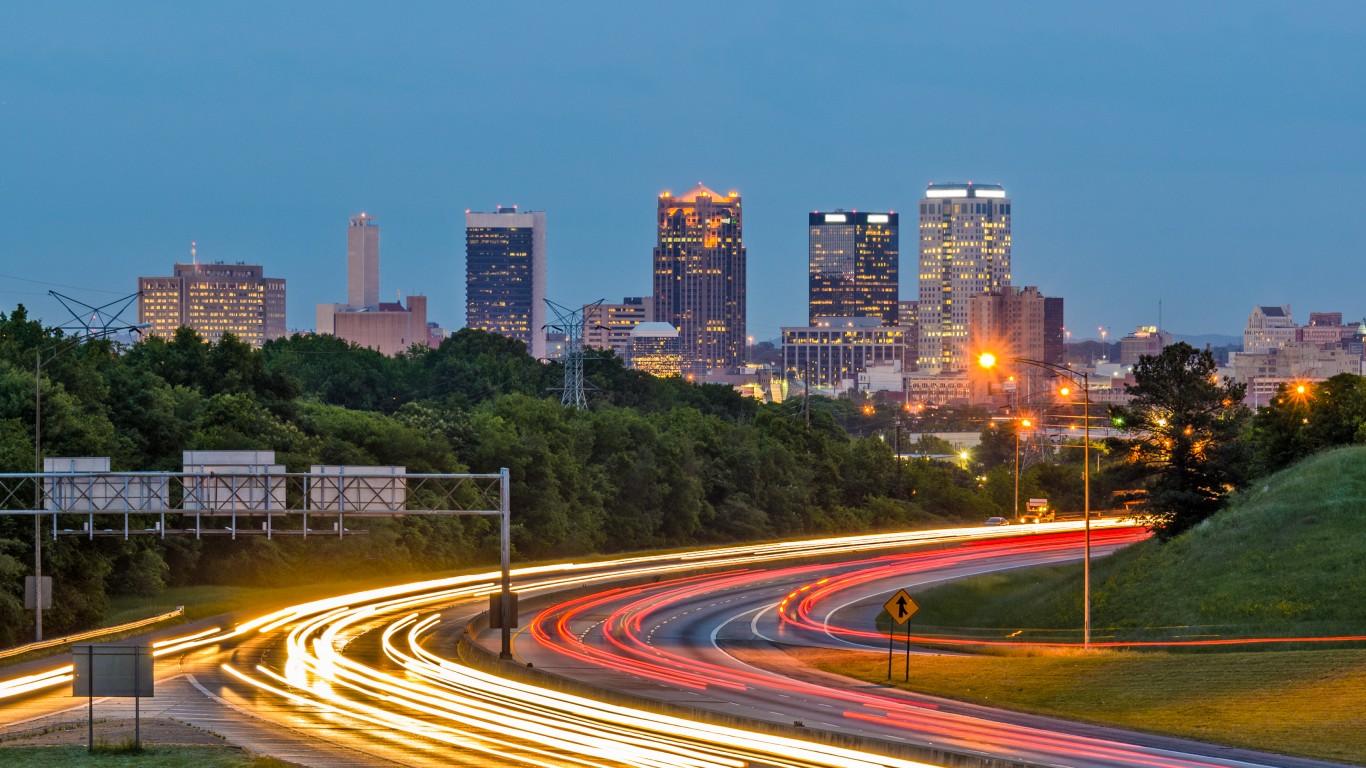
20. Birmingham-Hoover, AL
> Firms owned by Black residents: 3.5% (693)
> Black population share: 30.1% (327,271)
> Black median household income: $40,535 (vs. $59,185 for all races)
> Black homeownership rate: 50.8% (vs. 69.2% for all races)
[in-text-ad]

19. Houston-The Woodlands-Sugar Land, TX
> Firms owned by Black residents: 3.6% (3,981)
> Black population share: 17.2% (1,200,811)
> Black median household income: $51,655 (vs. $69,328 for all races)
> Black homeownership rate: 42.2% (vs. 60.9% for all races)
[recirclink id=1055224]
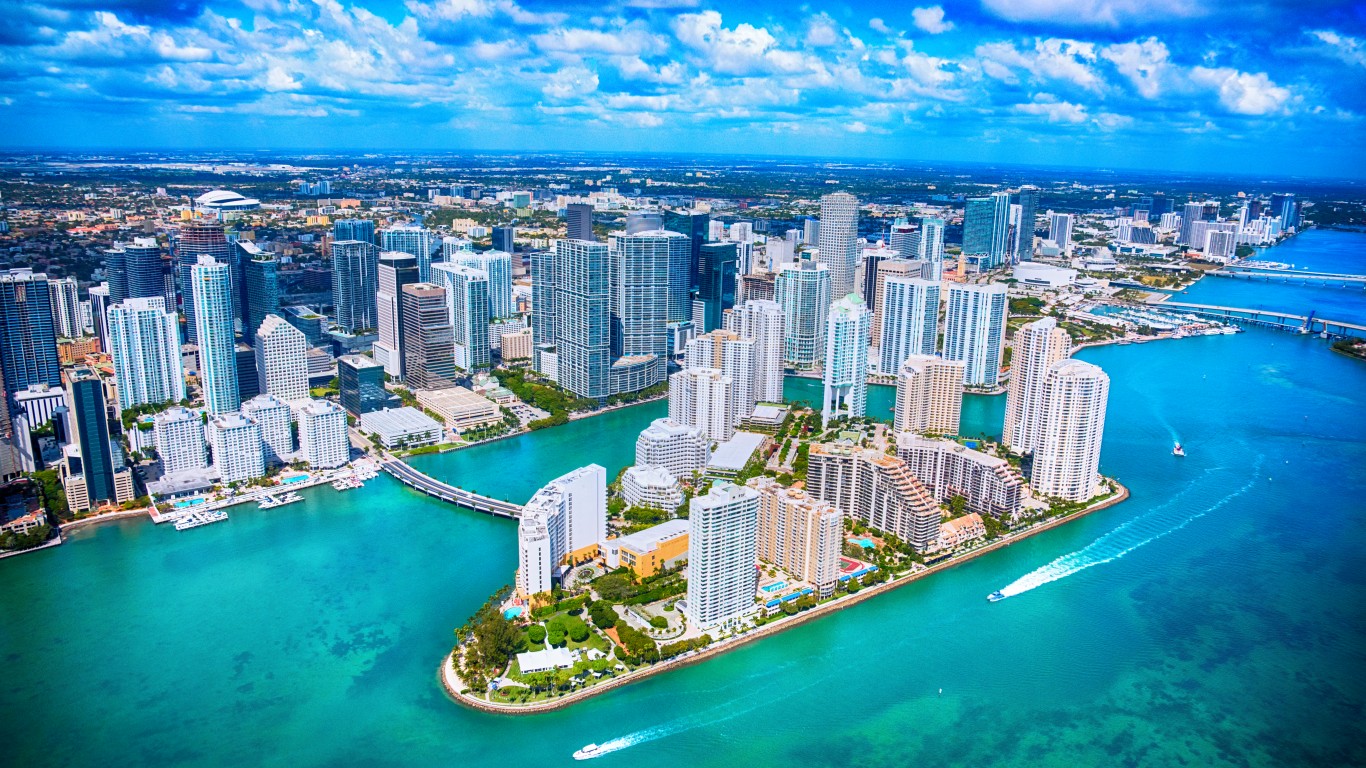
18. Miami-Fort Lauderdale-West Palm Beach, FL
> Firms owned by Black residents: 3.6% (6,204)
> Black population share: 21.0% (1,290,208)
> Black median household income: $46,154 (vs. $59,030 for all races)
> Black homeownership rate: 46.9% (vs. 59.8% for all races)
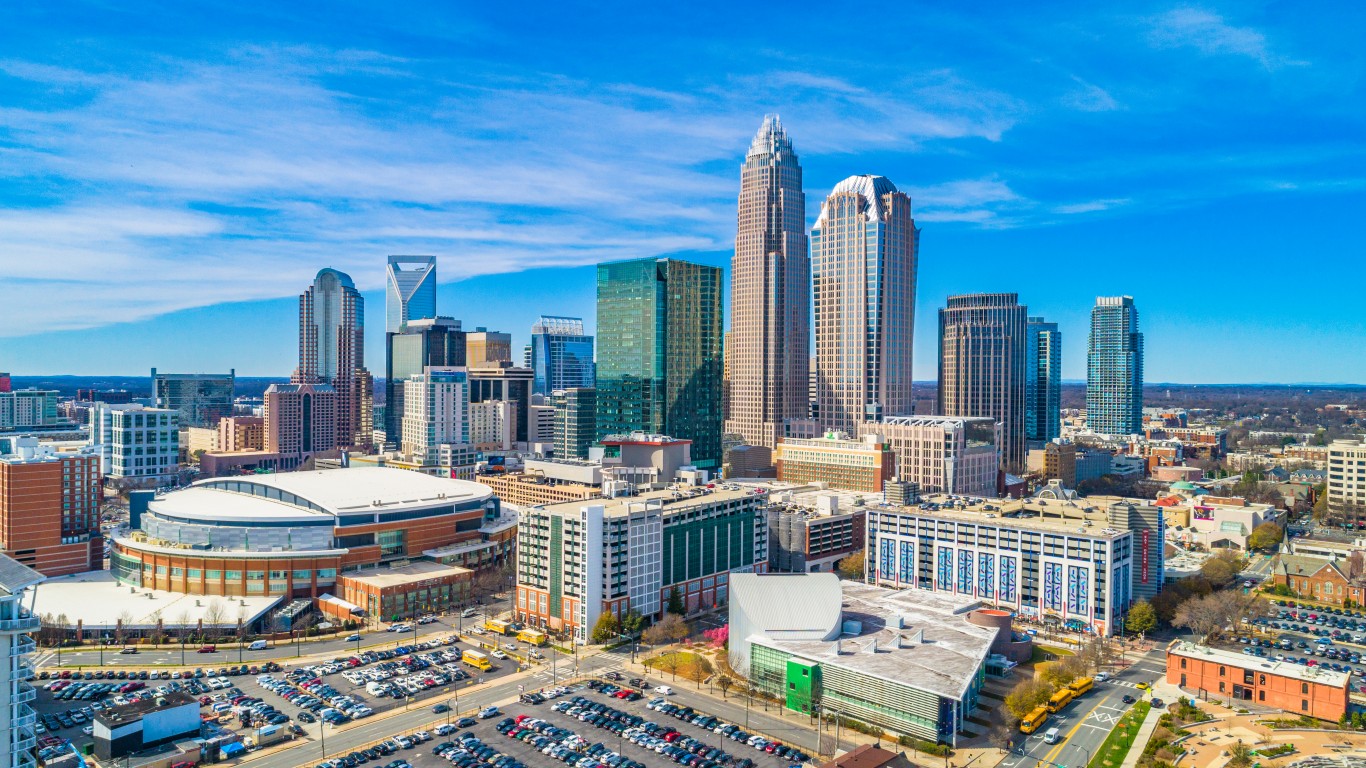
17. Charlotte-Concord-Gastonia, NC-SC
> Firms owned by Black residents: 3.8% (1,788)
> Black population share: 22.9% (594,146)
> Black median household income: $47,090 (vs. $65,725 for all races)
> Black homeownership rate: 45.9% (vs. 66.0% for all races)
[in-text-ad-2]

16. Orlando-Kissimmee-Sanford, FL
> Firms owned by Black residents: 3.8% (2,096)
> Black population share: 16.5% (421,719)
> Black median household income: $48,145 (vs. $61,229 for all races)
> Black homeownership rate: 46.7% (vs. 61.9% for all races)

15. Raleigh, NC
> Firms owned by Black residents: 3.9% (1,061)
> Black population share: 19.8% (269,510)
> Black median household income: $52,813 (vs. $78,706 for all races)
> Black homeownership rate: 45.7% (vs. 65.8% for all races)
[in-text-ad]
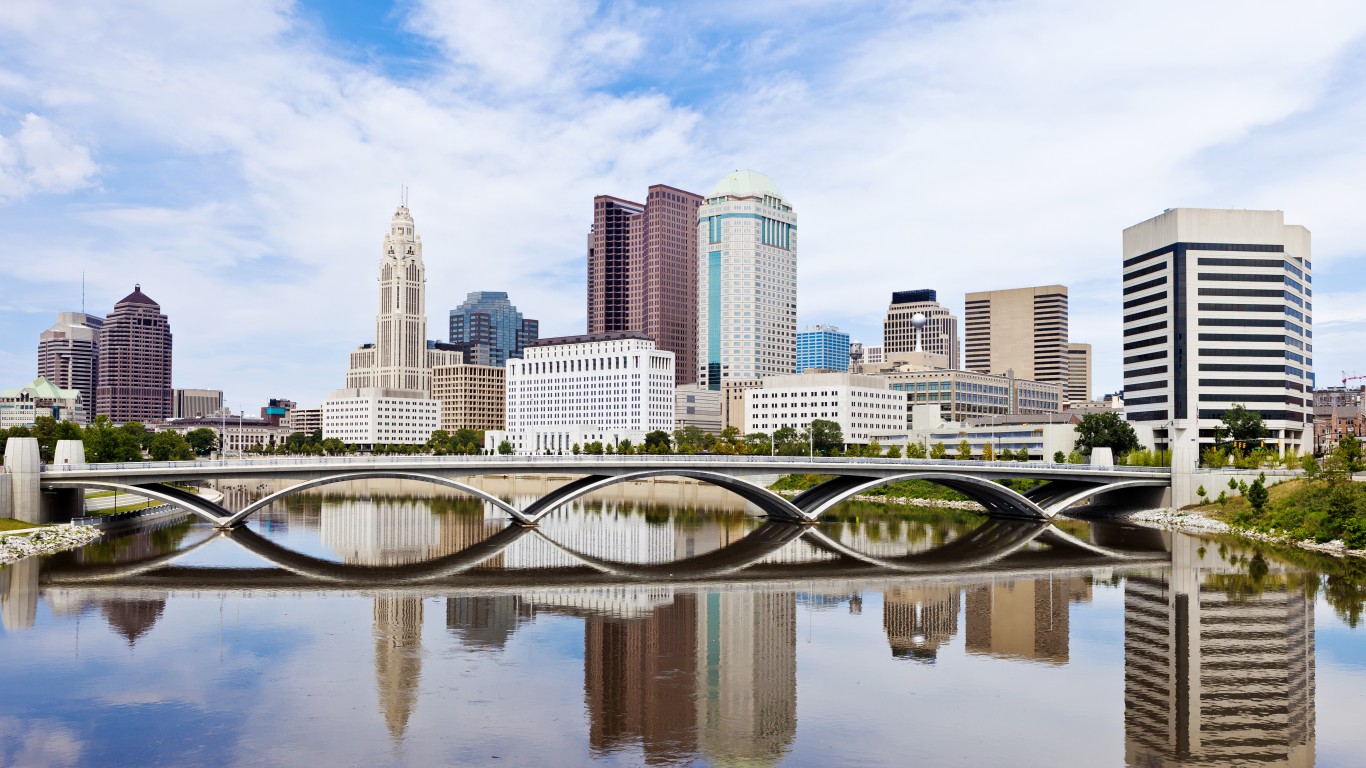
14. Columbus, OH
> Firms owned by Black residents: 4.1% (1,254)
> Black population share: 15.7% (329,697)
> Black median household income: $42,055 (vs. $66,715 for all races)
> Black homeownership rate: 34.8% (vs. 61.8% for all races)
[recirclink id=1053811]
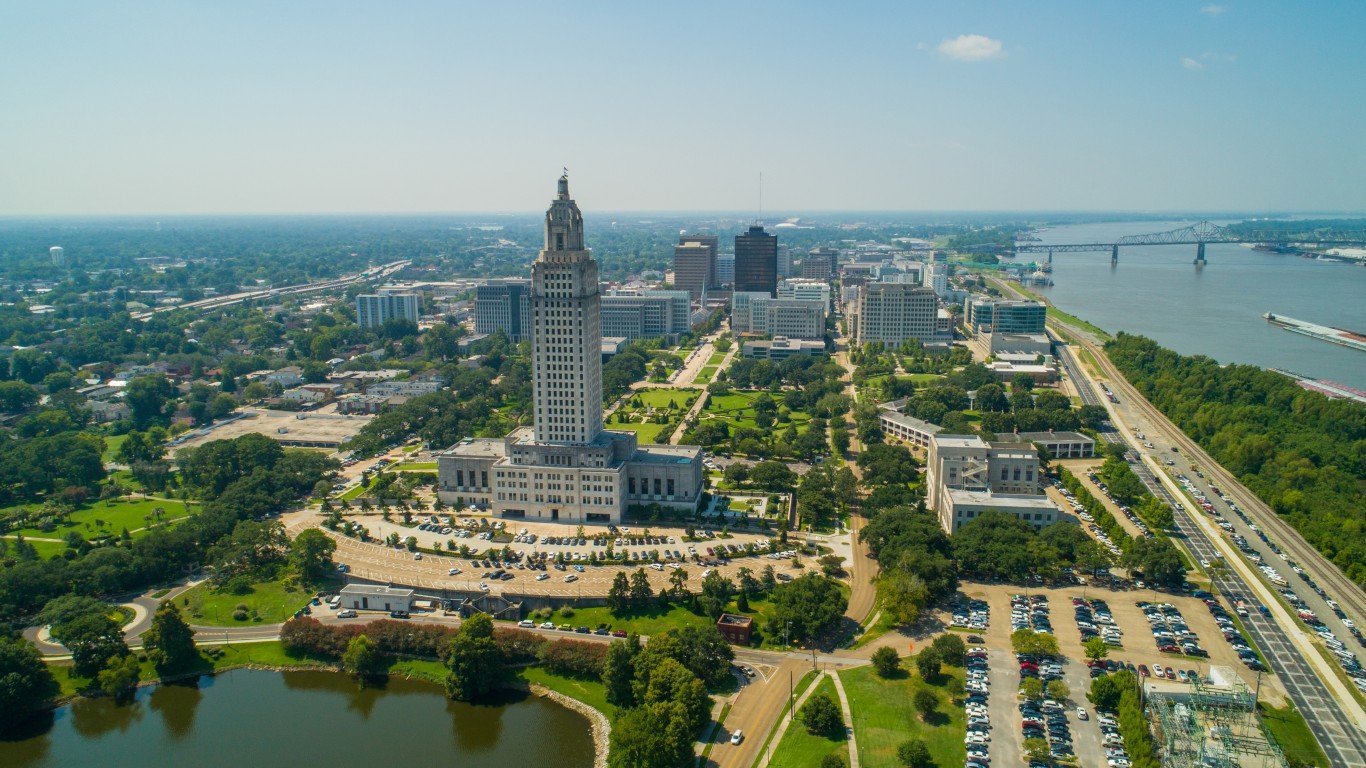
13. Baton Rouge, LA
> Firms owned by Black residents: 4.4% (616)
> Black population share: 35.1% (300,369)
> Black median household income: $40,478 (vs. $60,043 for all races)
> Black homeownership rate: 52.7% (vs. 69.7% for all races)
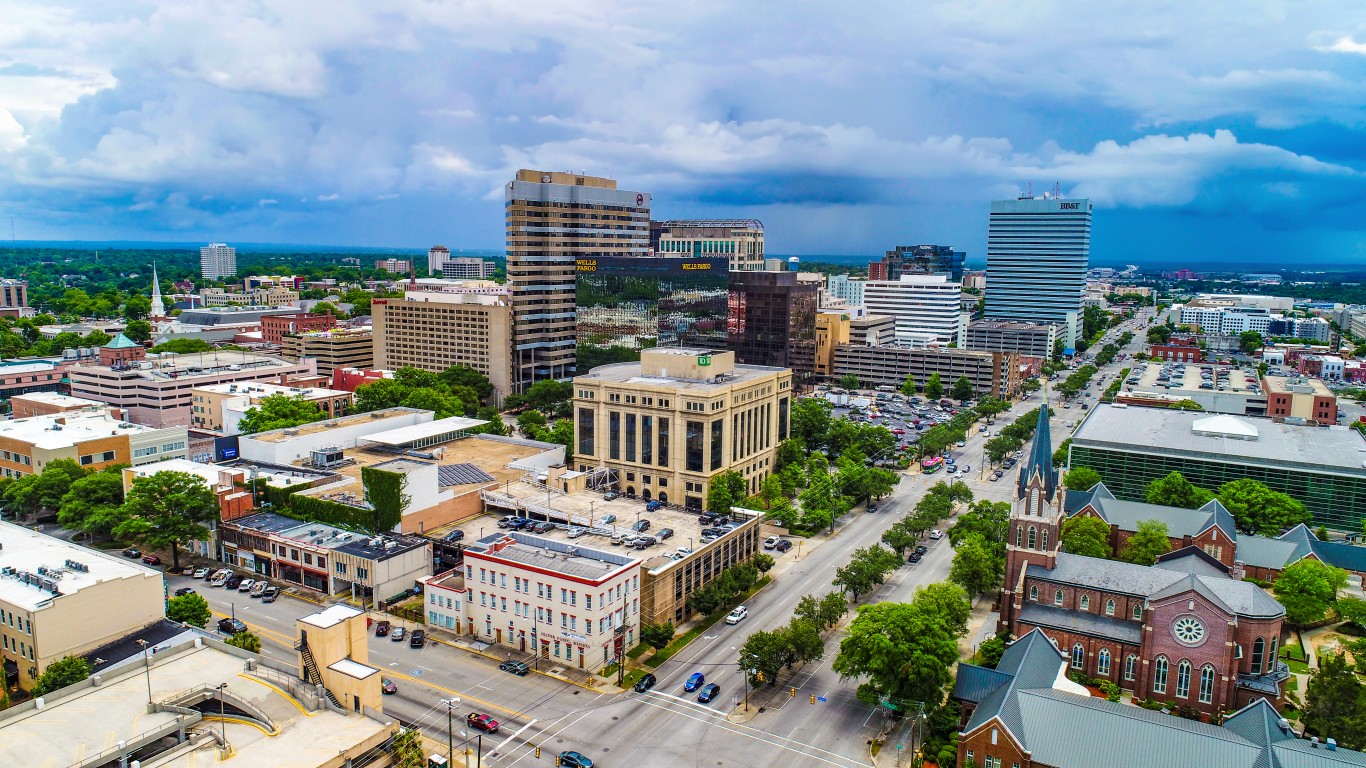
12. Columbia, SC
> Firms owned by Black residents: 4.5% (609)
> Black population share: 33.5% (279,363)
> Black median household income: $43,194 (vs. $56,680 for all races)
> Black homeownership rate: 53.4% (vs. 68.4% for all races)
[in-text-ad-2]
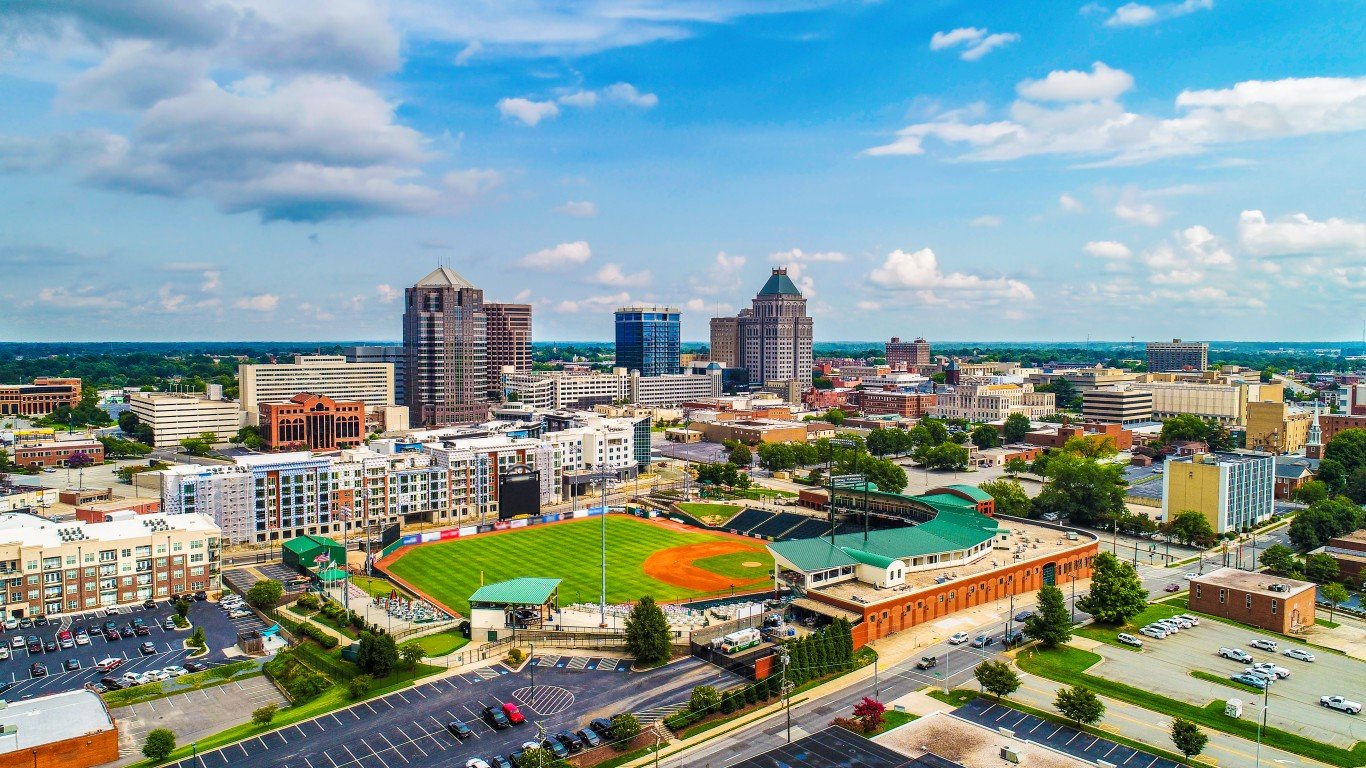
11. Greensboro-High Point, NC
> Firms owned by Black residents: 4.6% (643)
> Black population share: 27.1% (207,902)
> Black median household income: $39,490 (vs. $52,233 for all races)
> Black homeownership rate: 40.6% (vs. 63.0% for all races)

10. Virginia Beach-Norfolk-Newport News, VA-NC
> Firms owned by Black residents: 4.7% (1,260)
> Black population share: 30.3% (535,763)
> Black median household income: $49,399 (vs. $68,454 for all races)
> Black homeownership rate: 44.8% (vs. 62.3% for all races)
[in-text-ad]
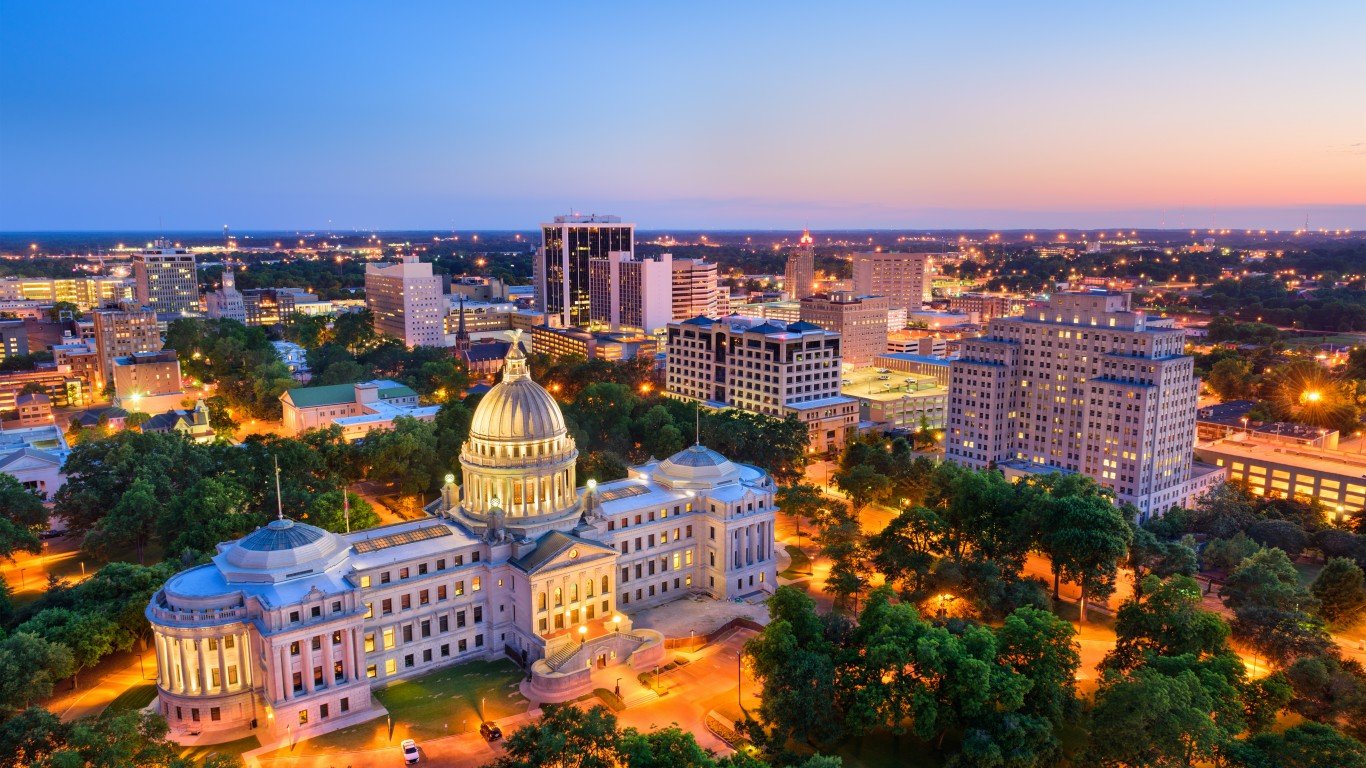
9. Jackson, MS
> Firms owned by Black residents: 5.0% (446)
> Black population share: 50.4% (300,440)
> Black median household income: $39,349 (vs. $53,639 for all races)
> Black homeownership rate: 53.6% (vs. 67.6% for all races)
[recirclink id=1050461]
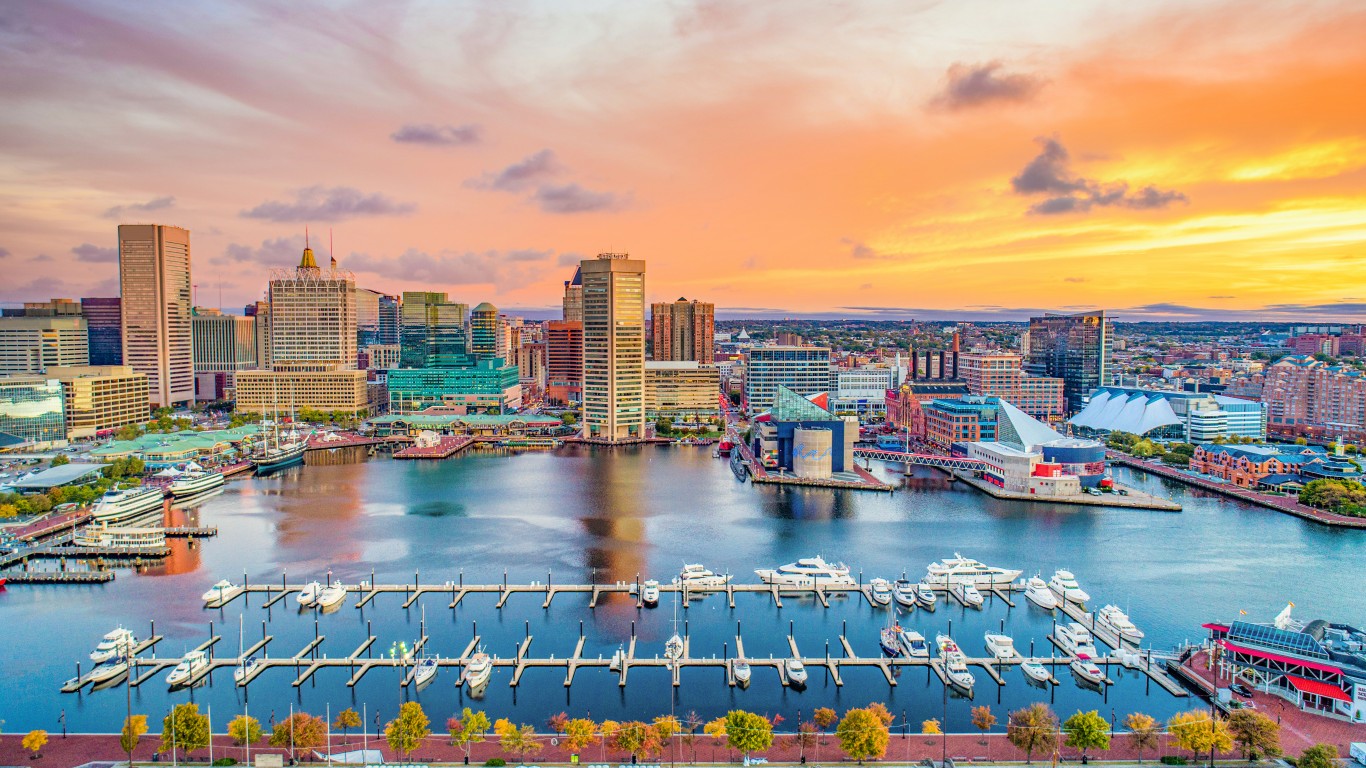
8. Baltimore-Columbia-Towson, MD
> Firms owned by Black residents: 5.4% (2,755)
> Black population share: 29.3% (820,436)
> Black median household income: $57,191 (vs. $83,811 for all races)
> Black homeownership rate: 46.6% (vs. 66.6% for all races)
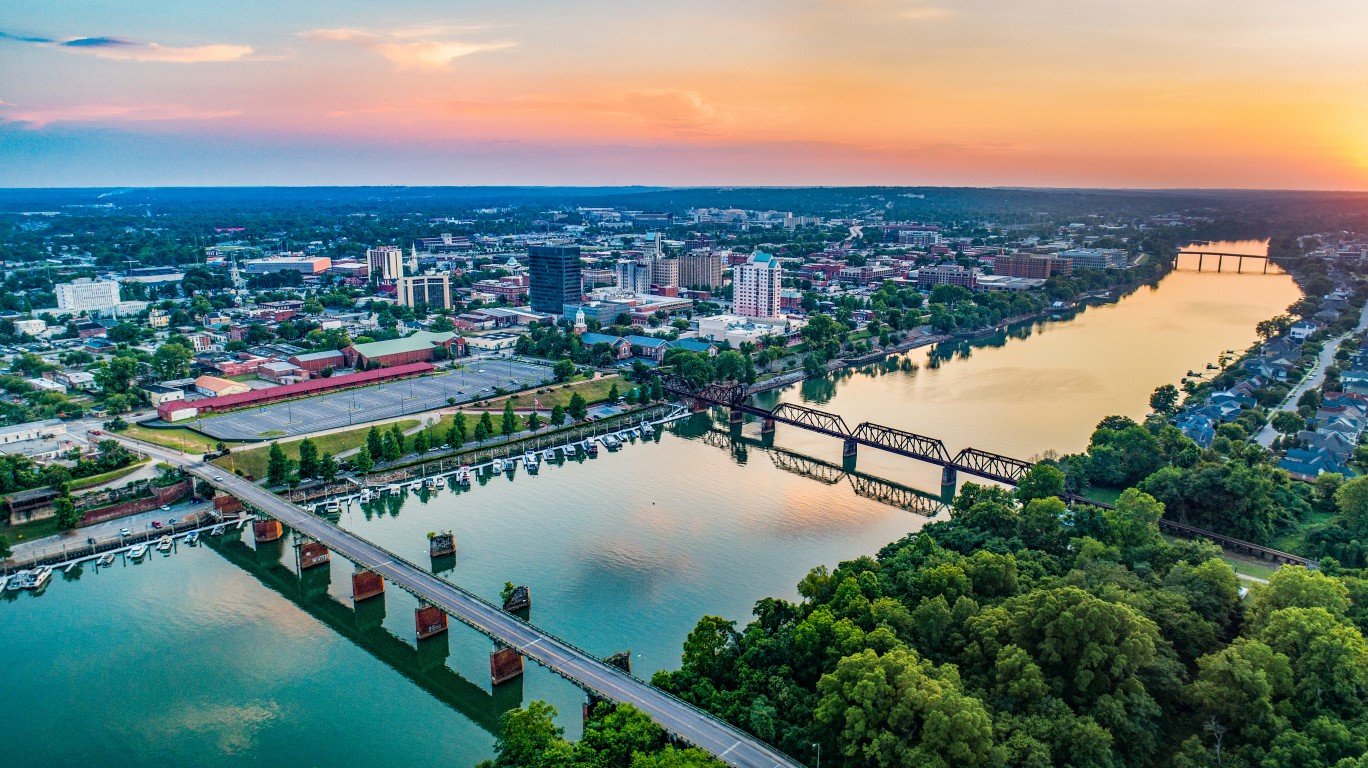
7. Augusta-Richmond County, GA-SC
> Firms owned by Black residents: 5.9% (480)
> Black population share: 35.3% (213,636)
> Black median household income: $40,529 (vs. $55,049 for all races)
> Black homeownership rate: 52.2% (vs. 67.5% for all races)
[in-text-ad-2]
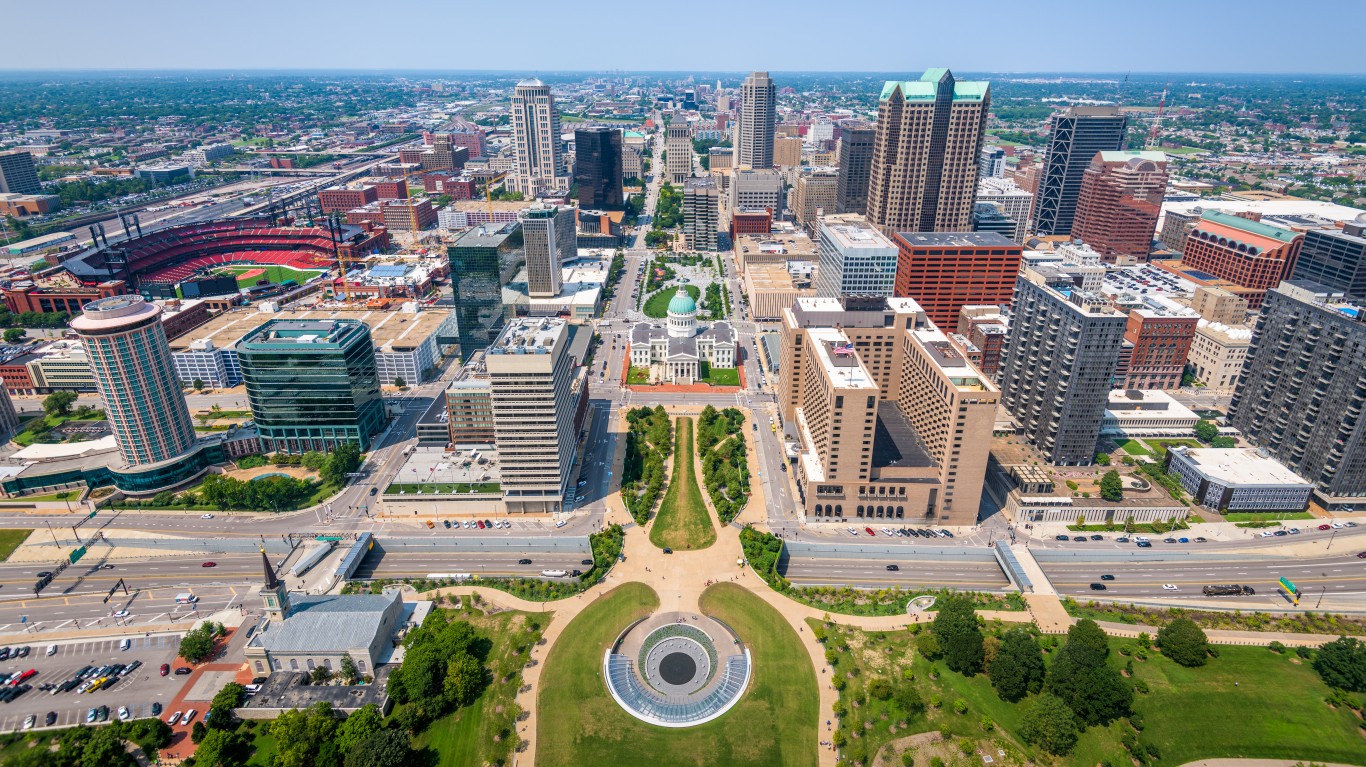
6. St. Louis, MO-IL
> Firms owned by Black residents: 6.0% (3,112)
> Black population share: 18.1% (507,368)
> Black median household income: $38,371 (vs. $65,725 for all races)
> Black homeownership rate: 39.9% (vs. 69.3% for all races)
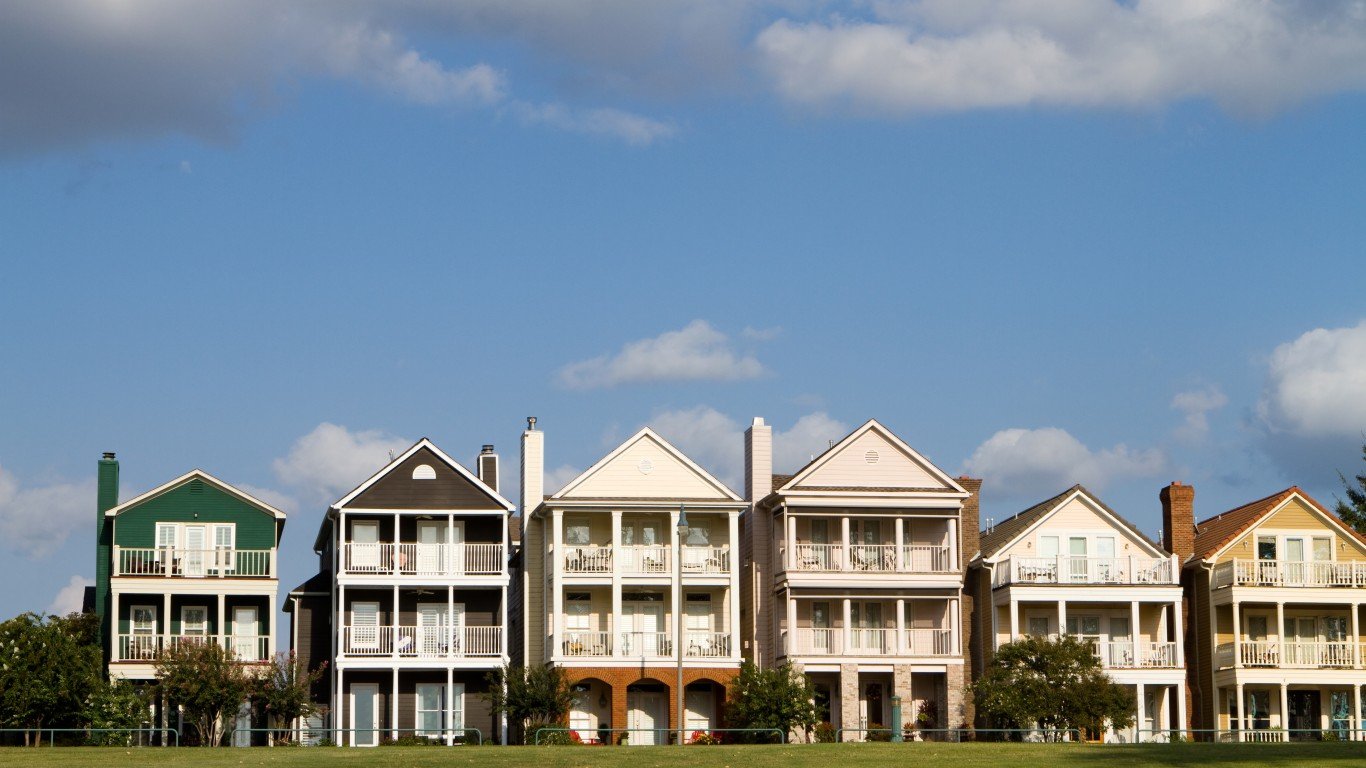
5. Memphis, TN-MS-AR
> Firms owned by Black residents: 6.6% (1,123)
> Black population share: 47.4% (636,293)
> Black median household income: $39,546 (vs. $53,896 for all races)
> Black homeownership rate: 45.0% (vs. 59.8% for all races)
[in-text-ad]
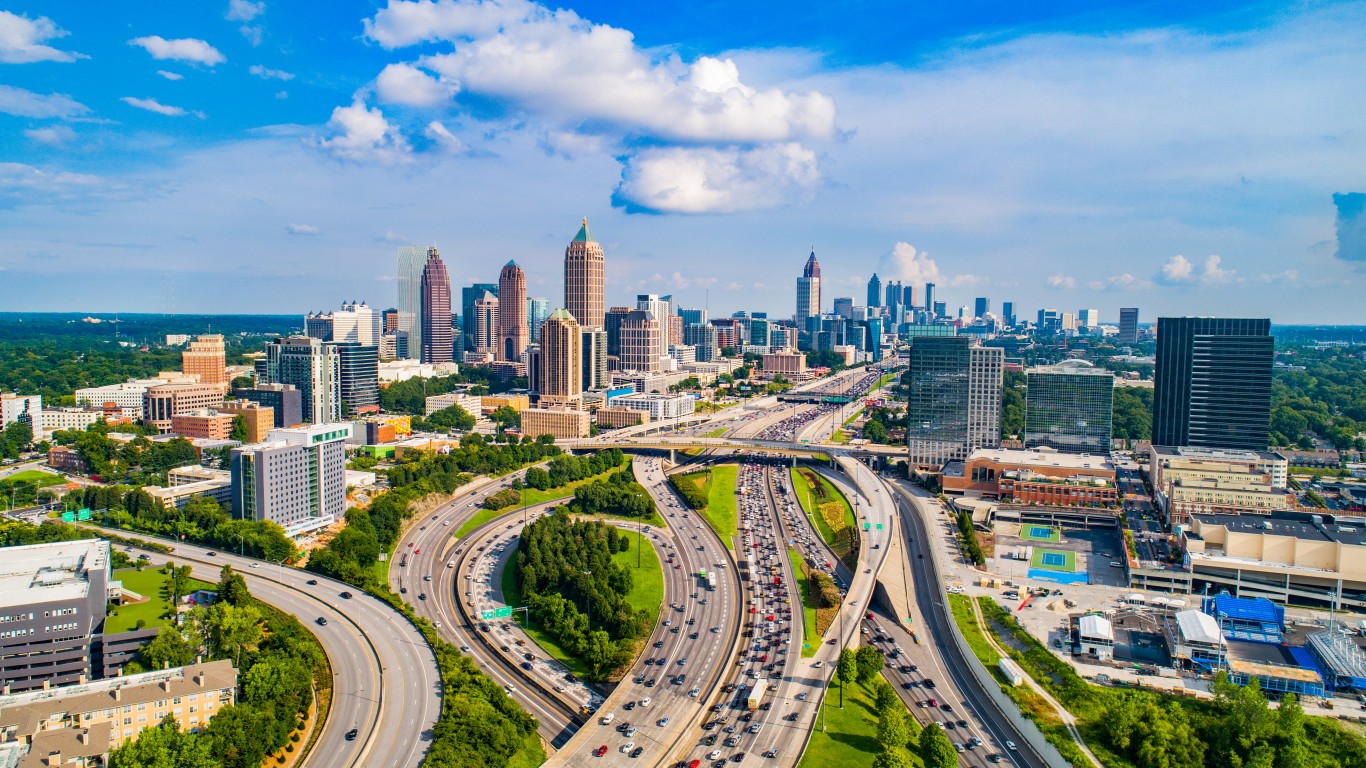
4. Atlanta-Sandy Springs-Roswell, GA
> Firms owned by Black residents: 6.7% (7,539)
> Black population share: 34.2% (2,033,158)
> Black median household income: $55,213 (vs. $71,193 for all races)
> Black homeownership rate: 48.8% (vs. 64.2% for all races)
[recirclink id=1108184]

3. Richmond, VA
> Firms owned by Black residents: 6.7% (1,721)
> Black population share: 29.4% (376,658)
> Black median household income: $49,712 (vs. $71,223 for all races)
> Black homeownership rate: 50.0% (vs. 66.6% for all races)
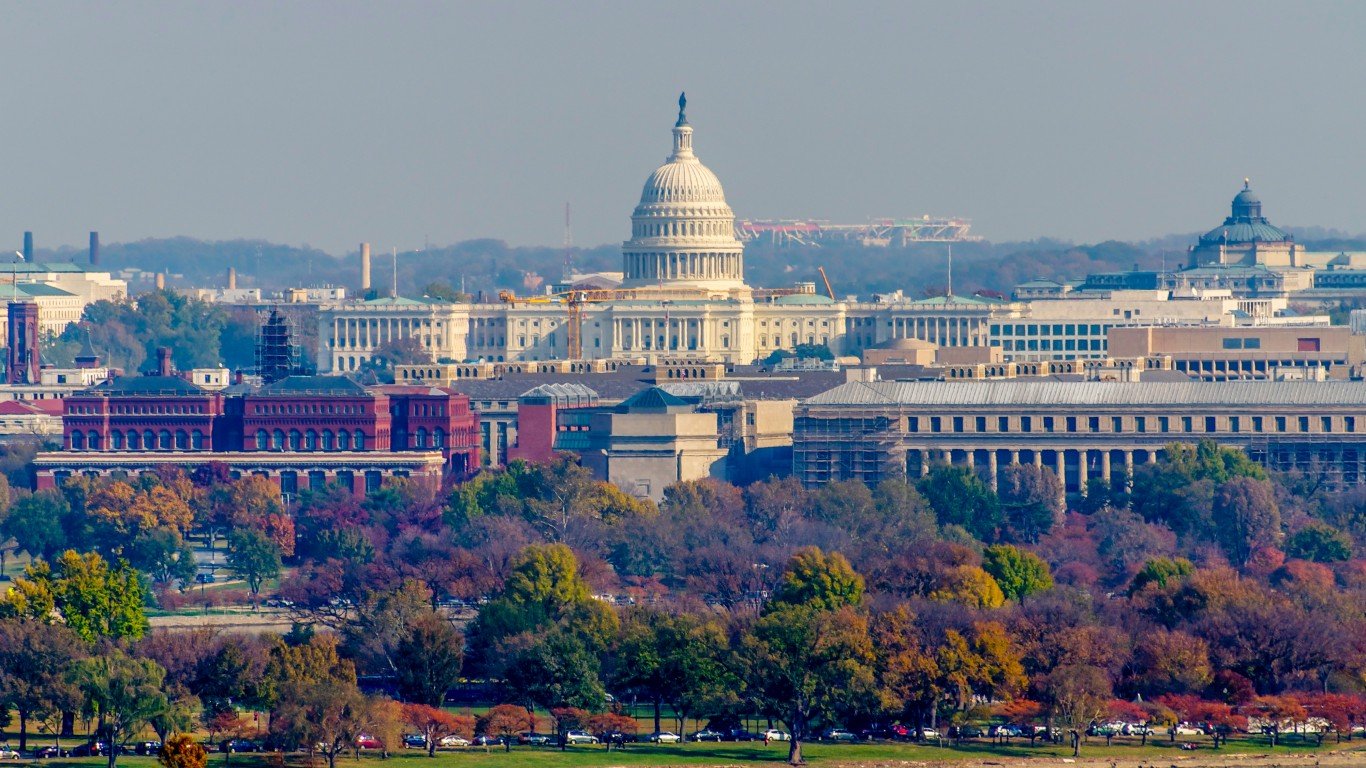
2. Washington-Arlington-Alexandria, DC-VA-MD-WV
> Firms owned by Black residents: 7.7% (8,649)
> Black population share: 25.2% (1,572,846)
> Black median household income: $78,646 (vs. $106,415 for all races)
> Black homeownership rate: 51.3% (vs. 63.9% for all races)
[in-text-ad-2]
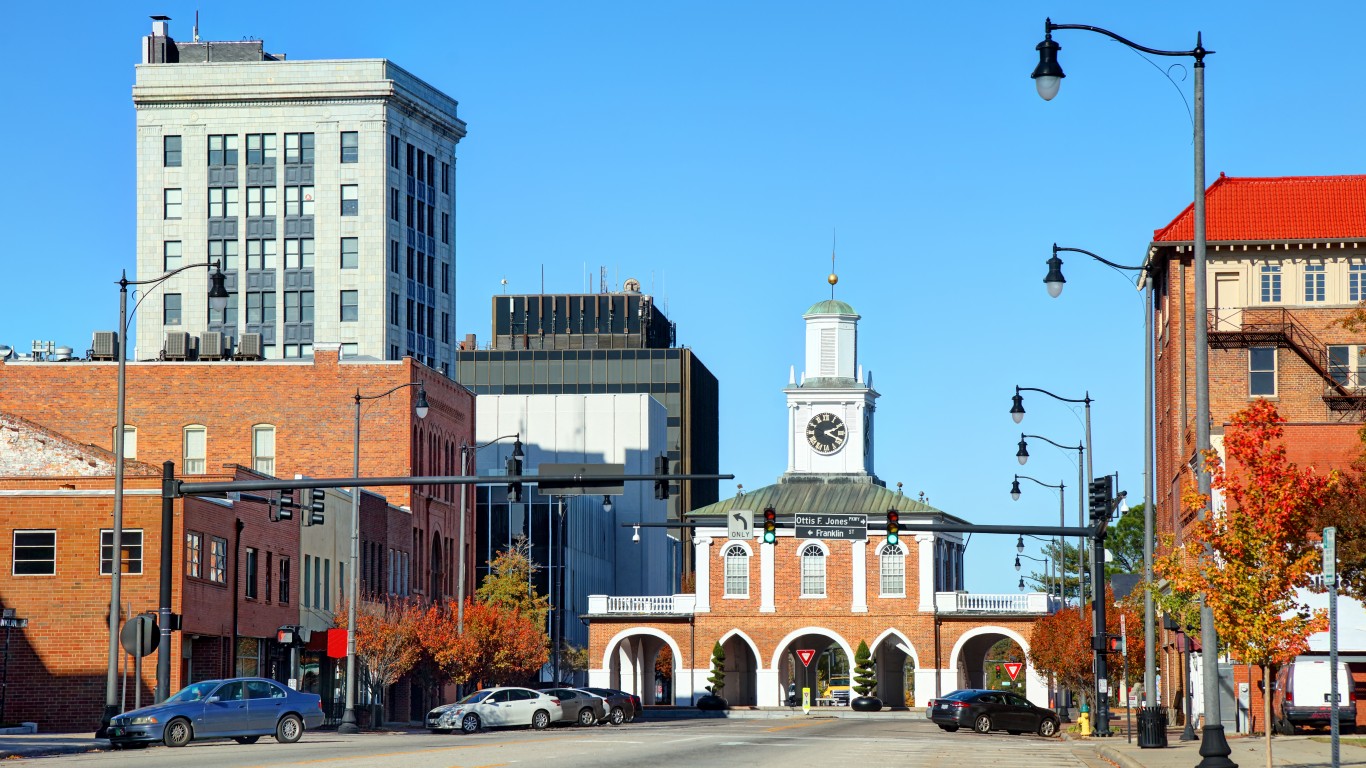
1. Fayetteville, NC
> Firms owned by Black residents: 11.2% (585)
> Black population share: 32.7% (170,989)
> Black median household income: $40,476 (vs. $50,133 for all races)
> Black homeownership rate: 46.7% (vs. 56.6% for all races)
Methodology
To determine the cities with the most Black-owned businesses, 24/7 Wall St. reviewed data on businesses with more than one employee from the U.S. Census Bureau’s 2020 Annual Business Survey. Metropolitan statistical areas were ranked based on the percentage of employer companies owned by individuals who identify as Black or African American.
Ownership is defined as having more than 50% of the stock or equity in the business. The percentage of residents identifying as Black or African Americans out of the total population was calculated using five-year data from the Census Bureau’s 2020 American Community Survey.
Data on median household income for Black or African American households and Black or African American homeownership rates also came from the 2020 ACS and are five-year estimates. All data includes all Black or African American respondents regardless of reported Hispanic or Latino ethnicity.
Contact [email protected] for any questions or corrections.