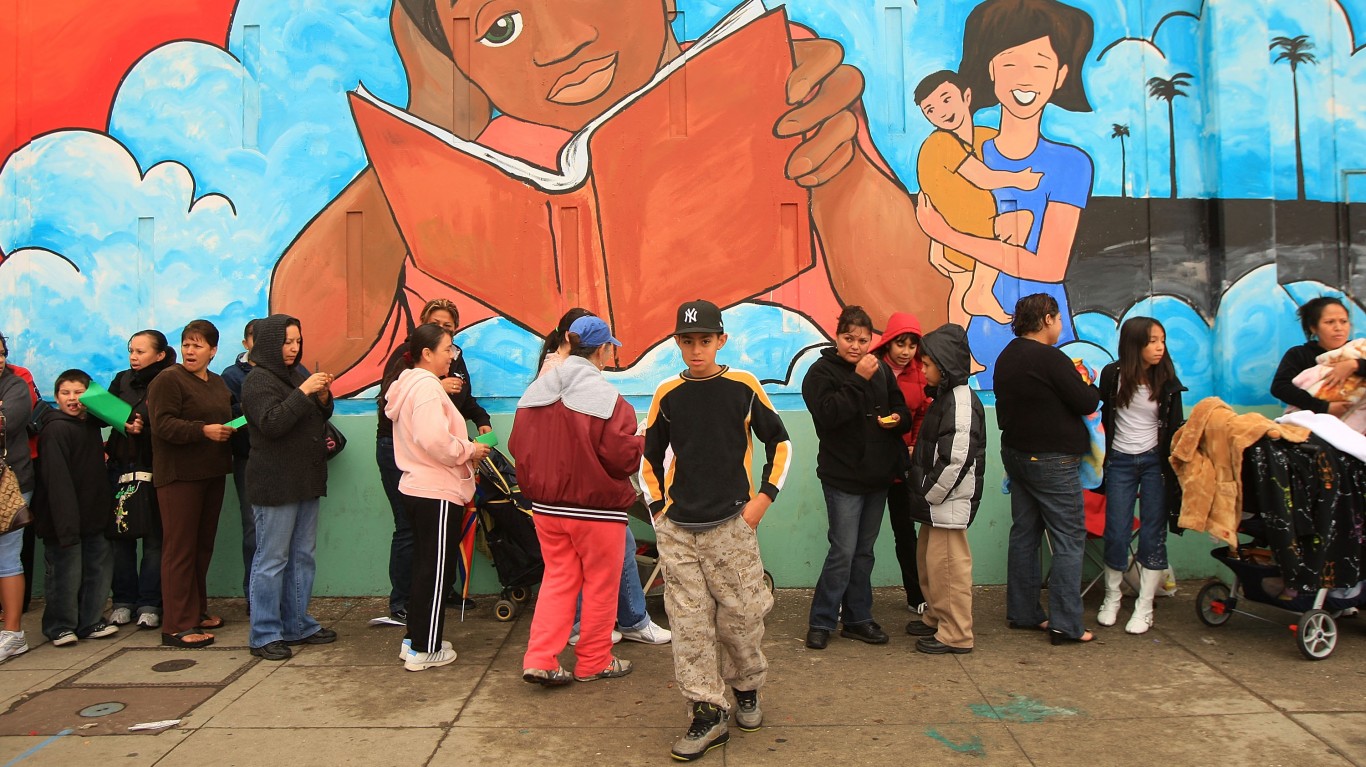
More than 40 million Americans live below the poverty line, and of those facing such financial hardship, children are disproportionately affected. Nearly 12.6 million children under age 18 live in households with poverty level income.
Not only are children at higher risk of poverty, they are also especially vulnerable to poverty’s harmful effects, both in the immediate and long-term. Childhood poverty can negatively impact brain development and has been linked with a greater likelihood of chronic illness, shorter life expectancy, and poor emotional and behavioral health. Those who spend some or all of their childhood in poverty are also less likely to succeed in school or be financially secure later in life.
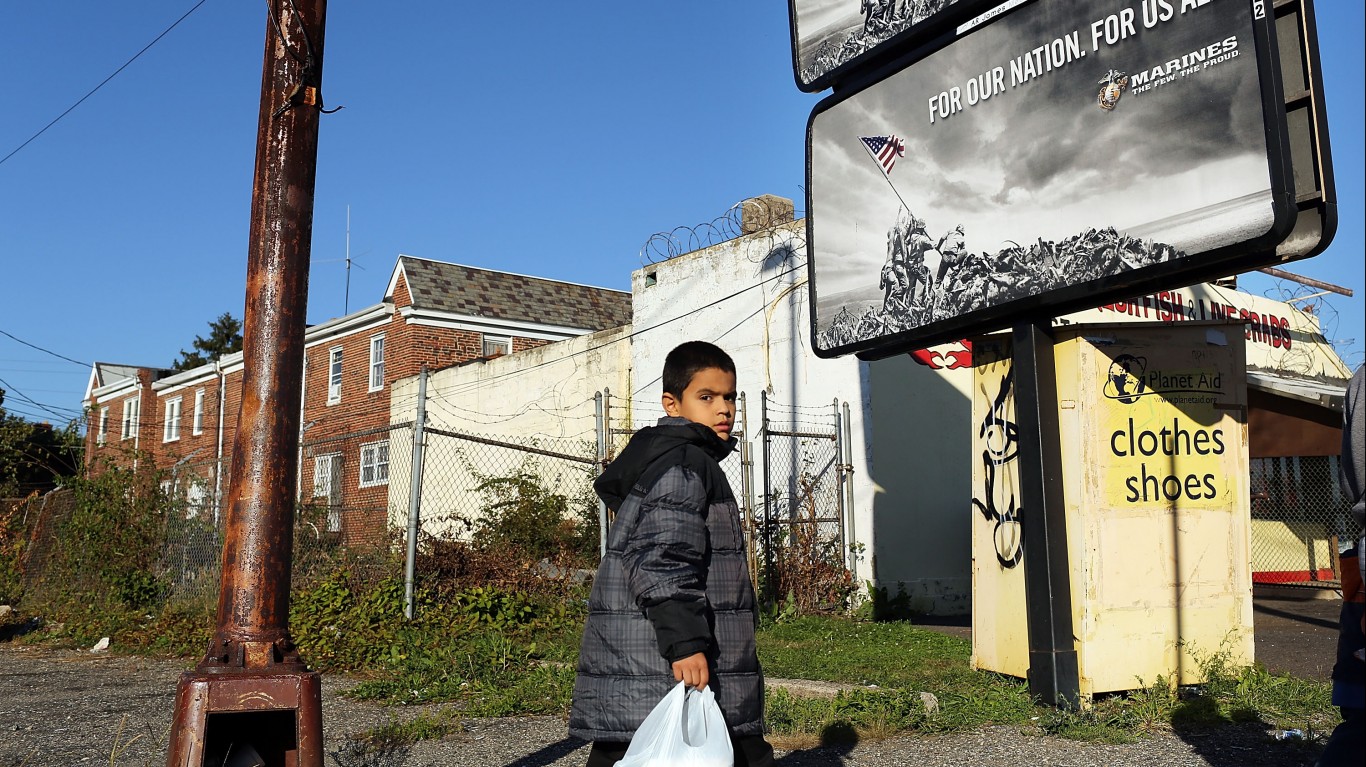
Nationwide, an estimated 17.5% of children under age 18 live below the poverty line. And though the United States has one of the worst child poverty rates among wealthy, developed countries, in parts of the U.S., child poverty is nearly non-existent.
Using data from the U.S. Census Bureau, 24/7 Wall St. identified the 50 U.S. cities – defined as places with populations of at least 25,000 – with the lowest child poverty rates.
In every city on this list, less than 3% of children live below the poverty line. The places on this list span the country, though nine are located in California, the most of any state. Here is a look at the income a family needs to cover normal living expenses in every state.
Not only is serious financial hardship less common in these places than in much of the country, but families also tend to be relatively well off. In each of the 50 cities on the list, the median income among households with children is over $100,000, exceeding the comparable national median of $77,445. Here is a look at the richest town in every state.
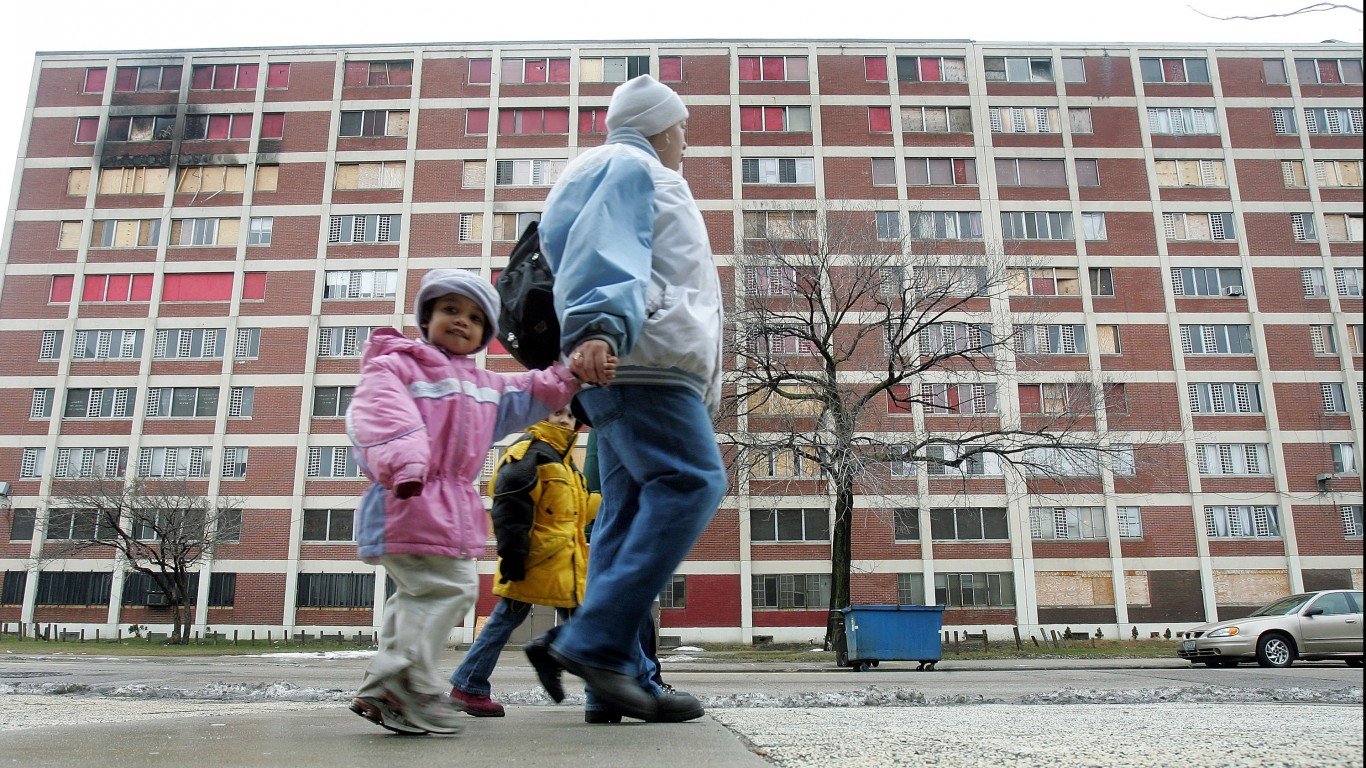
Households with two parents are more likely to be financially secure than those headed by a single parent. Single-mother households are especially vulnerable to financial insecurity, and in nearly every city on this list, the share of households with children headed by a single mother is below the 11.7% national share.
Click here to see cities with the lowest child poverty rates
Click here to read our detailed methodology
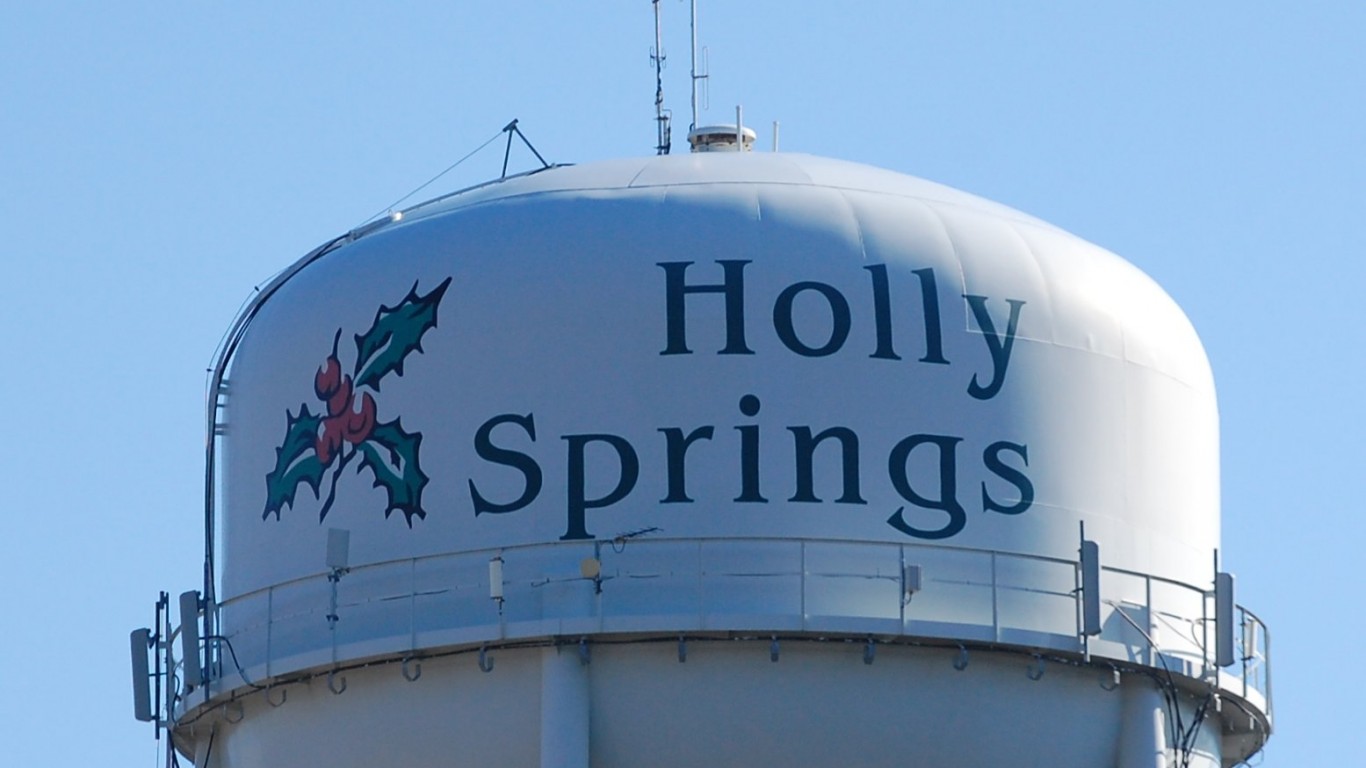
50. Holly Springs, North Carolina
> Child poverty rate: 2.7%
> Median family income, households with children: $125,955 — 244th highest of 1,720 cities
> Share of households with children receiving SNAP benefits: 3.5% — 132nd lowest of 1,720 cities
> Households headed by single mothers: 7.9% — 362nd lowest of 1,720 cities
[in-text-ad]
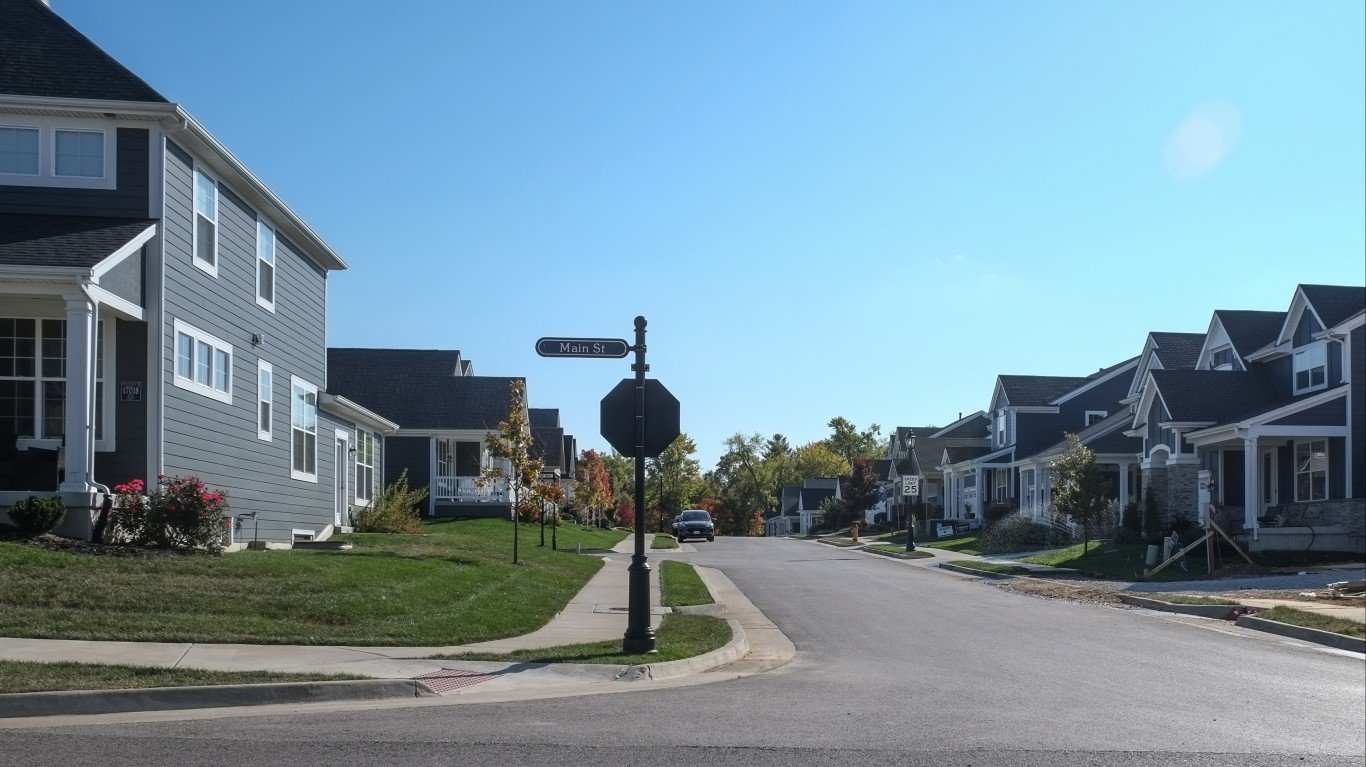
49. Wildwood, Missouri
> Child poverty rate: 2.7%
> Median family income, households with children: $161,906 — 84th highest of 1,720 cities
> Share of households with children receiving SNAP benefits: 0.7% — 15th lowest of 1,720 cities
> Households headed by single mothers: 4.0% — 37th lowest of 1,720 cities
[recirclink id=1106510]

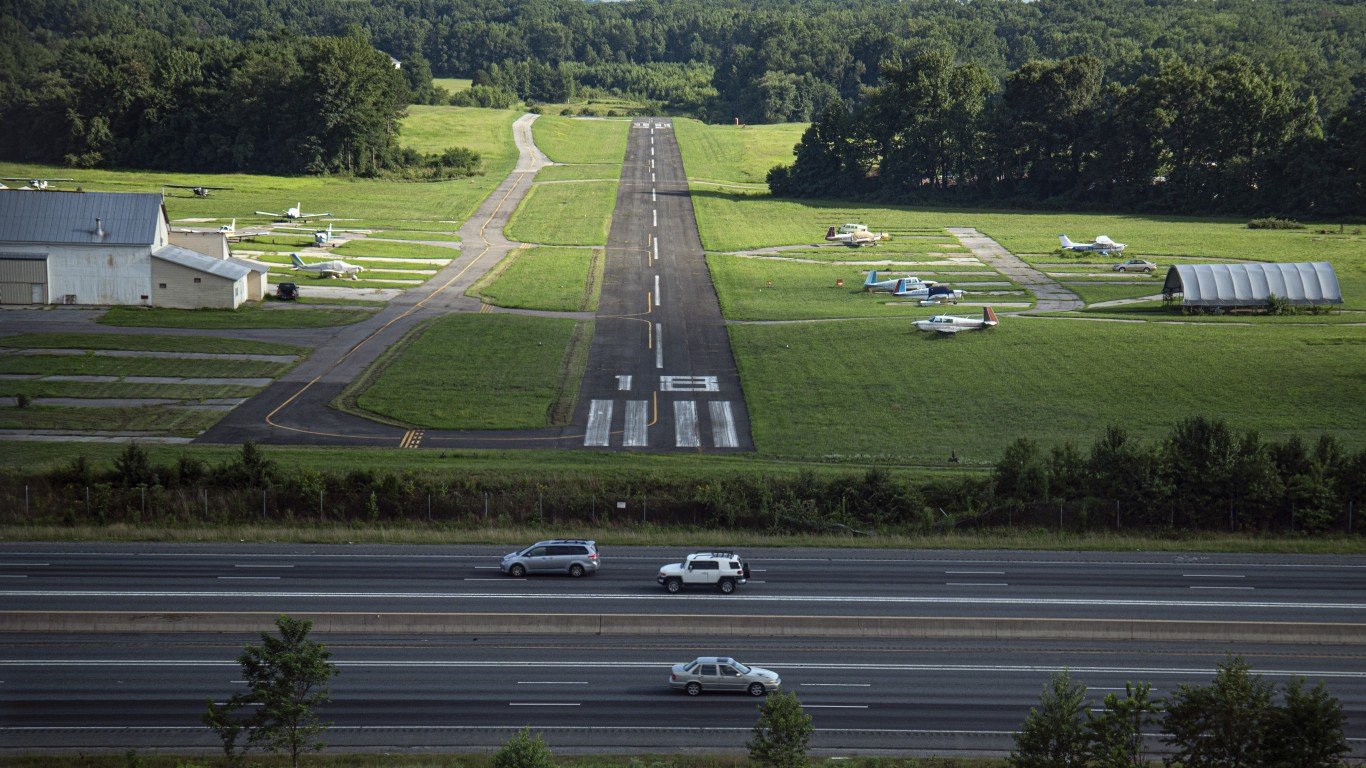
48. Palm Beach Gardens, Florida
> Child poverty rate: 2.7%
> Median family income, households with children: $119,207 — 293rd highest of 1,720 cities
> Share of households with children receiving SNAP benefits: 3.7% — 148th lowest of 1,720 cities
> Households headed by single mothers: 6.3% — 177th lowest of 1,720 cities

47. Northbrook, Illinois
> Child poverty rate: 2.7%
> Median family income, households with children: $214,179 — 26th highest of 1,720 cities
> Share of households with children receiving SNAP benefits: 0.0% reported — the lowest of 1,720 cities (tied)
> Households headed by single mothers: 4.0% — 40th lowest of 1,720 cities
[in-text-ad-2]

46. Chanhassen, Minnesota
> Child poverty rate: 2.6%
> Median family income, households with children: $174,775 — 58th highest of 1,720 cities
> Share of households with children receiving SNAP benefits: 1.4% — 38th lowest of 1,720 cities
> Households headed by single mothers: 6.4% — 191st lowest of 1,720 cities

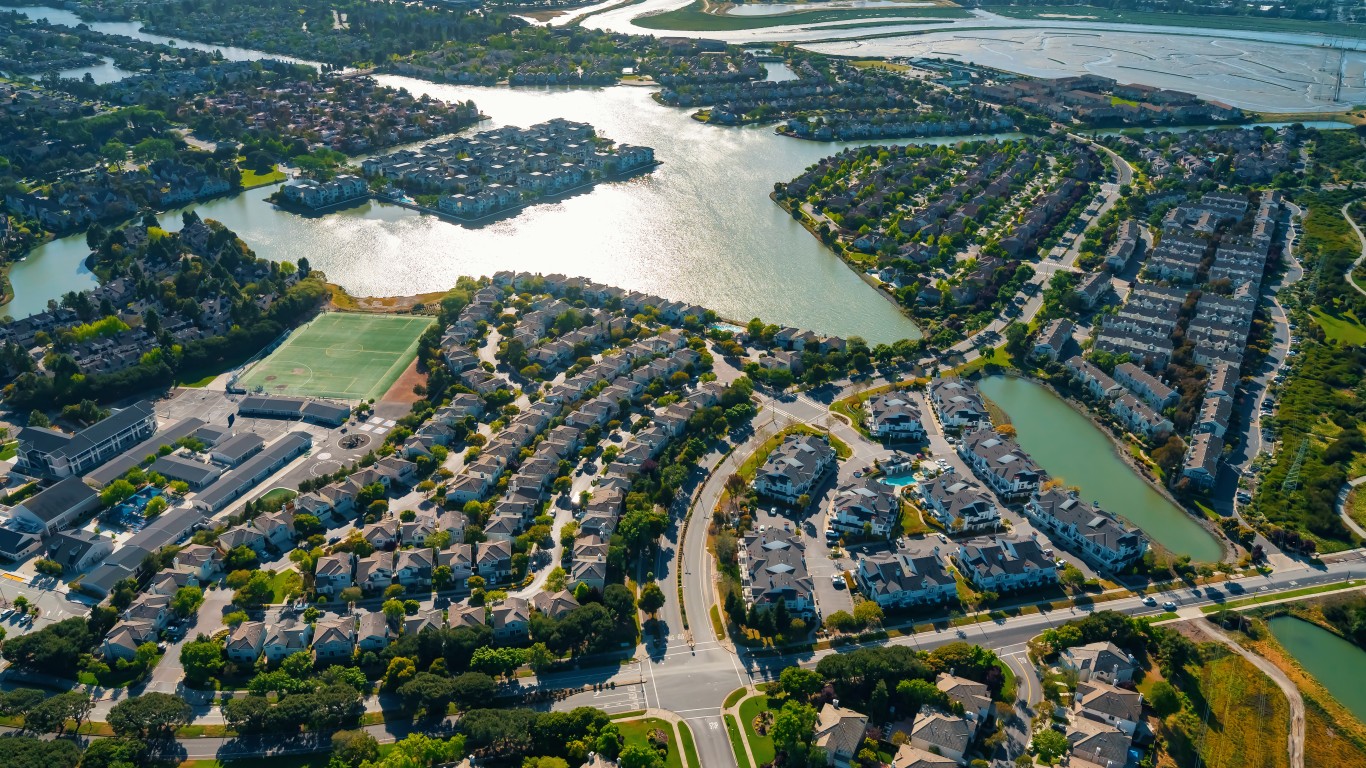
45. Culver City, California
> Child poverty rate: 2.6%
> Median family income, households with children: $147,306 — 132nd highest of 1,720 cities
> Share of households with children receiving SNAP benefits: 3.0% — 95th lowest of 1,720 cities
> Households headed by single mothers: 7.9% — 364th lowest of 1,720 cities
[in-text-ad]
44. Bowie, Maryland
> Child poverty rate: 2.6%
> Median family income, households with children: $133,159 — 196th highest of 1,720 cities
> Share of households with children receiving SNAP benefits: 7.4% — 343rd lowest of 1,720 cities
> Households headed by single mothers: 10.5% — 669th lowest of 1,720 cities
[recirclink id=1047662]

43. Manhattan Beach, California
> Child poverty rate: 2.6%
> Median family income, households with children: $245,521 — 18th highest of 1,720 cities
> Share of households with children receiving SNAP benefits: 0.6% — 12th lowest of 1,720 cities
> Households headed by single mothers: 4.5% — 58th lowest of 1,720 cities

42. Parker, Colorado
> Child poverty rate: 2.6%
> Median family income, households with children: $137,453 — 175th highest of 1,720 cities
> Share of households with children receiving SNAP benefits: 2.6% — 79th lowest of 1,720 cities
> Households headed by single mothers: 6.0% — 150th lowest of 1,720 cities
[in-text-ad-2]

41. Centennial, Colorado
> Child poverty rate: 2.5%
> Median family income, households with children: $131,296 — 207th highest of 1,720 cities
> Share of households with children receiving SNAP benefits: 2.2% — 62nd lowest of 1,720 cities
> Households headed by single mothers: 7.2% — 286th lowest of 1,720 cities

40. Lexington, Massachusetts
> Child poverty rate: 2.5%
> Median family income, households with children: $250,000+ — the highest of 1,720 cities (tied)
> Share of households with children receiving SNAP benefits: 0.8% — 20th lowest of 1,720 cities
> Households headed by single mothers: 3.6% — 25th lowest of 1,720 cities
[in-text-ad]
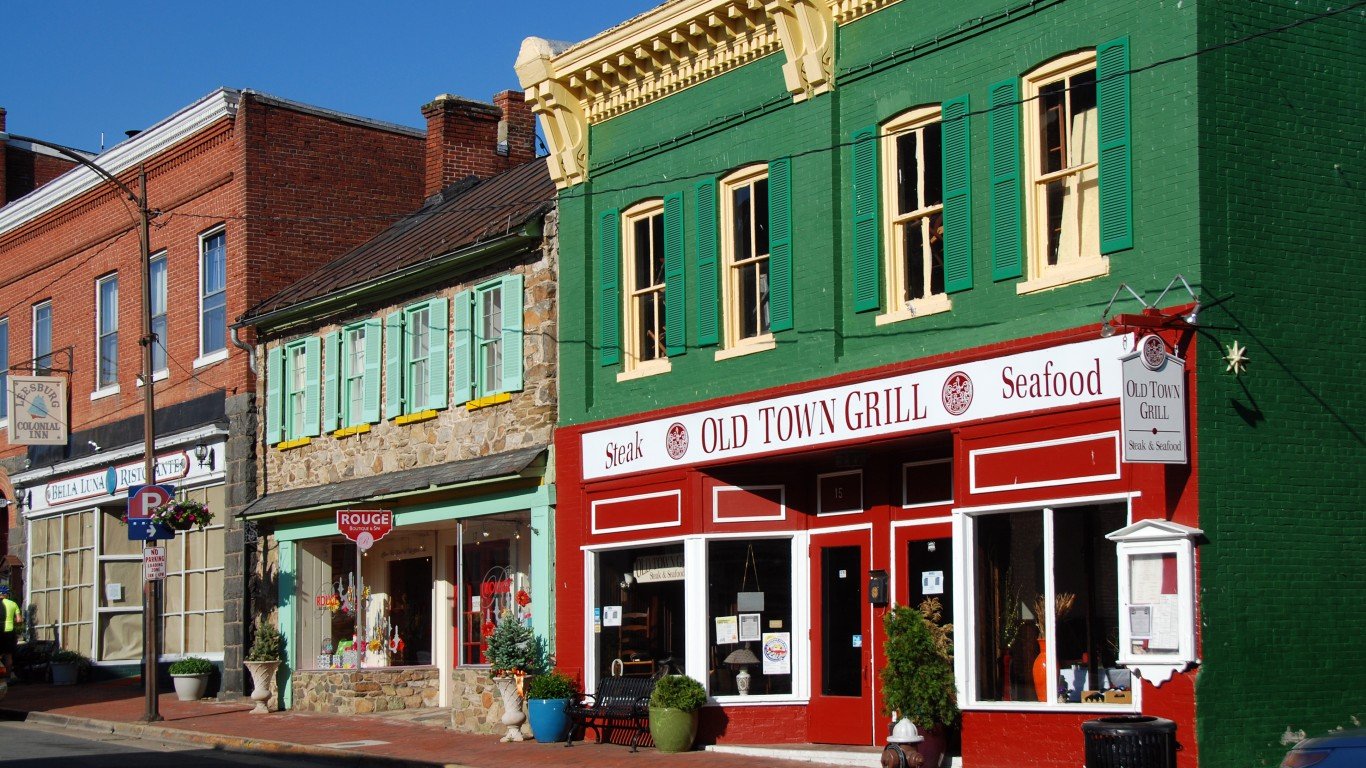
39. Leesburg, Virginia
> Child poverty rate: 2.5%
> Median family income, households with children: $131,854 — 201st highest of 1,720 cities
> Share of households with children receiving SNAP benefits: 4.8% — 212th lowest of 1,720 cities
> Households headed by single mothers: 7.9% — 363rd lowest of 1,720 cities
[recirclink id=1092222]

38. Menlo Park, California
> Child poverty rate: 2.5%
> Median family income, households with children: $250,000+ — the highest of 1,720 cities (tied)
> Share of households with children receiving SNAP benefits: 3.8% — 152nd lowest of 1,720 cities
> Households headed by single mothers: 6.7% — 226th lowest of 1,720 cities
37. Foster City, California
> Child poverty rate: 2.5%
> Median family income, households with children: $201,929 — 30th highest of 1,720 cities
> Share of households with children receiving SNAP benefits: 1.1% — 28th lowest of 1,720 cities
> Households headed by single mothers: 5.7% — 127th lowest of 1,720 cities
[in-text-ad-2]
36. Plainfield, Illinois
> Child poverty rate: 2.5%
> Median family income, households with children: $143,923 — 139th highest of 1,720 cities
> Share of households with children receiving SNAP benefits: 2.9% — 94th lowest of 1,720 cities
> Households headed by single mothers: 6.9% — 259th lowest of 1,720 cities
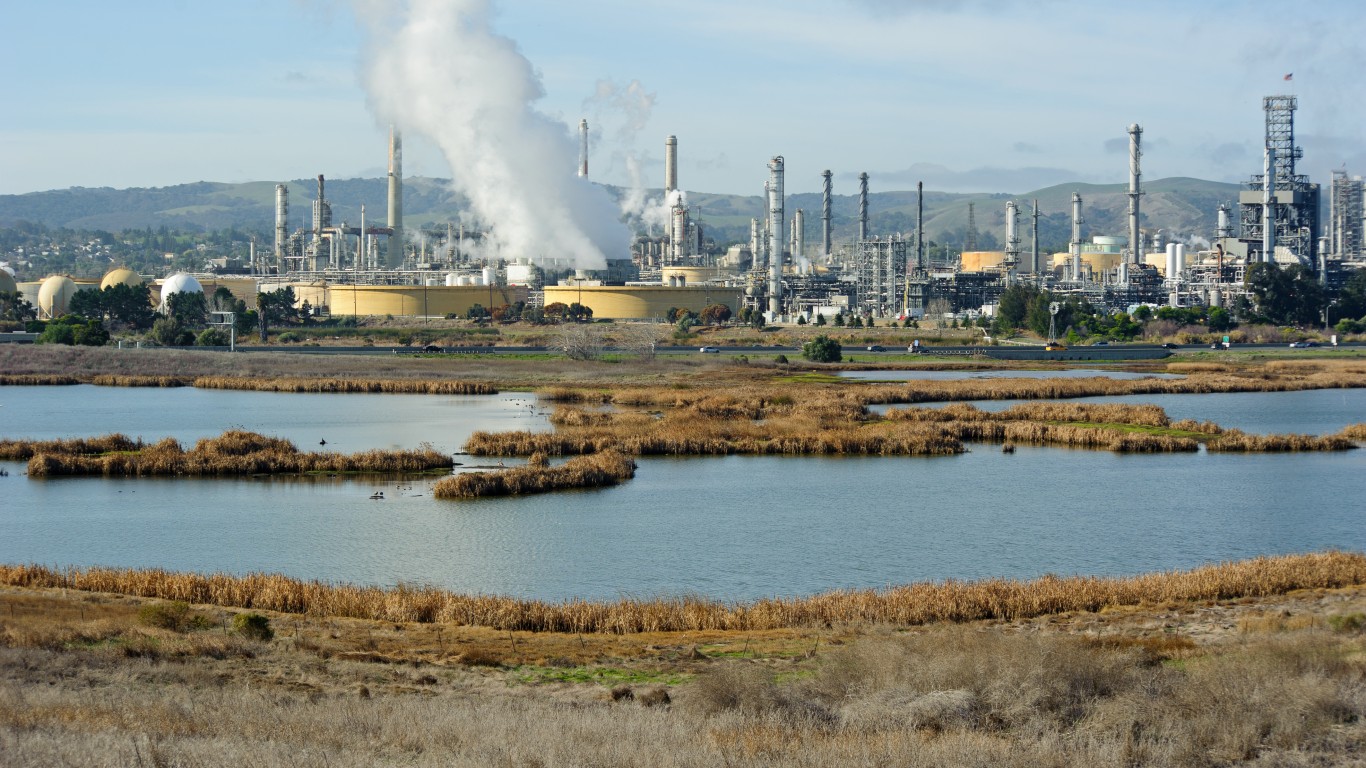
35. Martinez, California
> Child poverty rate: 2.5%
> Median family income, households with children: $141,012 — 156th highest of 1,720 cities
> Share of households with children receiving SNAP benefits: 3.3% — 119th lowest of 1,720 cities
> Households headed by single mothers: 8.9% — 476th lowest of 1,720 cities
[in-text-ad]

34. Dakota Ridge, Colorado
> Child poverty rate: 2.5%
> Median family income, households with children: $114,396 — 322nd highest of 1,720 cities
> Share of households with children receiving SNAP benefits: 3.1% — 106th lowest of 1,720 cities
> Households headed by single mothers: 5.2% — 92nd lowest of 1,720 cities
[recirclink id=1097516]

33. Los Altos, California
> Child poverty rate: 2.4%
> Median family income, households with children: $250,000+ — the highest of 1,720 cities (tied)
> Share of households with children receiving SNAP benefits: 0.8% — 19th lowest of 1,720 cities
> Households headed by single mothers: 3.3% — 15th lowest of 1,720 cities
32. Zionsville, Indiana
> Child poverty rate: 2.4%
> Median family income, households with children: $178,015 — 51st highest of 1,720 cities
> Share of households with children receiving SNAP benefits: 1.8% — 52nd lowest of 1,720 cities
> Households headed by single mothers: 3.5% — 23rd lowest of 1,720 cities
[in-text-ad-2]
31. Hercules, California
> Child poverty rate: 2.4%
> Median family income, households with children: $127,589 — 228th highest of 1,720 cities
> Share of households with children receiving SNAP benefits: 9.6% — 470th lowest of 1,720 cities
> Households headed by single mothers: 12.2% — 846th highest of 1,720 cities

30. Coppell, Texas
> Child poverty rate: 2.3%
> Median family income, households with children: $147,460 — 131st highest of 1,720 cities
> Share of households with children receiving SNAP benefits: 1.9% — 54th lowest of 1,720 cities
> Households headed by single mothers: 8.6% — 440th lowest of 1,720 cities
[in-text-ad]

29. Shoreview, Minnesota
> Child poverty rate: 2.3%
> Median family income, households with children: $155,544 — 103rd highest of 1,720 cities
> Share of households with children receiving SNAP benefits: 4.5% — 200th lowest of 1,720 cities
> Households headed by single mothers: 6.1% — 162nd lowest of 1,720 cities
[recirclink id=1012509]

28. Los Gatos, California
> Child poverty rate: 2.3%
> Median family income, households with children: $234,167 — 22nd highest of 1,720 cities
> Share of households with children receiving SNAP benefits: 0.6% — 13th lowest of 1,720 cities
> Households headed by single mothers: 4.5% — 56th lowest of 1,720 cities
27. Ridgewood, New Jersey
> Child poverty rate: 2.3%
> Median family income, households with children: $235,133 — 21st highest of 1,720 cities
> Share of households with children receiving SNAP benefits: 1.0% — 25th lowest of 1,720 cities
> Households headed by single mothers: 6.2% — 168th lowest of 1,720 cities
[in-text-ad-2]
26. Glen Ellyn, Illinois
> Child poverty rate: 2.3%
> Median family income, households with children: $201,216 — 31st highest of 1,720 cities
> Share of households with children receiving SNAP benefits: 4.6% — 203rd lowest of 1,720 cities
> Households headed by single mothers: 5.9% — 146th lowest of 1,720 cities

25. Bethesda, Maryland
> Child poverty rate: 2.2%
> Median family income, households with children: $250,000+ — the highest of 1,720 cities (tied)
> Share of households with children receiving SNAP benefits: 1.7% — 51st lowest of 1,720 cities
> Households headed by single mothers: 3.8% — 31st lowest of 1,720 cities
[in-text-ad]

24. South Jordan, Utah
> Child poverty rate: 2.2%
> Median family income, households with children: $122,635 — 266th highest of 1,720 cities
> Share of households with children receiving SNAP benefits: 2.5% — 73rd lowest of 1,720 cities
> Households headed by single mothers: 4.1% — 43rd lowest of 1,720 cities
[recirclink id=1106510]
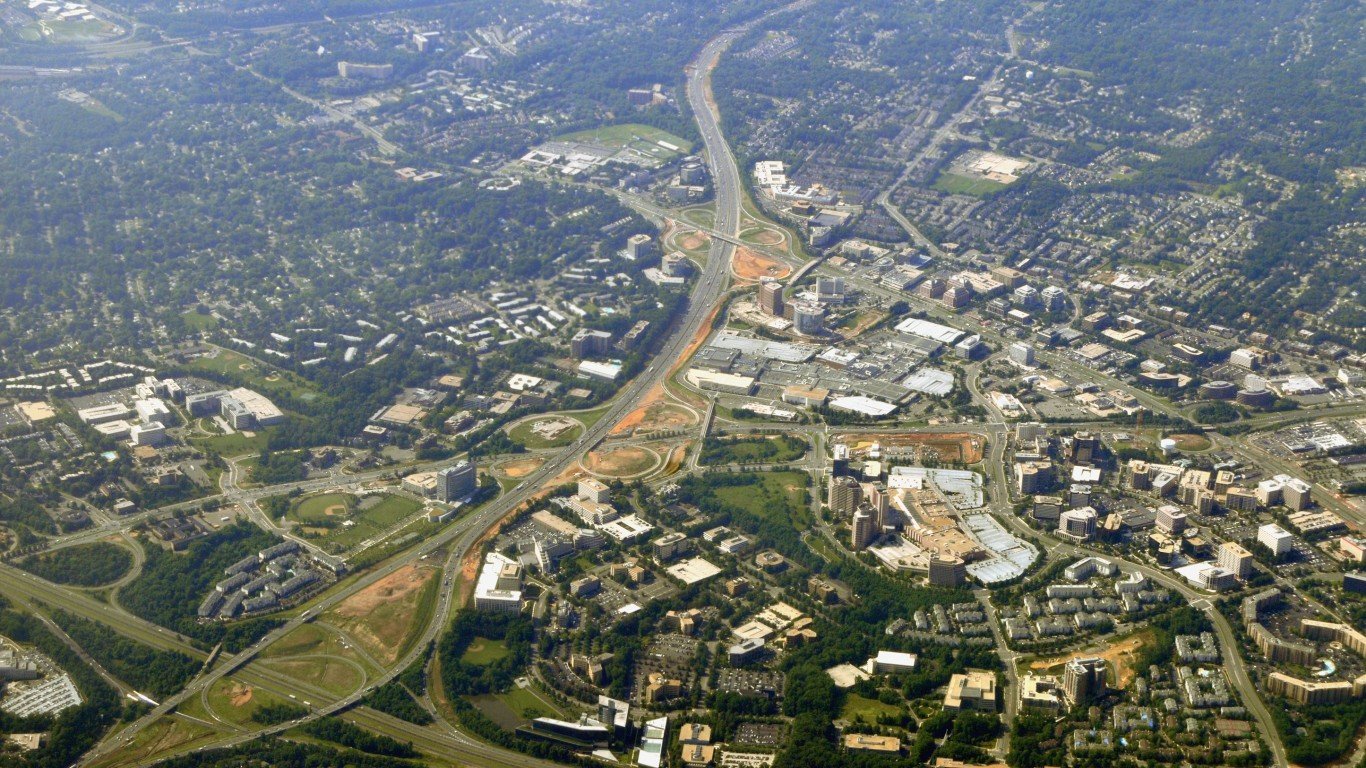
23. Tysons, Virginia
> Child poverty rate: 2.2%
> Median family income, households with children: $153,000 — 112th highest of 1,720 cities
> Share of households with children receiving SNAP benefits: 0.6% — 14th lowest of 1,720 cities
> Households headed by single mothers: 6.0% — 151st lowest of 1,720 cities
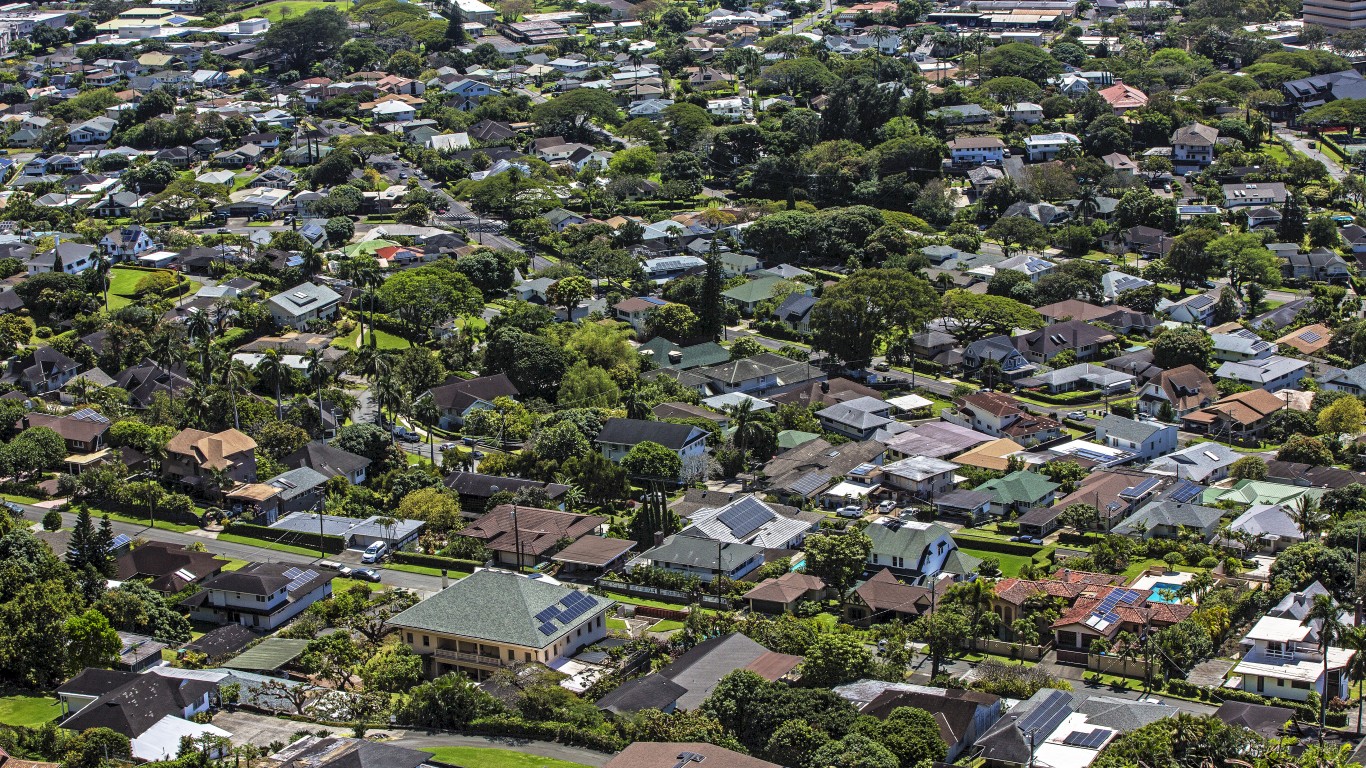
22. East Honolulu, Hawaii
> Child poverty rate: 2.2%
> Median family income, households with children: $163,710 — 80th highest of 1,720 cities
> Share of households with children receiving SNAP benefits: 1.3% — 31st lowest of 1,720 cities
> Households headed by single mothers: 4.7% — 65th lowest of 1,720 cities
[in-text-ad-2]

21. Minnetonka, Minnesota
> Child poverty rate: 2.2%
> Median family income, households with children: $154,053 — 109th highest of 1,720 cities
> Share of households with children receiving SNAP benefits: 3.0% — 102nd lowest of 1,720 cities
> Households headed by single mothers: 6.8% — 240th lowest of 1,720 cities

20. Brookfield, Wisconsin
> Child poverty rate: 2.1%
> Median family income, households with children: $149,481 — 124th highest of 1,720 cities
> Share of households with children receiving SNAP benefits: 2.5% — 76th lowest of 1,720 cities
> Households headed by single mothers: 2.7% — 5th lowest of 1,720 cities
[in-text-ad]

19. Lake Oswego, Oregon
> Child poverty rate: 2.1%
> Median family income, households with children: $163,739 — 79th highest of 1,720 cities
> Share of households with children receiving SNAP benefits: 4.2% — 177th lowest of 1,720 cities
> Households headed by single mothers: 6.3% — 188th lowest of 1,720 cities
[recirclink id=1047662]

18. Granger, Indiana
> Child poverty rate: 2.1%
> Median family income, households with children: $120,433 — 284th highest of 1,720 cities
> Share of households with children receiving SNAP benefits: 4.8% — 211th lowest of 1,720 cities
> Households headed by single mothers: 4.4% — 52nd lowest of 1,720 cities
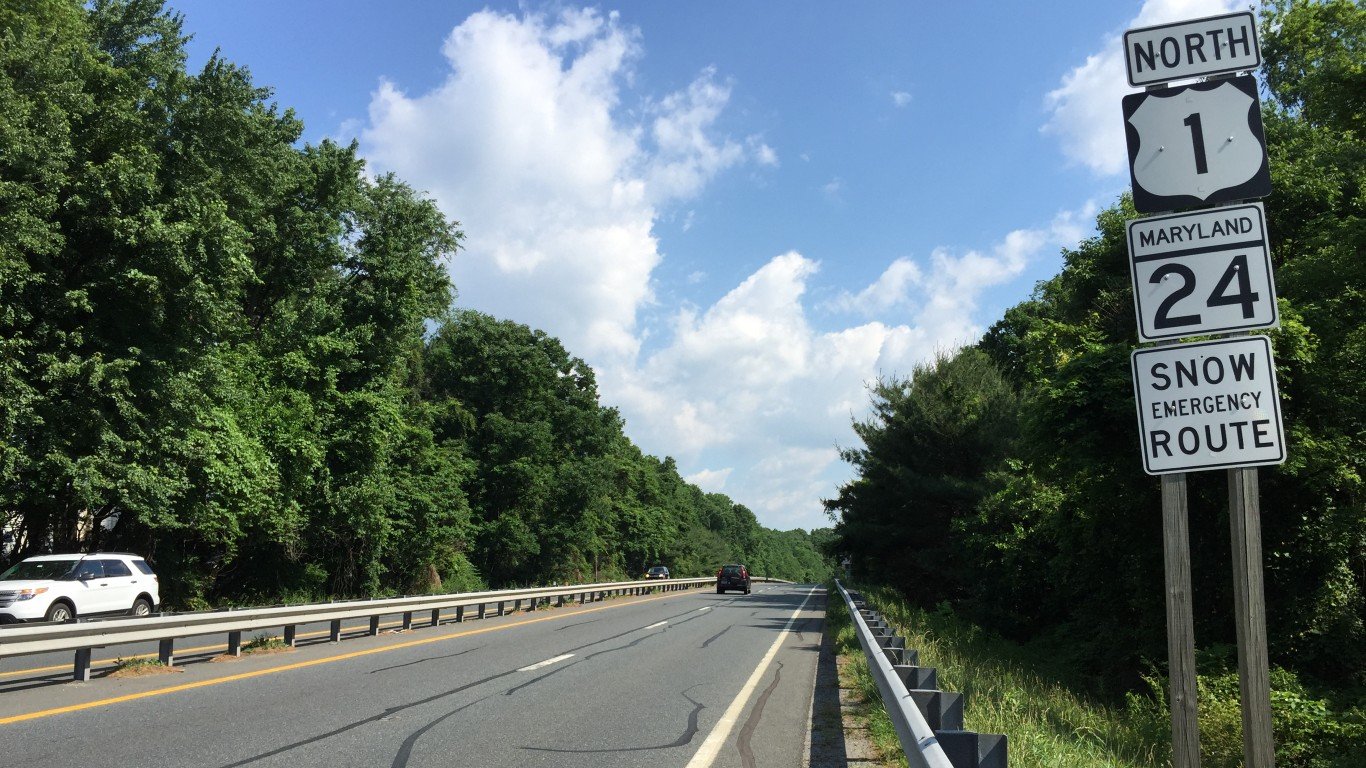
17. Bel Air North, Maryland
> Child poverty rate: 2.0%
> Median family income, households with children: $151,947 — 115th highest of 1,720 cities
> Share of households with children receiving SNAP benefits: 1.4% — 34th lowest of 1,720 cities
> Households headed by single mothers: 2.7% — 6th lowest of 1,720 cities
[in-text-ad-2]

16. Wilmette, Illinois
> Child poverty rate: 1.9%
> Median family income, households with children: $250,000+ — the highest of 1,720 cities (tied)
> Share of households with children receiving SNAP benefits: 1.0% — 27th lowest of 1,720 cities
> Households headed by single mothers: 3.1% — 10th lowest of 1,720 cities
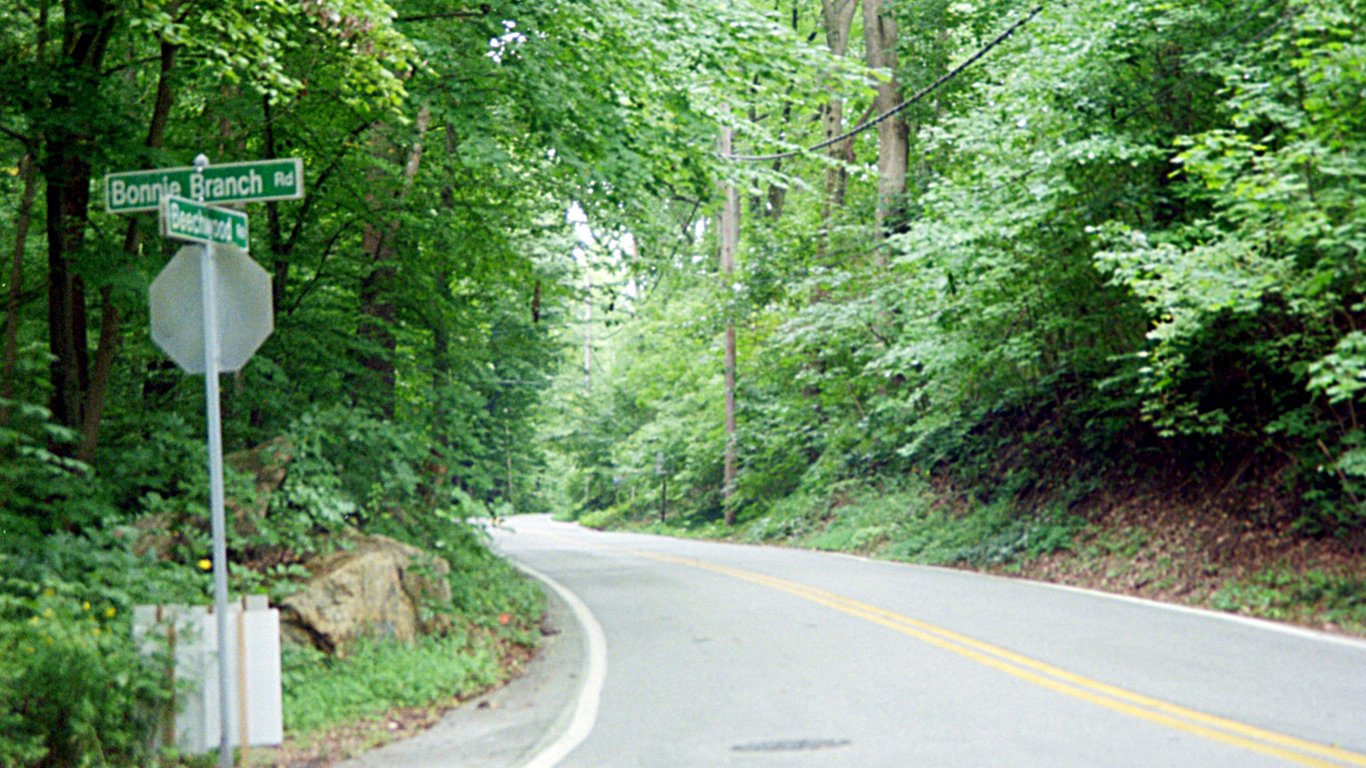
15. Ilchester, Maryland
> Child poverty rate: 1.8%
> Median family income, households with children: $154,605 — 106th highest of 1,720 cities
> Share of households with children receiving SNAP benefits: 3.4% — 126th lowest of 1,720 cities
> Households headed by single mothers: 7.4% — 304th lowest of 1,720 cities
[in-text-ad]
 Comac Church<\/a>","authorUrl":"inName","authorName":"AJW1188<\/a>"}" />
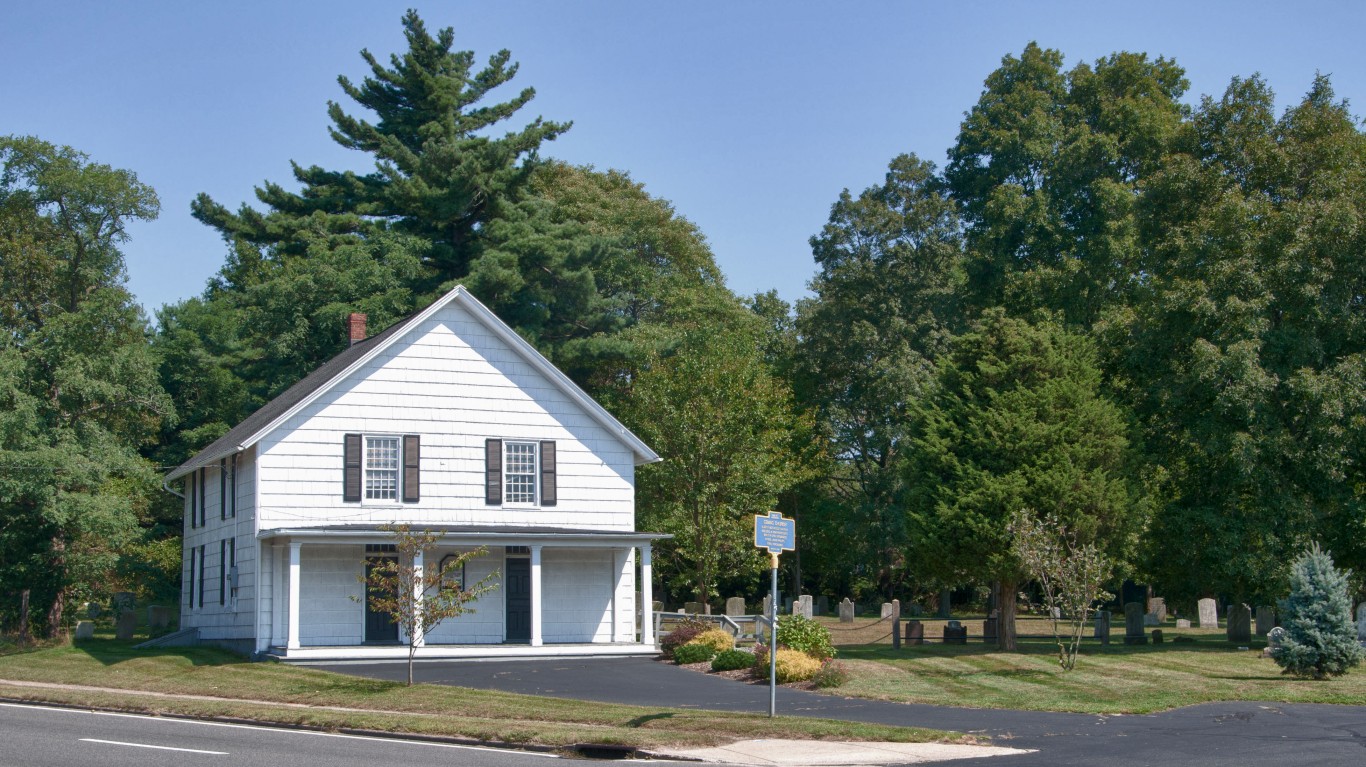
14. Commack, New York
> Child poverty rate: 1.8%
> Median family income, households with children: $181,175 — 42nd highest of 1,720 cities
> Share of households with children receiving SNAP benefits: 2.9% — 91st lowest of 1,720 cities
> Households headed by single mothers: 2.4% — 4th lowest of 1,720 cities
[recirclink id=1092222]

13. Princeton, New Jersey
> Child poverty rate: 1.7%
> Median family income, households with children: $250,000+ — the highest of 1,720 cities (tied)
> Share of households with children receiving SNAP benefits: 0.9% — 24th lowest of 1,720 cities
> Households headed by single mothers: 5.5% — 115th lowest of 1,720 cities

12. University Park, Texas
> Child poverty rate: 1.7%
> Median family income, households with children: $250,000+ — the highest of 1,720 cities (tied)
> Share of households with children receiving SNAP benefits: 0.8% — 21st lowest of 1,720 cities
> Households headed by single mothers: 4.8% — 68th lowest of 1,720 cities
[in-text-ad-2]

11. San Carlos, California
> Child poverty rate: 1.7%
> Median family income, households with children: $250,000+ — the highest of 1,720 cities (tied)
> Share of households with children receiving SNAP benefits: 0.2% — 6th lowest of 1,720 cities
> Households headed by single mothers: 6.4% — 197th lowest of 1,720 cities

10. Southlake, Texas
> Child poverty rate: 1.6%
> Median family income, households with children: $250,000+ — the highest of 1,720 cities (tied)
> Share of households with children receiving SNAP benefits: 2.8% — 87th lowest of 1,720 cities
> Households headed by single mothers: 2.9% — 7th lowest of 1,720 cities
[in-text-ad]

9. Dublin, Ohio
> Child poverty rate: 1.6%
> Median family income, households with children: $171,005 — 66th highest of 1,720 cities
> Share of households with children receiving SNAP benefits: 3.2% — 108th lowest of 1,720 cities
> Households headed by single mothers: 3.6% — 24th lowest of 1,720 cities
[recirclink id=1097516]

8. Highlands Ranch, Colorado
> Child poverty rate: 1.6%
> Median family income, households with children: $149,958 — 123rd highest of 1,720 cities
> Share of households with children receiving SNAP benefits: 1.3% — 33rd lowest of 1,720 cities
> Households headed by single mothers: 6.0% — 155th lowest of 1,720 cities

7. McLean, Virginia
> Child poverty rate: 1.3%
> Median family income, households with children: $250,000+ — the highest of 1,720 cities (tied)
> Share of households with children receiving SNAP benefits: 0.3% — 8th lowest of 1,720 cities
> Households headed by single mothers: 4.1% — 44th lowest of 1,720 cities
[in-text-ad-2]
6. Brentwood, Tennessee
> Child poverty rate: 1.3%
> Median family income, households with children: $192,484 — 35th highest of 1,720 cities
> Share of households with children receiving SNAP benefits: 0.2% — 5th lowest of 1,720 cities
> Households headed by single mothers: 5.1% — 85th lowest of 1,720 cities

5. Upper Arlington, Ohio
> Child poverty rate: 1.2%
> Median family income, households with children: $169,242 — 69th highest of 1,720 cities
> Share of households with children receiving SNAP benefits: 1.4% — 36th lowest of 1,720 cities
> Households headed by single mothers: 5.8% — 134th lowest of 1,720 cities
[in-text-ad]

4. Germantown, Tennessee
> Child poverty rate: 1.1%
> Median family income, households with children: $156,439 — 99th highest of 1,720 cities
> Share of households with children receiving SNAP benefits: 1.6% — 43rd lowest of 1,720 cities
> Households headed by single mothers: 3.2% — 14th lowest of 1,720 cities
[recirclink id=1012509]

3. Leawood, Kansas
> Child poverty rate: 1.1%
> Median family income, households with children: $223,182 — 24th highest of 1,720 cities
> Share of households with children receiving SNAP benefits: 1.0% — 26th lowest of 1,720 cities
> Households headed by single mothers: 1.3% — the lowest of 1,720 cities

2. Burke, Virginia
> Child poverty rate: 0.7%
> Median family income, households with children: $156,737 — 97th highest of 1,720 cities
> Share of households with children receiving SNAP benefits: 3.7% — 149th lowest of 1,720 cities
> Households headed by single mothers: 5.4% — 107th lowest of 1,720 cities
[in-text-ad-2]
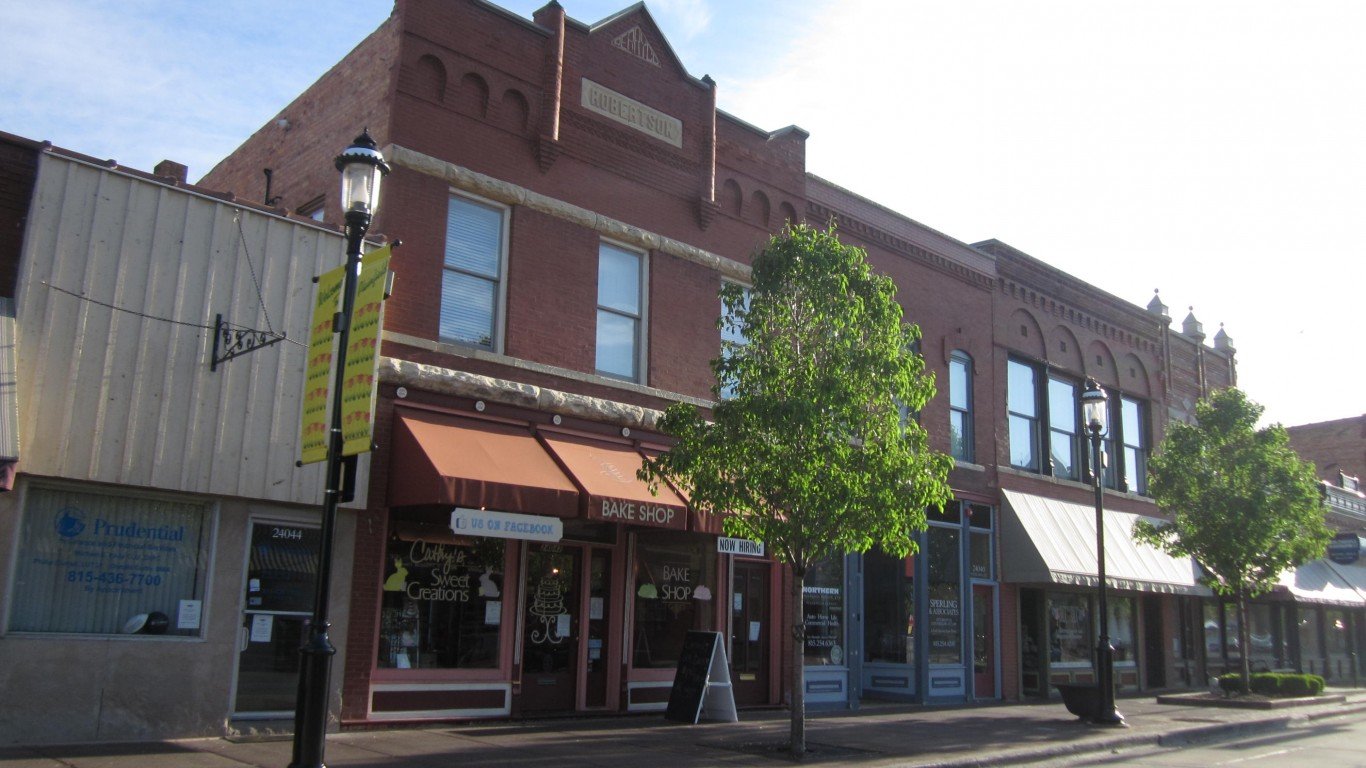
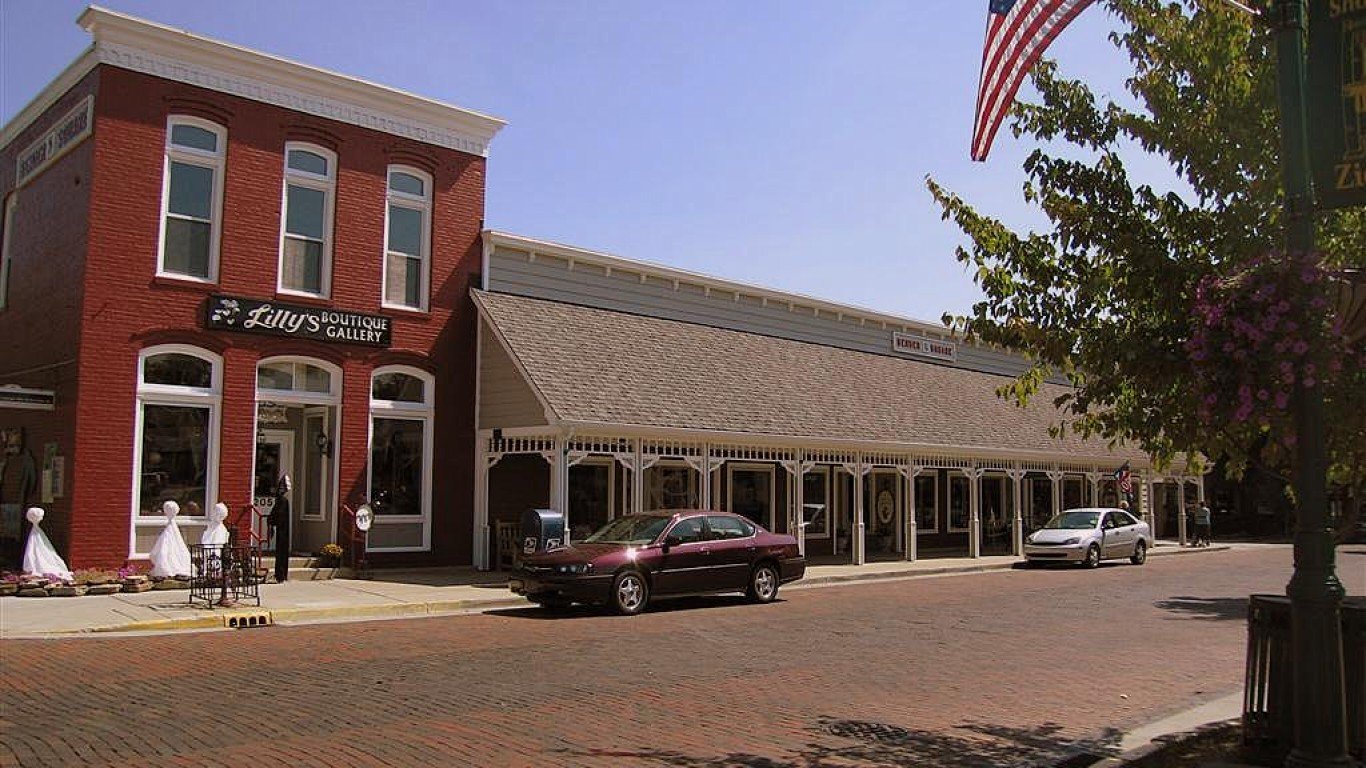
1. Oswego, Illinois
> Child poverty rate: 0.0% reported
> Median family income, households with children: $116,761 — 306th highest of 1,720 cities
> Share of households with children receiving SNAP benefits: 12.7% — 648th lowest of 1,720 cities
> Households headed by single mothers: 6.1% — 164th lowest of 1,720 cities
Methodology
To determine the cities where the most children live in poverty, 24/7 Wall St. reviewed five-year estimates of child poverty rates from the U.S. Census Bureau’s 2020 American Community Survey.
We used census “place” geographies — a category that includes incorporated legal entities and census-designated statistical entities. We defined cities based on a population threshold — census places needed to have a population of at least 25,000 to be considered.
Cities were excluded if the child poverty rate was not available in the 2020 ACS, if the number of children for whom poverty status was determined was lower than 500, or if the sampling error associated with a city’s data was deemed too high.
The sampling error was defined as too high if the coefficient of variation — a statistical assessment of how reliable an estimate is — for a city’s child poverty rate was above 15% and greater than two standard deviations above the mean CV for all cities’ child poverty rates. We similarly excluded cities that had a sampling error too high for their population, using the same definition.
Cities were ranked based on the share of children living in poverty. To break ties, we used the number of children living in poverty.
Additional information on median income for families with children, the share of households with children receiving benefits from the Supplemental Nutrition Assistance Program, and the share of households headed by single mothers are also five-year estimates from the 2020 ACS.
Contact [email protected] for any questions or corrections.