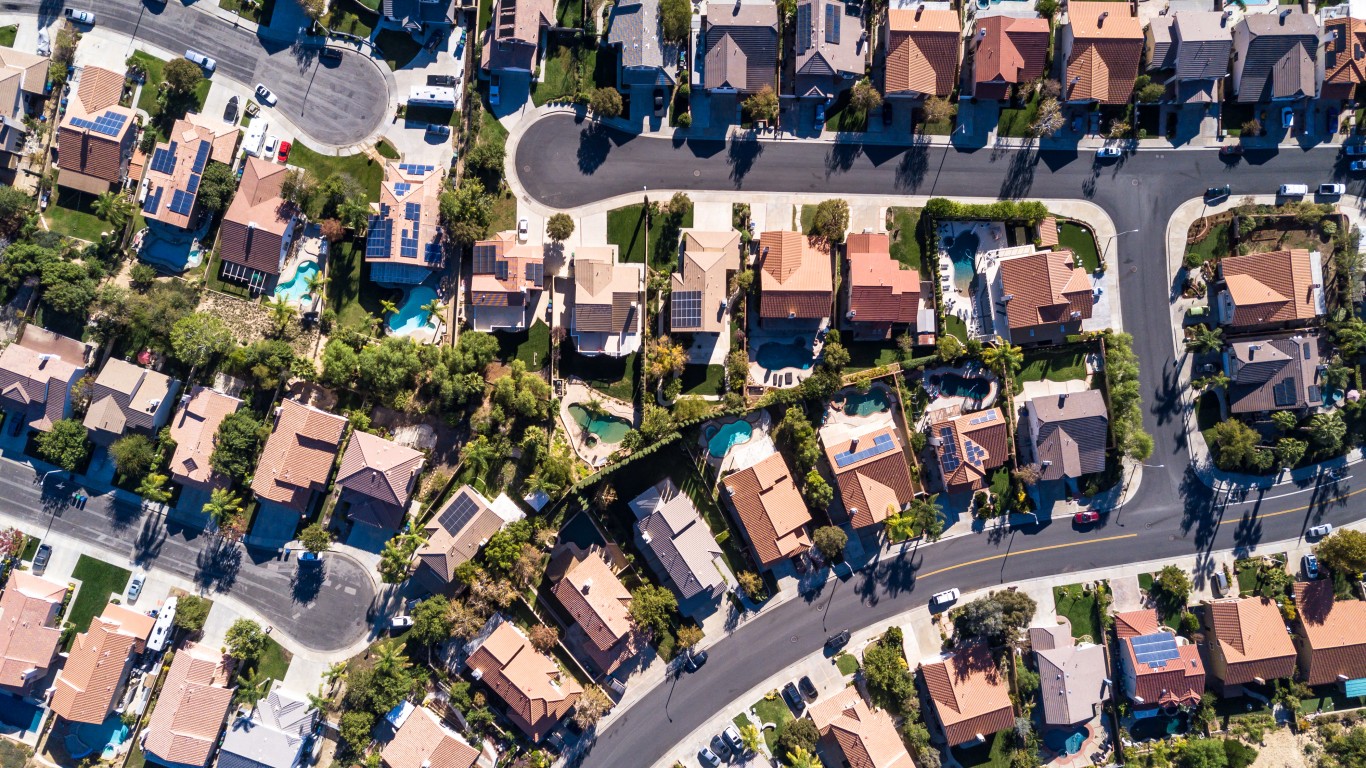
Suburbs – once considered to be far whiter than urban areas – are diversifying, according to a recent report from Brookings, a nonprofit public policy organization. Across the country, certain suburban zones surrounding major metropolitan areas have higher racial diversity than the country as a whole. (Urban areas, however, remain more diverse than rural areas. Here are the most diverse mid-size cities.)
This diversification is the result of multiple factors. From 2010 to 2020, the white population in most major suburbs declined. During the same period, the nation became more racially diverse and people of color continued a trend of moving to the suburbs. Today, a majority of residents of all racial and ethnic groups in major metro areas live in the suburbs.
To identify the 25 metro areas with the most racially diverse suburbs in the United States, 24/7 Wall St. reviewed a recent report from Brookings titled: Today’s suburbs are symbolic of America’s rising diversity: A 2020 census portrait. Metro areas are ranked on the share of suburban residents who identify as a person of color, defined as Latino or Hispanic, Black, Asian American, Native Hawaiian and Other Pacific Islander, American Indian/Alaska Native, two or more races, or other nonwhite racial groups.
Although the metro areas are dispersed across the country, from the Pacific Northwest to the Gold Coast of Florida, many are in the South and the West. California leads the nation with seven of the 25 suburban metro areas where over 40% of residents identify as a person of color. Texas follows, with four of the most diverse suburban metro areas.
In the last 30 years, diversity in suburban areas has risen, from 20% of suburbanites identifying as people of color in 1990 to 45% in 2020. The 2020 census revealed that 15 of the nation’s 56 major metro areas have suburban populations that comprise a majority of residents identifying as people of color.
The newest of these minority-white suburbs include Atlanta, Dallas, Orlando, Florida; San Antonio, and San Diego. The trend of people identifying as persons of color moving to suburbs is fueled partially by the rising cost of housing and increased displacement in urban areas. Here are U.S. cities becoming more unaffordable for low-income Americans.
It is important to note that although suburbs are becoming more diverse, white Americans still live in mostly white neighborhoods. According to research published by the American Psychological Association, white residents are prone to moving when neighborhoods they live in diversify.
Click here to see the most racially diverse American suburbs
Click here to read our detailed methodology
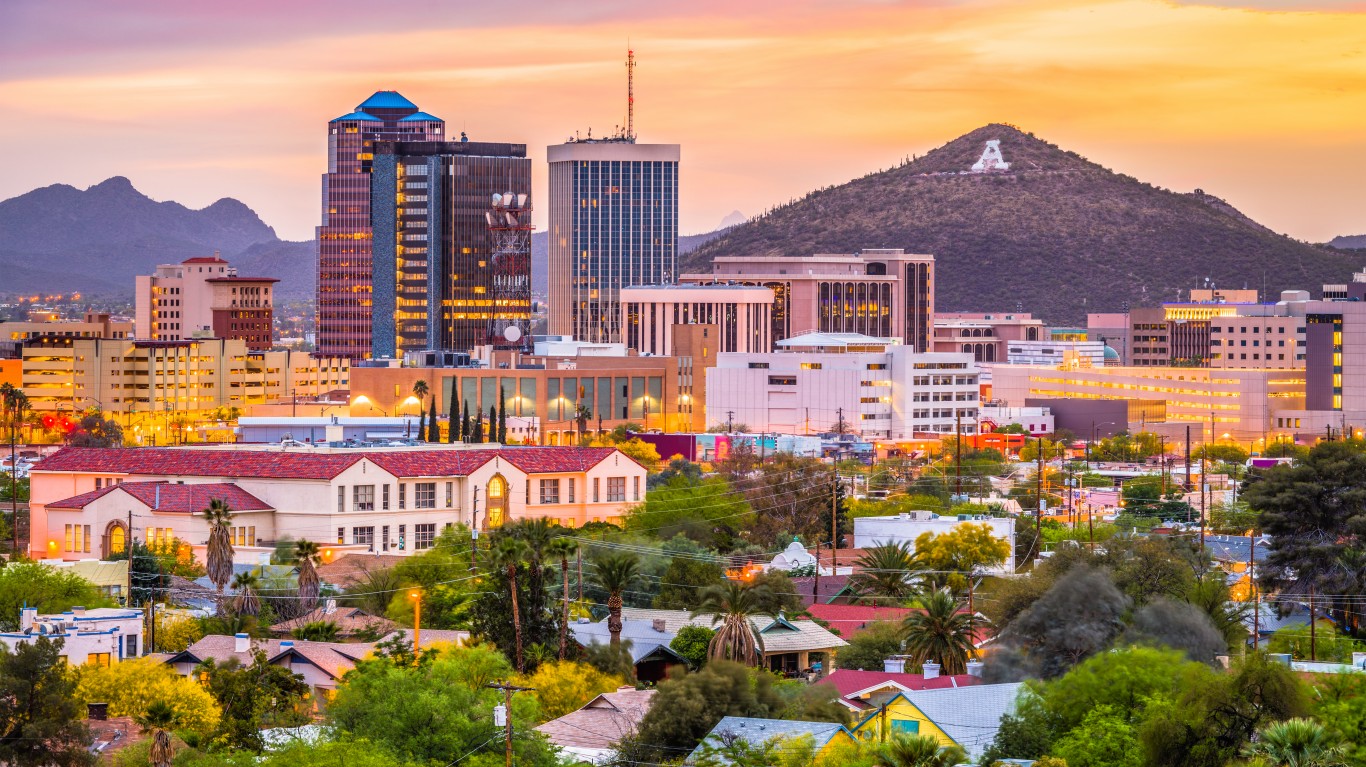
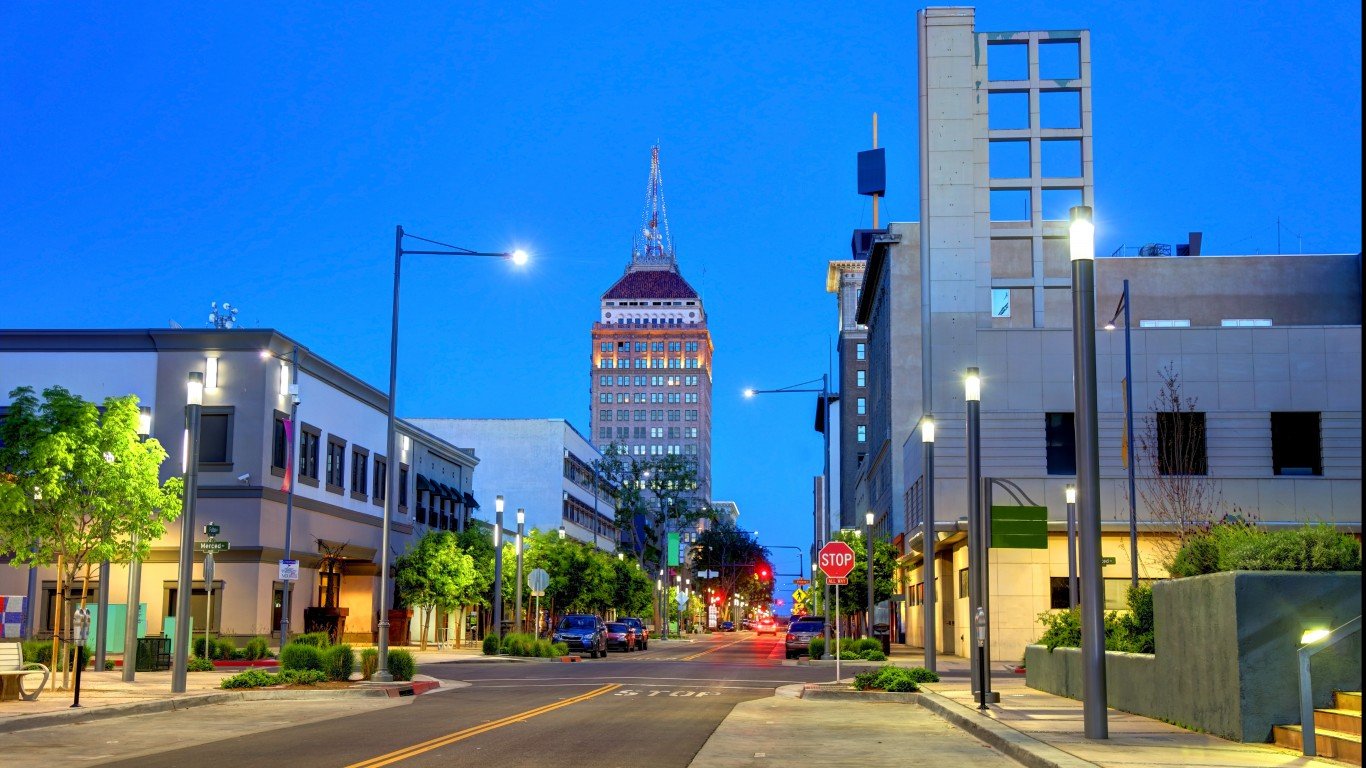
25. Tucson, AZ
> Suburban metro area residents who identify as nonwhite: 40.1%
> Largest suburban minority group: Latino or Hispanic (28.7% of suburban pop.)
> 10-yr. change in suburban nonwhite population: +37,003
> 10-yr. change in suburban white population: +3,654
> Total metro area population: 1,043,433
[in-text-ad]
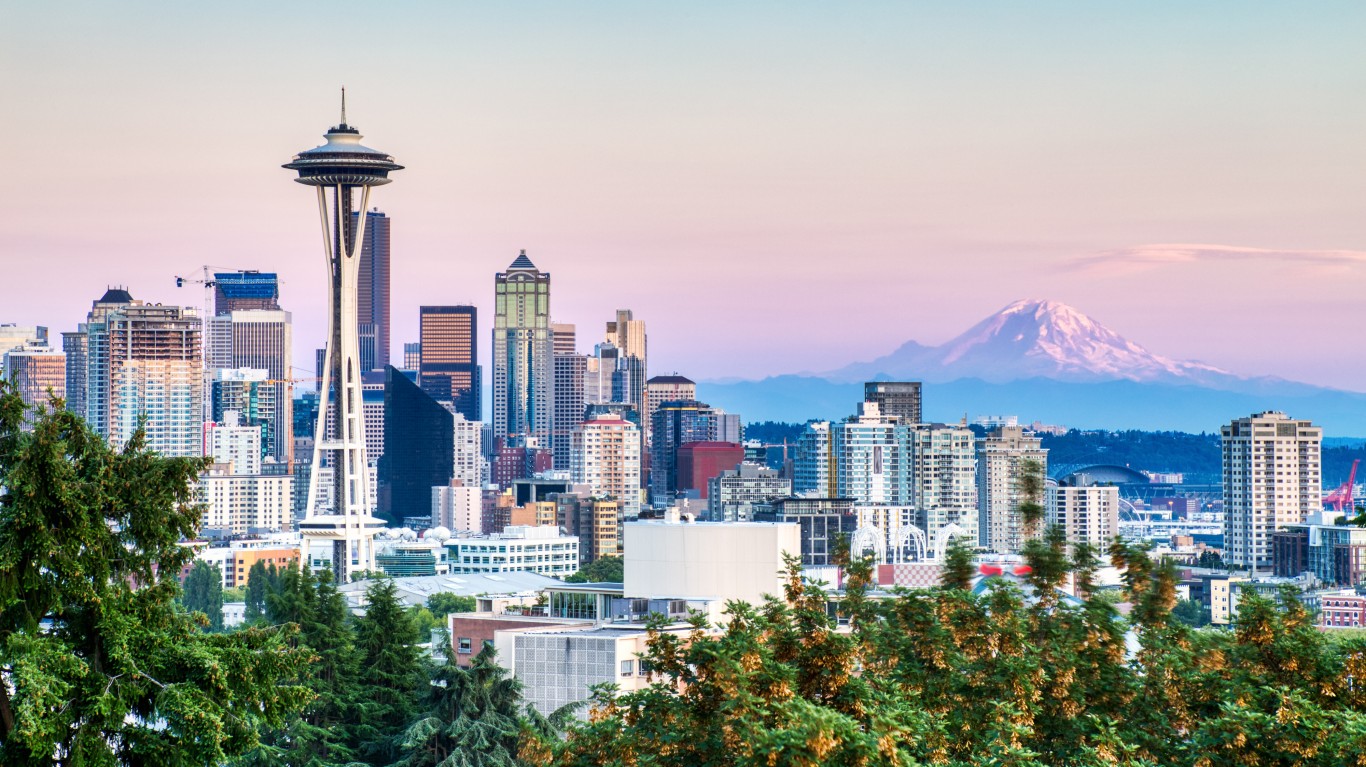
24. Seattle-Tacoma-Bellevue, WA
> Suburban metro area residents who identify as nonwhite: 41.4%
> Largest suburban minority group: Asian American (15.2% of suburban pop.)
> 10-yr. change in suburban nonwhite population: +440,007
> 10-yr. change in suburban white population: -39,849
> Total metro area population: 4,018,762
[recirclink id=1130078]

23. Richmond, VA
> Suburban metro area residents who identify as nonwhite: 41.9%
> Largest suburban minority group: Black (24.7% of suburban pop.)
> 10-yr. change in suburban nonwhite population: +98,378
> 10-yr. change in suburban white population: +7,159
> Total metro area population: 1,314,434
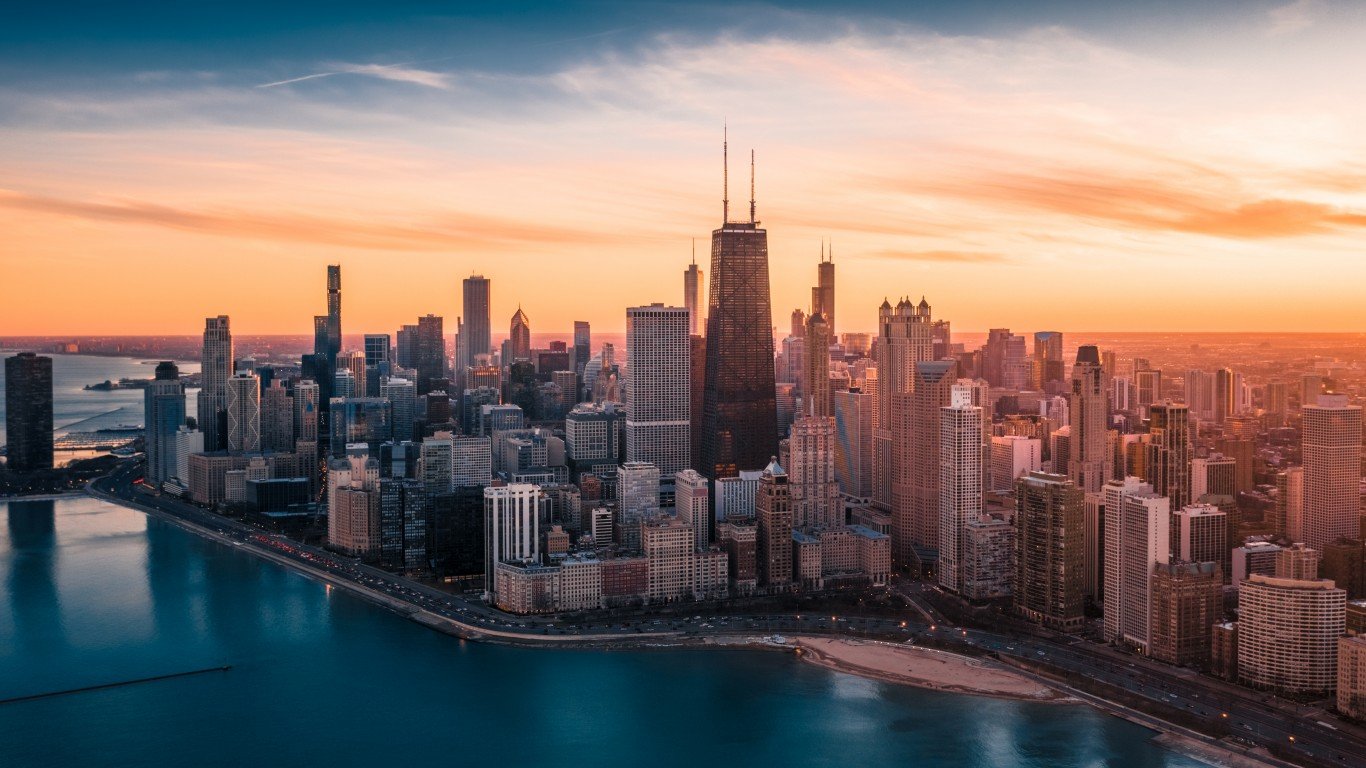
22. Chicago-Naperville-Elgin, IL-IN-WI
> Suburban metro area residents who identify as nonwhite: 42.1%
> Largest suburban minority group: Latino or Hispanic (20.5% of suburban pop.)
> 10-yr. change in suburban nonwhite population: +465,877
> 10-yr. change in suburban white population: -373,566
> Total metro area population: 9,618,502
[in-text-ad-2]
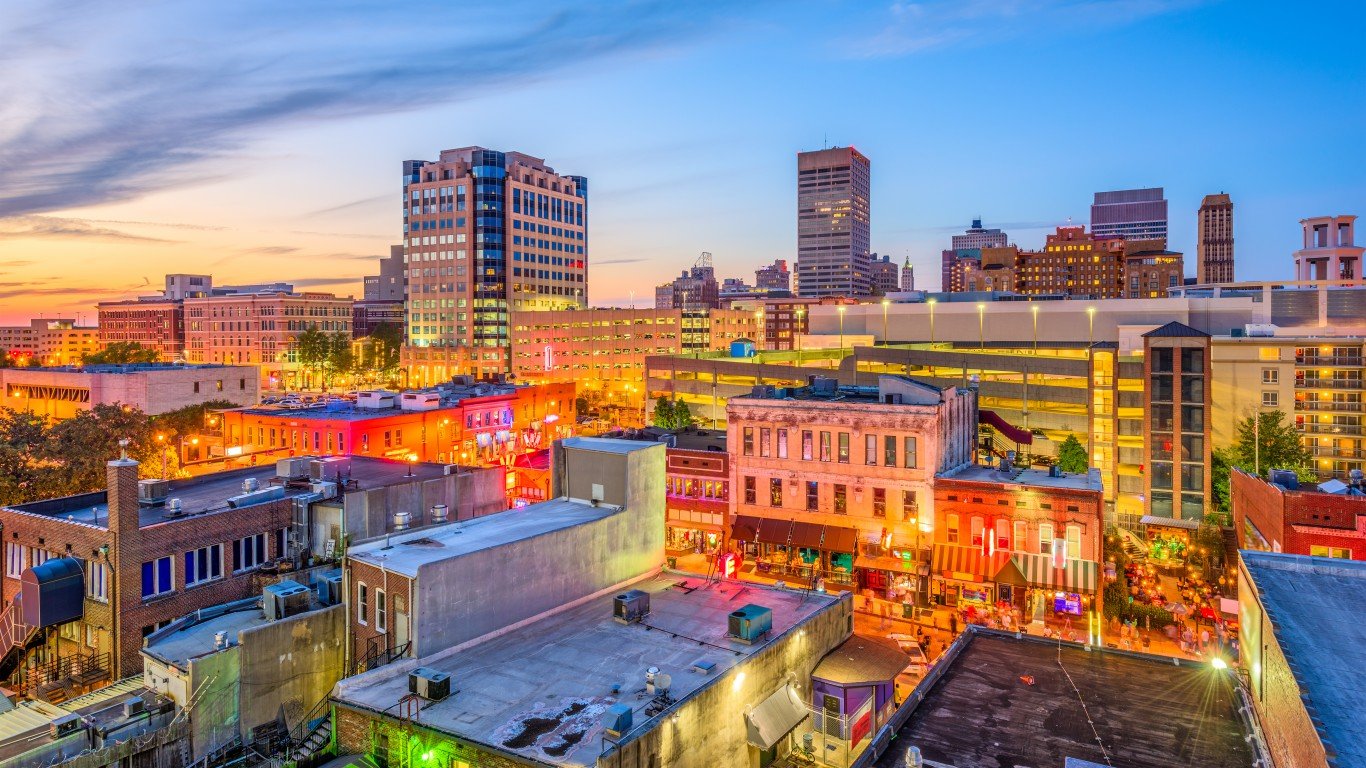
21. Memphis, TN-MS-AR
> Suburban metro area residents who identify as nonwhite: 43.1%
> Largest suburban minority group: Black (31.4% of suburban pop.)
> 10-yr. change in suburban nonwhite population: +64,966
> 10-yr. change in suburban white population: -29,502
> Total metro area population: 1,337,779

20. Virginia Beach-Norfolk-Newport News, VA-NC
> Suburban metro area residents who identify as nonwhite: 45.0%
> Largest suburban minority group: Black (30.6% of suburban pop.)
> 10-yr. change in suburban nonwhite population: +69,327
> 10-yr. change in suburban white population: -5,813
> Total metro area population: 1,799,674
[in-text-ad]
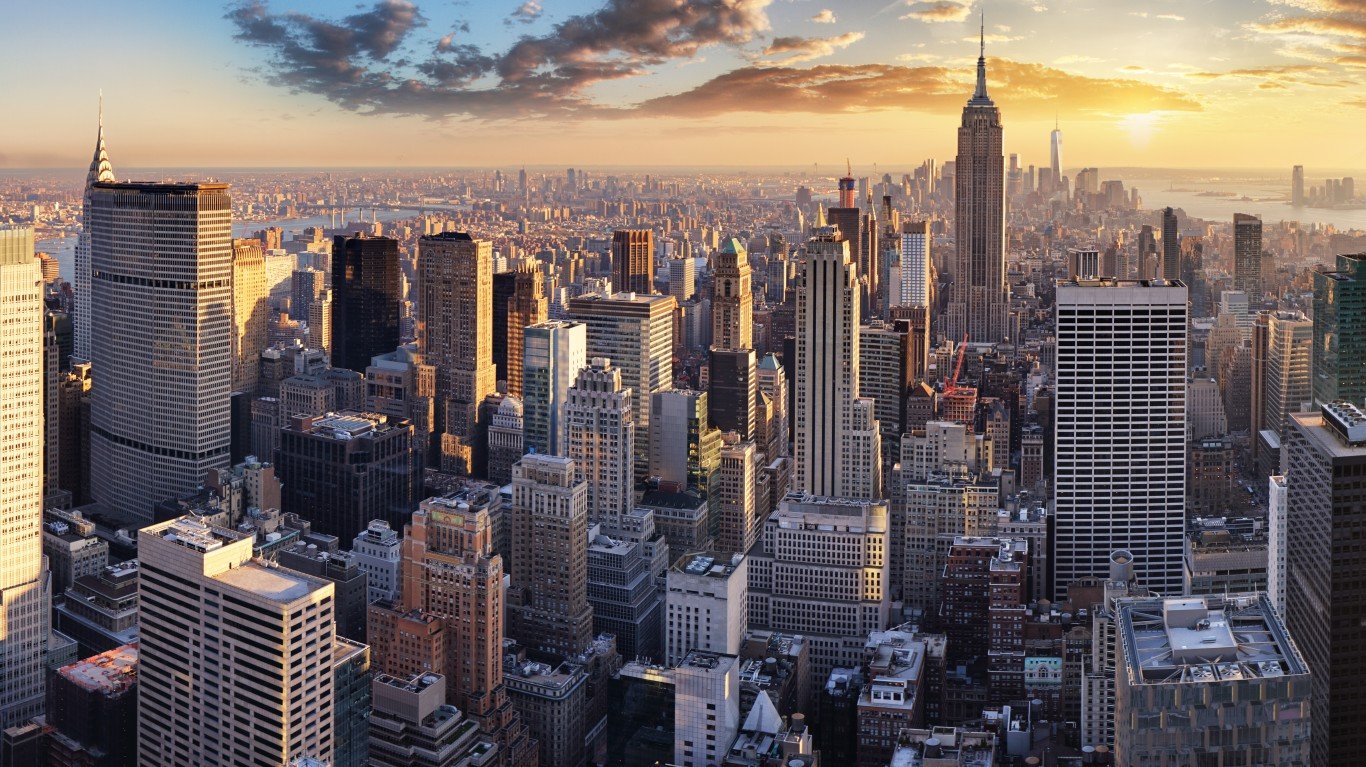
19. New York-Newark-Jersey City, NY-NJ-PA
> Suburban metro area residents who identify as nonwhite: 45.0%
> Largest suburban minority group: Latino or Hispanic (22.3% of suburban pop.)
> 10-yr. change in suburban nonwhite population: +1,062,813
> 10-yr. change in suburban white population: -527,770
> Total metro area population: 20,140,470
[recirclink id=1141581]
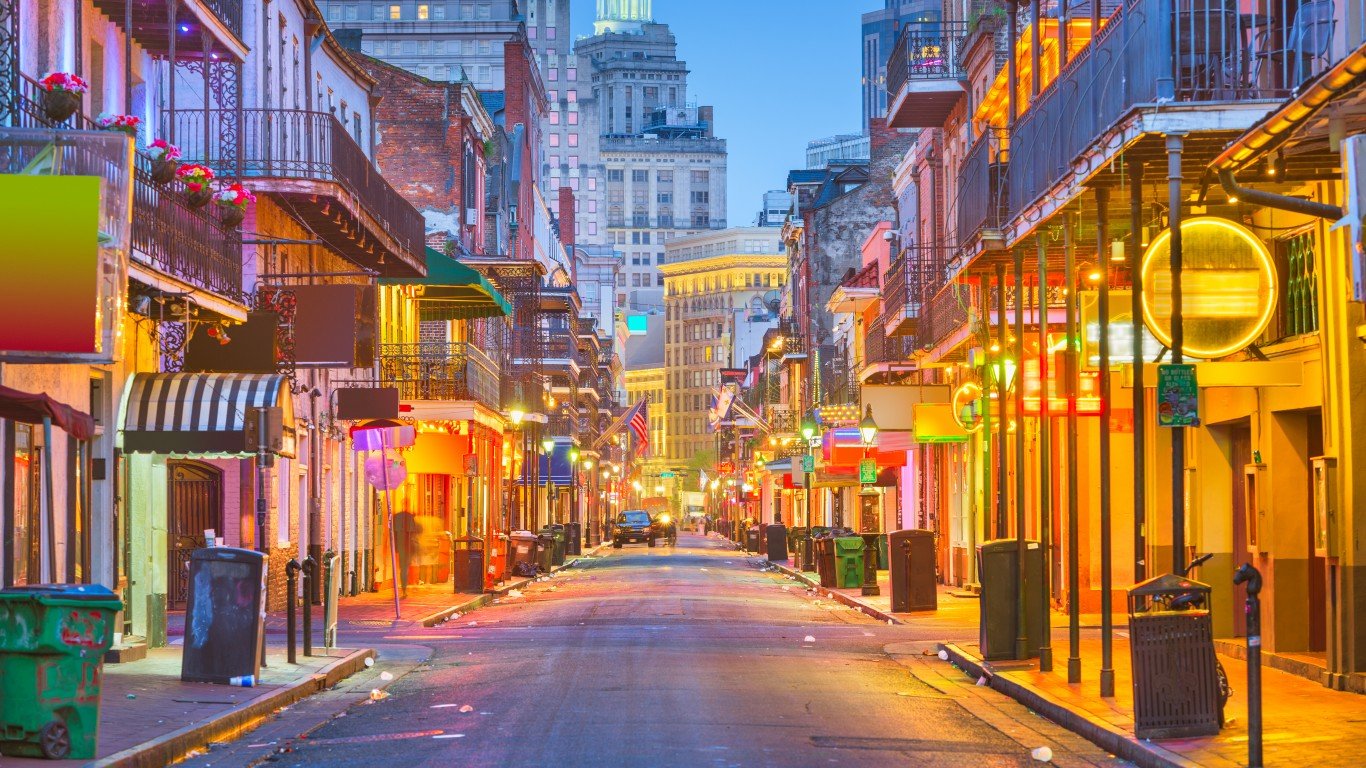
18. New Orleans-Metairie, LA
> Suburban metro area residents who identify as nonwhite: 45.7%
> Largest suburban minority group: Black (26.4% of suburban pop.)
> 10-yr. change in suburban nonwhite population: +66,730
> 10-yr. change in suburban white population: -29,945
> Total metro area population: 1,271,845

17. Sacramento-Roseville-Folsom, CA
> Suburban metro area residents who identify as nonwhite: 47.4%
> Largest suburban minority group: Latino or Hispanic (20.8% of suburban pop.)
> 10-yr. change in suburban nonwhite population: +205,345
> 10-yr. change in suburban white population: -44,530
> Total metro area population: 2,397,382
[in-text-ad-2]
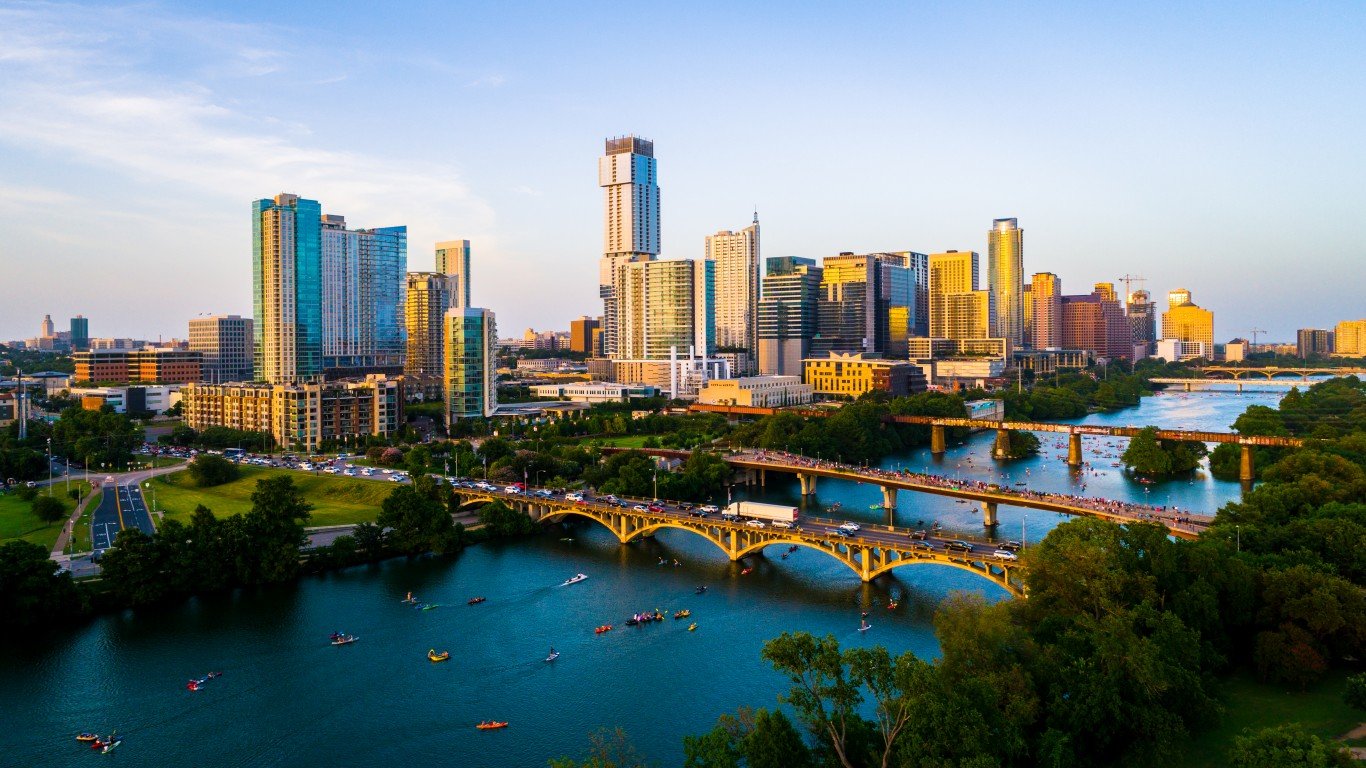
16. Austin-Round Rock-Georgetown, TX
> Suburban metro area residents who identify as nonwhite: 48.1%
> Largest suburban minority group: Latino or Hispanic (31.6% of suburban pop.)
> 10-yr. change in suburban nonwhite population: +251,223
> 10-yr. change in suburban white population: +124,813
> Total metro area population: 2,283,371
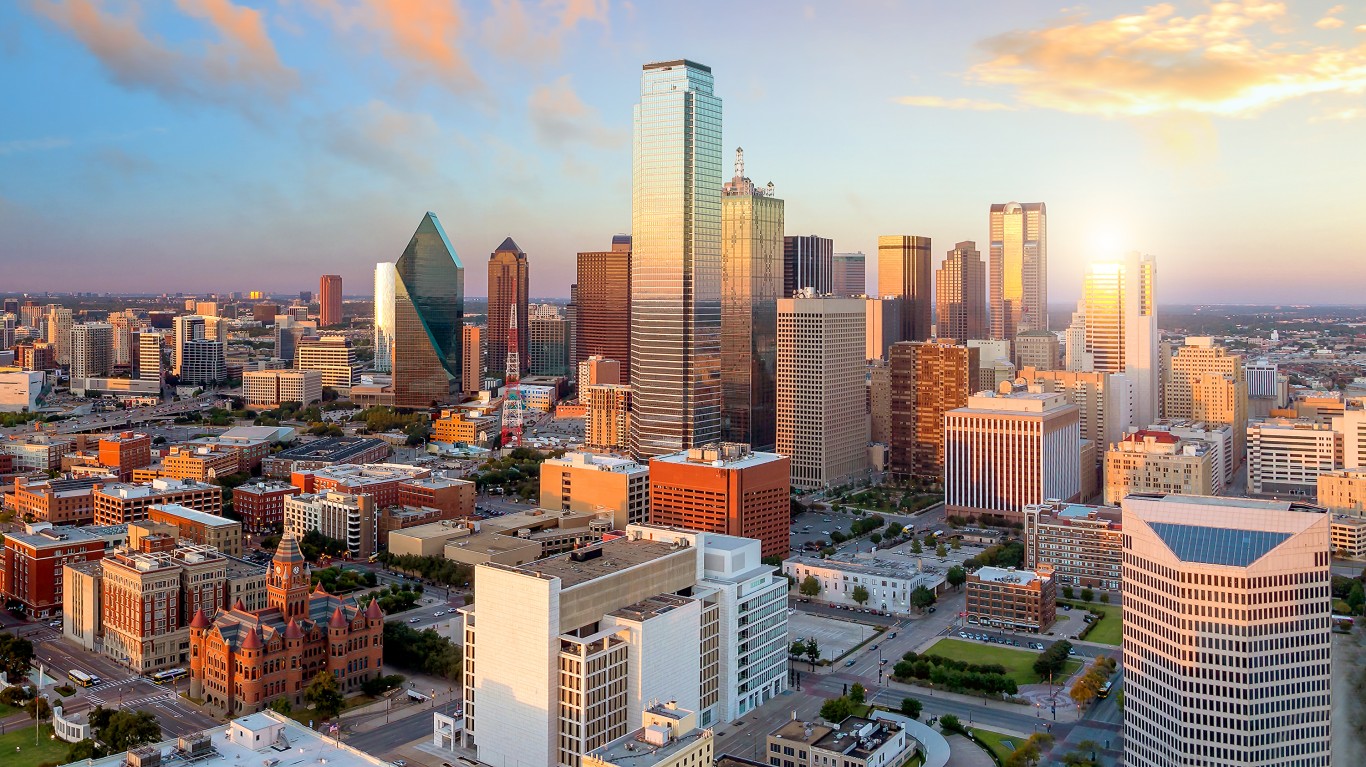
15. Dallas-Fort Worth-Arlington, TX
> Suburban metro area residents who identify as nonwhite: 51.7%
> Largest suburban minority group: Latino or Hispanic (24.8% of suburban pop.)
> 10-yr. change in suburban nonwhite population: +910,905
> 10-yr. change in suburban white population: +46,840
> Total metro area population: 7,637,387
[in-text-ad]

14. San Diego-Chula Vista-Carlsbad, CA
> Suburban metro area residents who identify as nonwhite: 51.7%
> Largest suburban minority group: Latino or Hispanic (34.6% of suburban pop.)
> 10-yr. change in suburban nonwhite population: +130,471
> 10-yr. change in suburban white population: -47,669
> Total metro area population: 3,298,634
[recirclink id=1140168]

13. Orlando-Kissimmee-Sanford, FL
> Suburban metro area residents who identify as nonwhite: 55.2%
> Largest suburban minority group: Latino or Hispanic (31.9% of suburban pop.)
> 10-yr. change in suburban nonwhite population: +449,022
> 10-yr. change in suburban white population: +20,670
> Total metro area population: 2,673,376
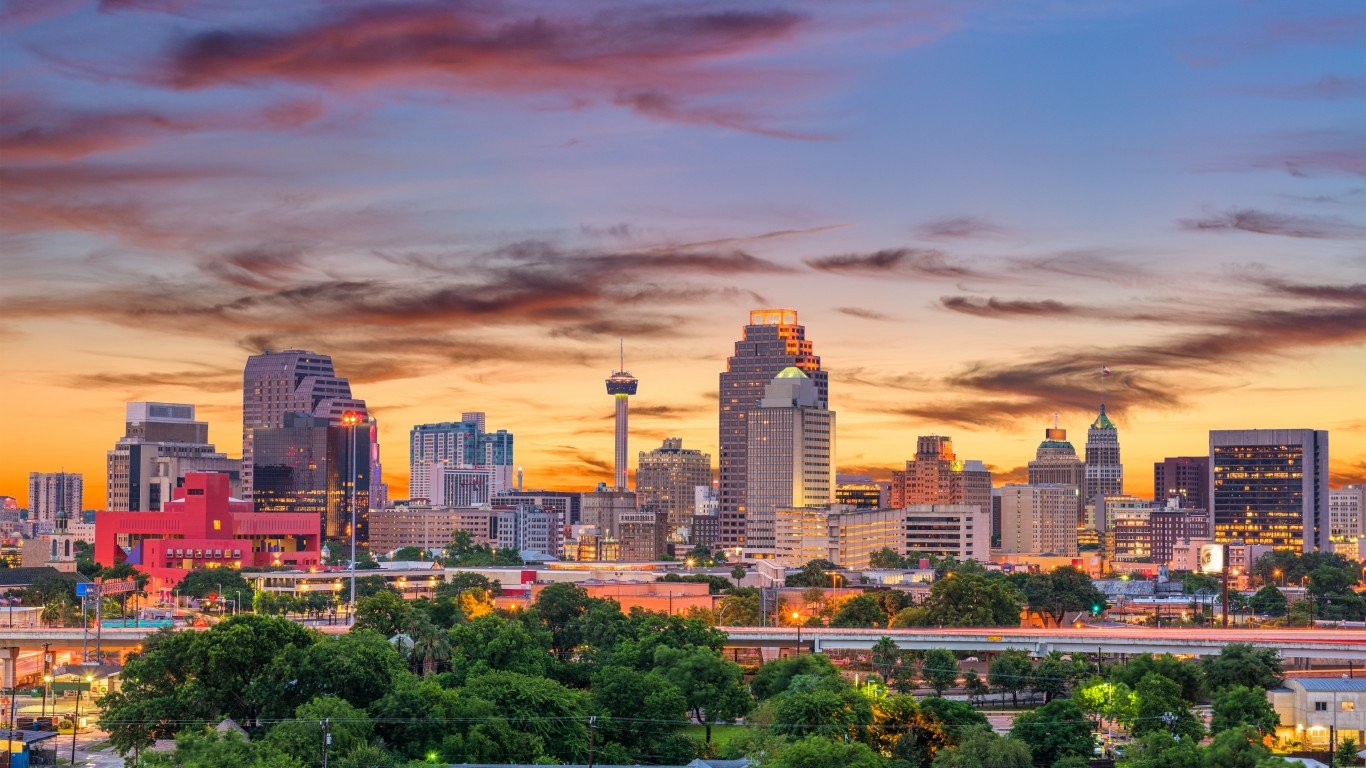
12. San Antonio-New Braunfels, TX
> Suburban metro area residents who identify as nonwhite: 55.2%
> Largest suburban minority group: Latino or Hispanic (42.2% of suburban pop.)
> 10-yr. change in suburban nonwhite population: +226,257
> 10-yr. change in suburban white population: +82,160
> Total metro area population: 2,558,143
[in-text-ad-2]
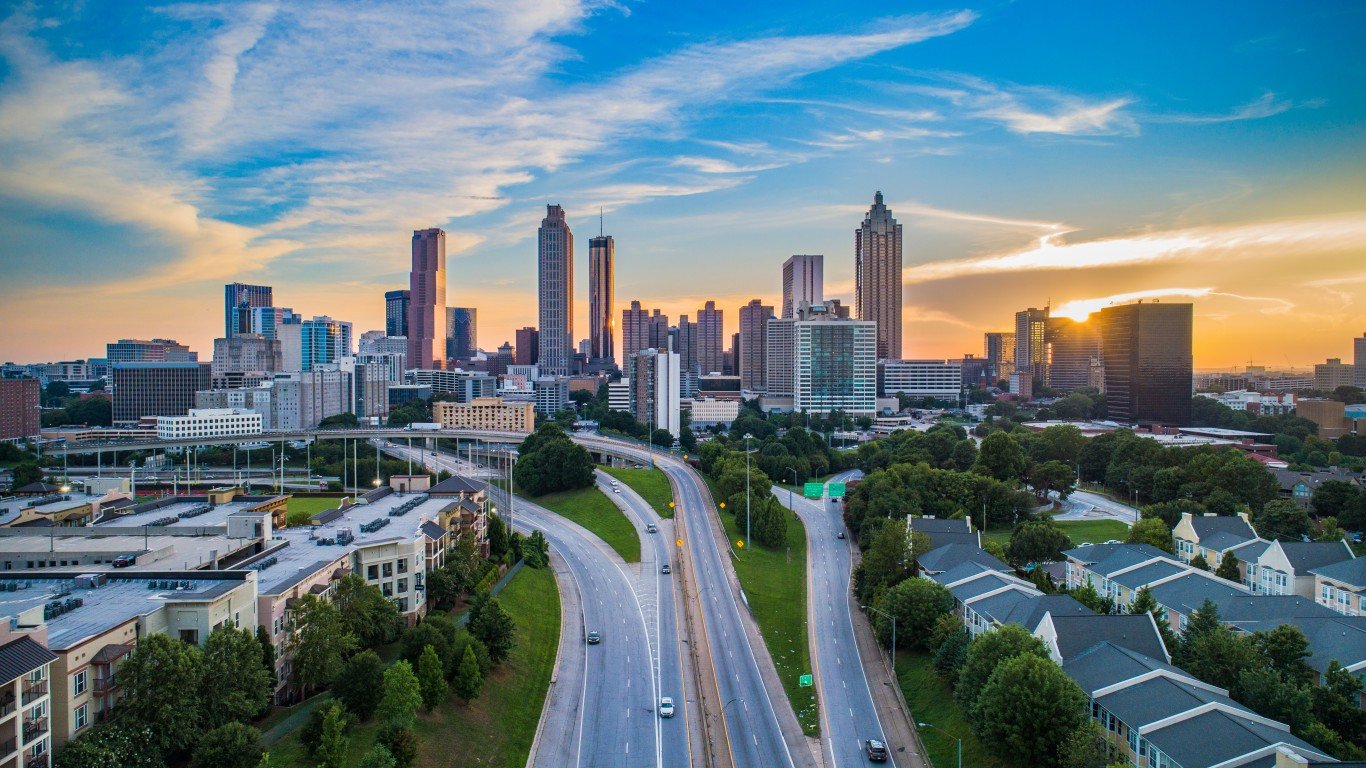
11. Atlanta-Sandy Springs-Alpharetta, GA
> Suburban metro area residents who identify as nonwhite: 56.0%
> Largest suburban minority group: Black (32.2% of suburban pop.)
> 10-yr. change in suburban nonwhite population: +775,719
> 10-yr. change in suburban white population: -65,571
> Total metro area population: 6,089,815
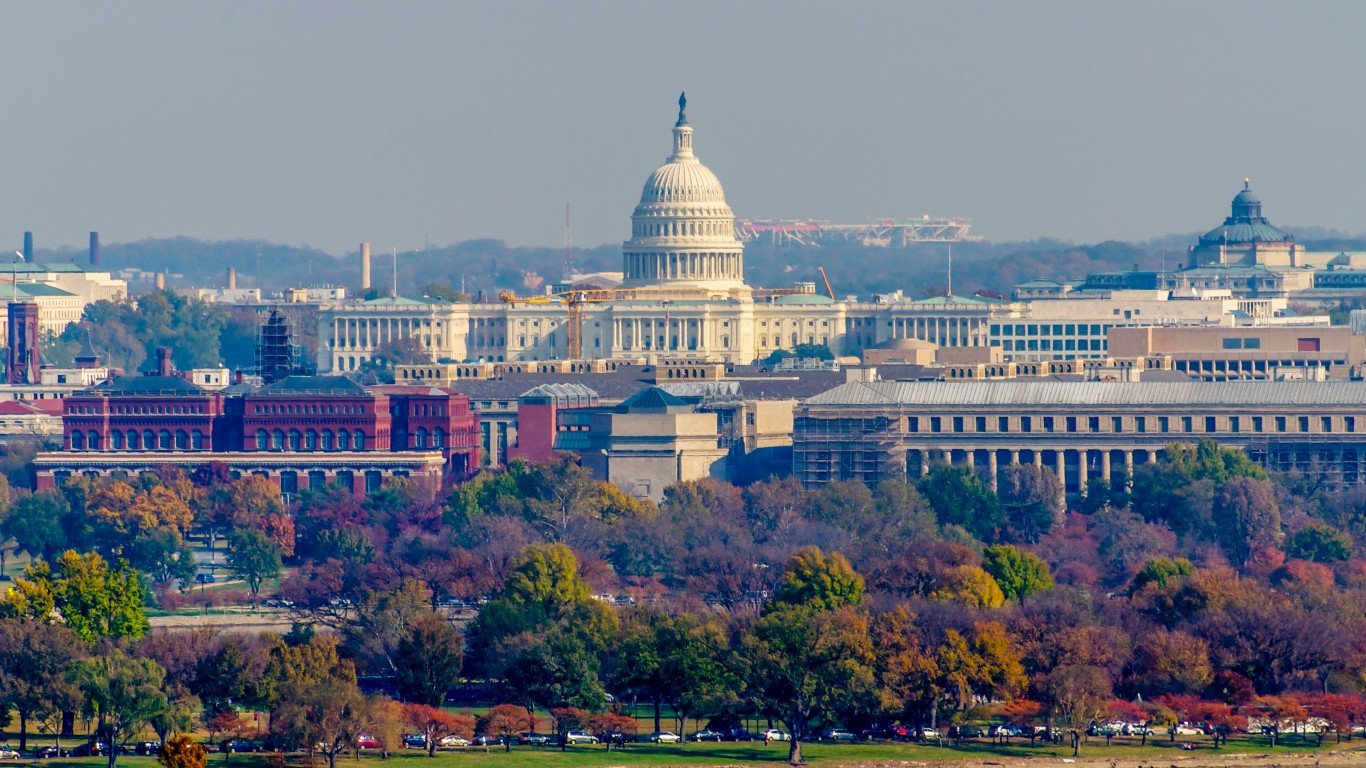
10. Washington-Arlington-Alexandria, DC-VA-MD-WV
> Suburban metro area residents who identify as nonwhite: 58.0%
> Largest suburban minority group: Black (22.7% of suburban pop.)
> 10-yr. change in suburban nonwhite population: +719,391
> 10-yr. change in suburban white population: -122,108
> Total metro area population: 6,385,162
[in-text-ad]
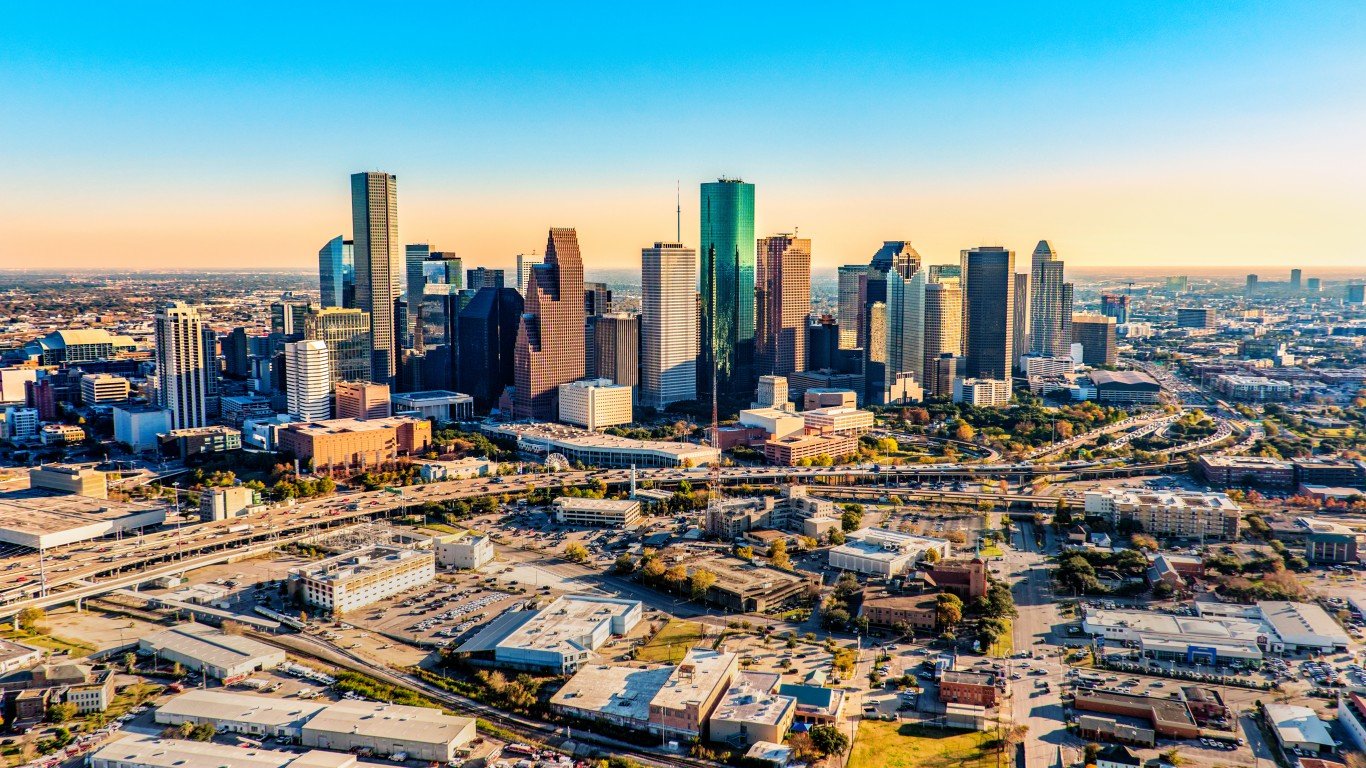
9. Houston-The Woodlands-Sugar Land, TX
> Suburban metro area residents who identify as nonwhite: 62.2%
> Largest suburban minority group: Latino or Hispanic (34.8% of suburban pop.)
> 10-yr. change in suburban nonwhite population: +925,470
> 10-yr. change in suburban white population: +50,636
> Total metro area population: 7,122,240
[recirclink id=1139581]
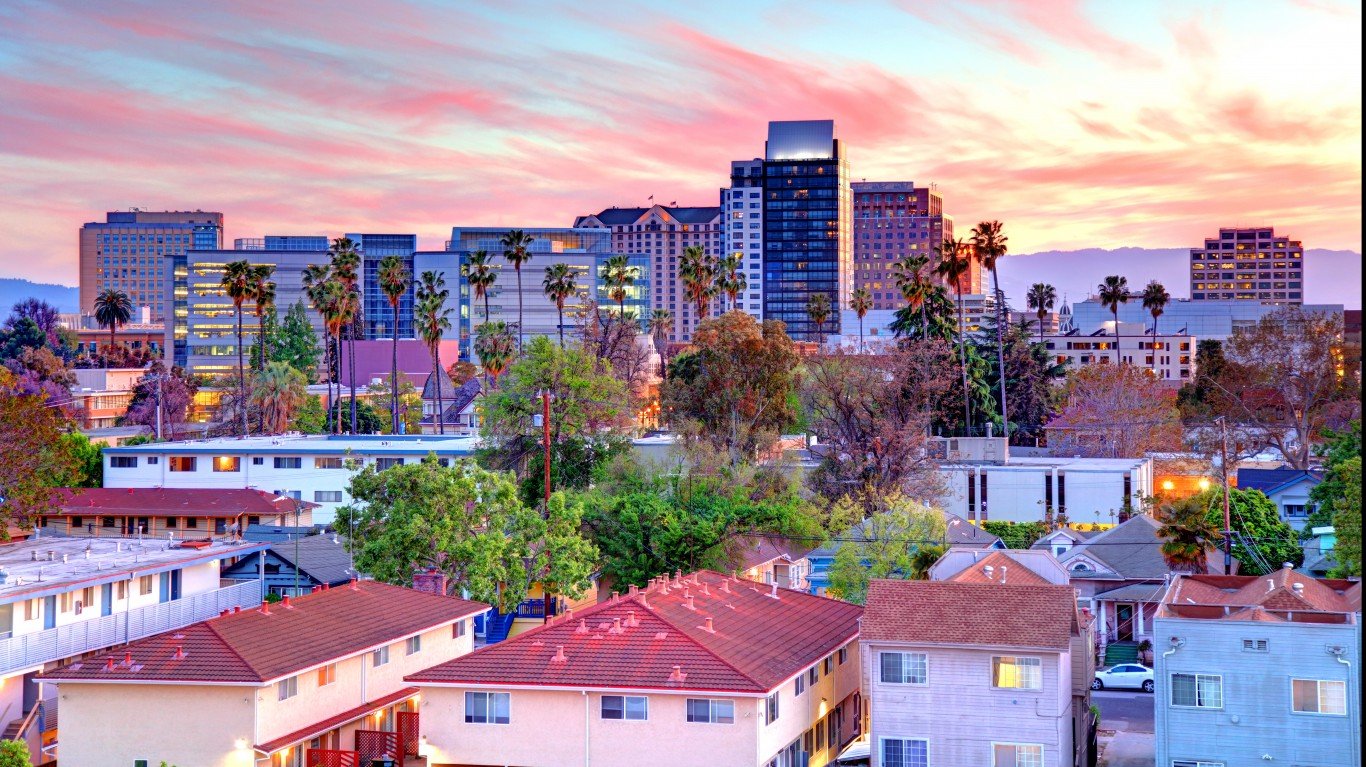
8. San Jose-Sunnyvale-Santa Clara, CA
> Suburban metro area residents who identify as nonwhite: 63.0%
> Largest suburban minority group: Asian American (33.1% of suburban pop.)
> 10-yr. change in suburban nonwhite population: +95,501
> 10-yr. change in suburban white population: -26,145
> Total metro area population: 2,000,468

7. San Francisco-Oakland-Berkeley, CA
> Suburban metro area residents who identify as nonwhite: 63.9%
> Largest suburban minority group: Asian American (28.1% of suburban pop.)
> 10-yr. change in suburban nonwhite population: +429,186
> 10-yr. change in suburban white population: -145,962
> Total metro area population: 4,749,008
[in-text-ad-2]
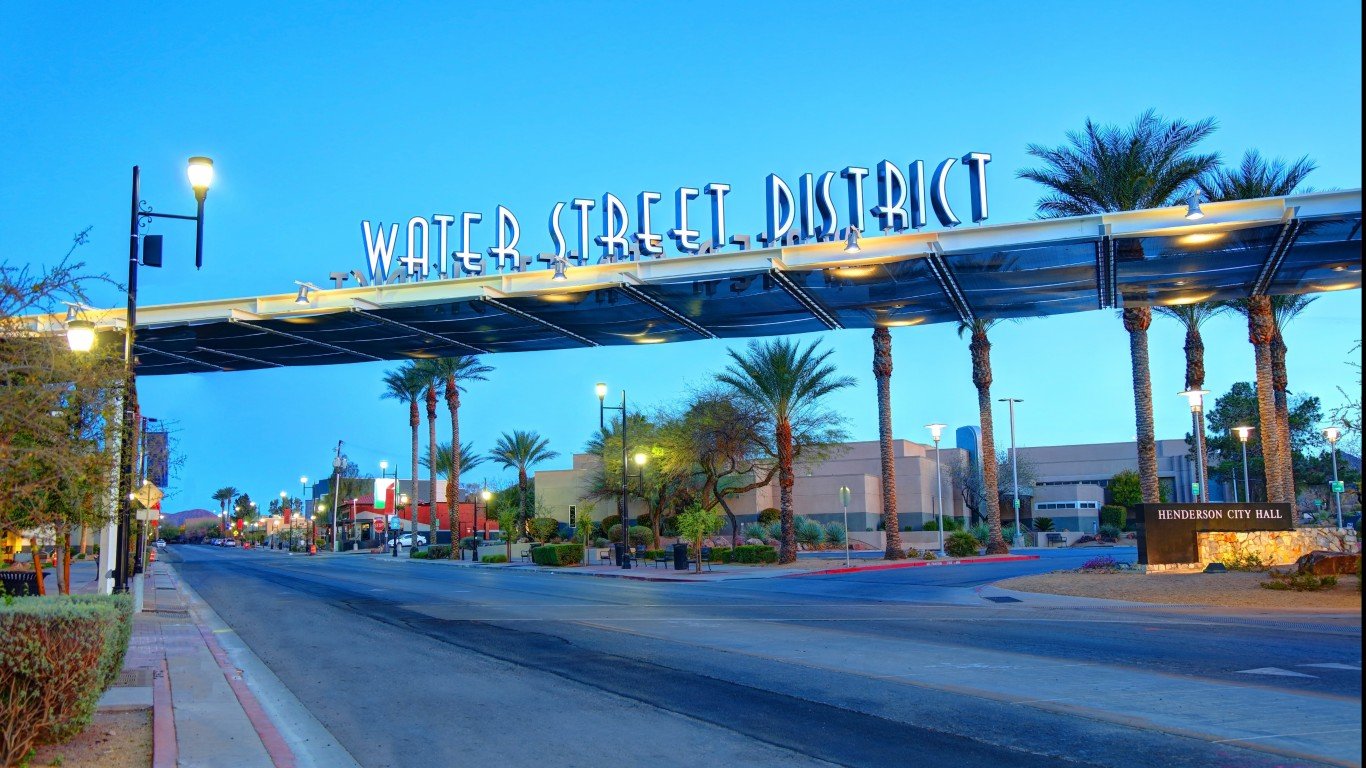
6. Las Vegas-Henderson-Paradise, NV
> Suburban metro area residents who identify as nonwhite: 66.2%
> Largest suburban minority group: Latino or Hispanic (32.9% of suburban pop.)
> 10-yr. change in suburban nonwhite population: +226,825
> 10-yr. change in suburban white population: +1,268
> Total metro area population: 2,265,461
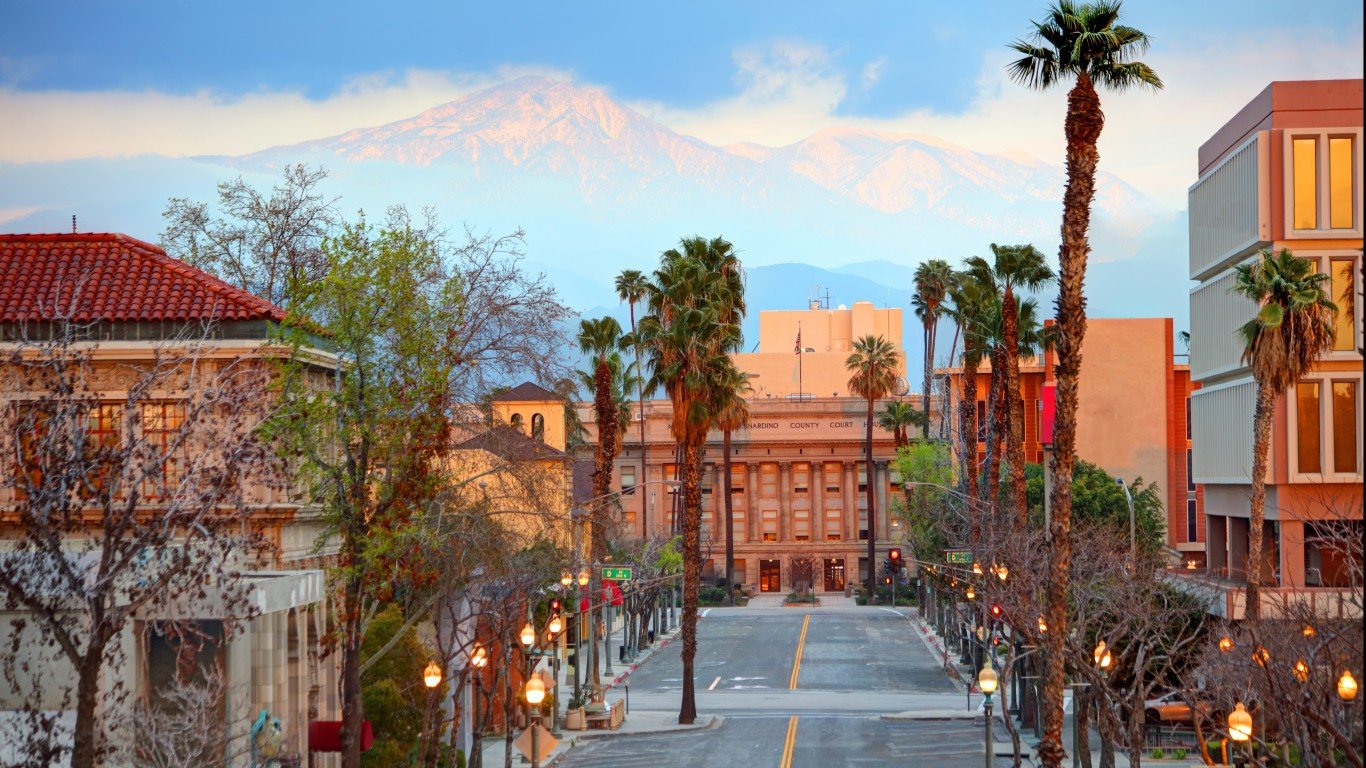
5. Riverside-San Bernardino-Ontario, CA
> Suburban metro area residents who identify as nonwhite: 68.8%
> Largest suburban minority group: Latino or Hispanic (49.6% of suburban pop.)
> 10-yr. change in suburban nonwhite population: +499,247
> 10-yr. change in suburban white population: -158,904
> Total metro area population: 4,599,839
[in-text-ad]
4. Fresno, CA
> Suburban metro area residents who identify as nonwhite: 69.5%
> Largest suburban minority group: Latino or Hispanic (57.2% of suburban pop.)
> 10-yr. change in suburban nonwhite population: +44,502
> 10-yr. change in suburban white population: -13,740
> Total metro area population: 1,008,654
[recirclink id=1141585]
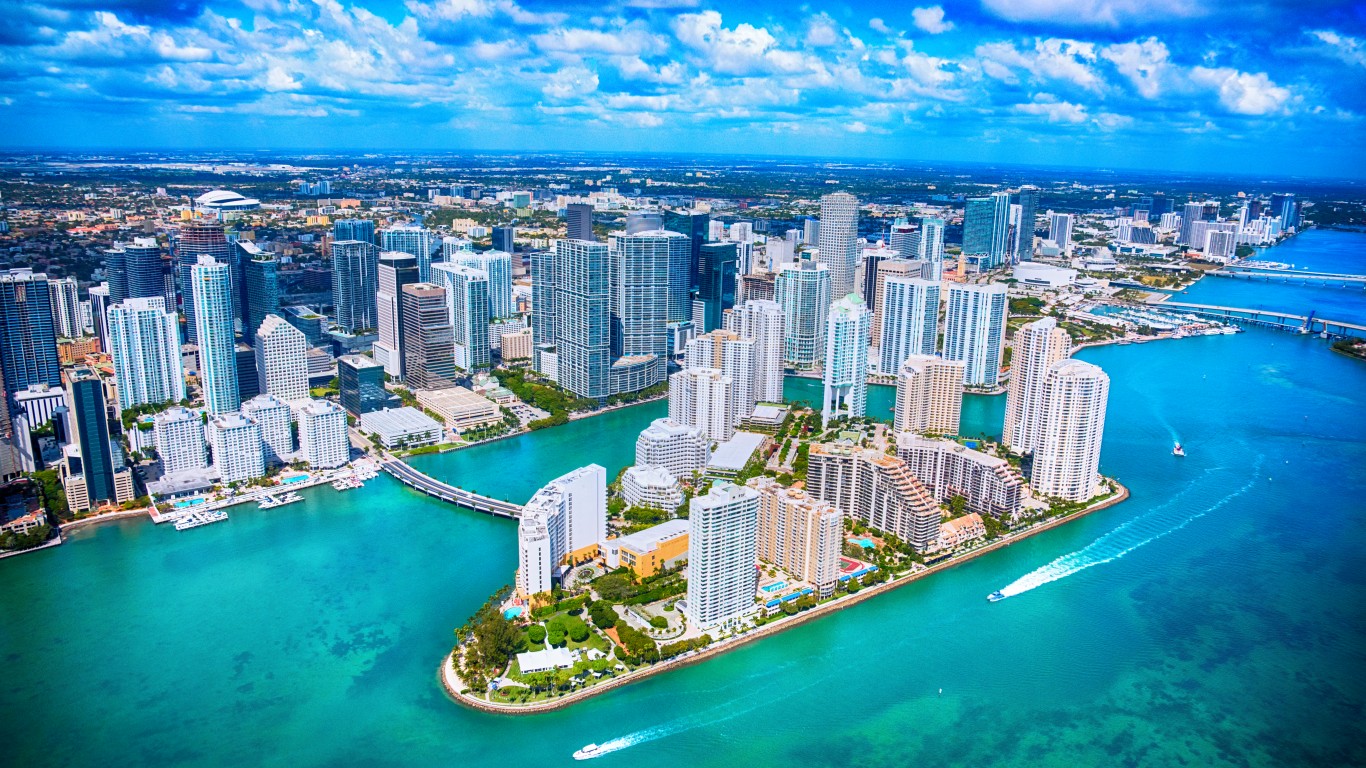
3. Miami-Fort Lauderdale-Pompano Beach, FL
> Suburban metro area residents who identify as nonwhite: 70.5%
> Largest suburban minority group: Latino or Hispanic (45.2% of suburban pop.)
> 10-yr. change in suburban nonwhite population: +663,452
> 10-yr. change in suburban white population: -161,978
> Total metro area population: 6,138,333

2. Los Angeles-Long Beach-Anaheim, CA
> Suburban metro area residents who identify as nonwhite: 71.3%
> Largest suburban minority group: Latino or Hispanic (43.3% of suburban pop.)
> 10-yr. change in suburban nonwhite population: +556,838
> 10-yr. change in suburban white population: -305,847
> Total metro area population: 13,200,998
[in-text-ad-2]
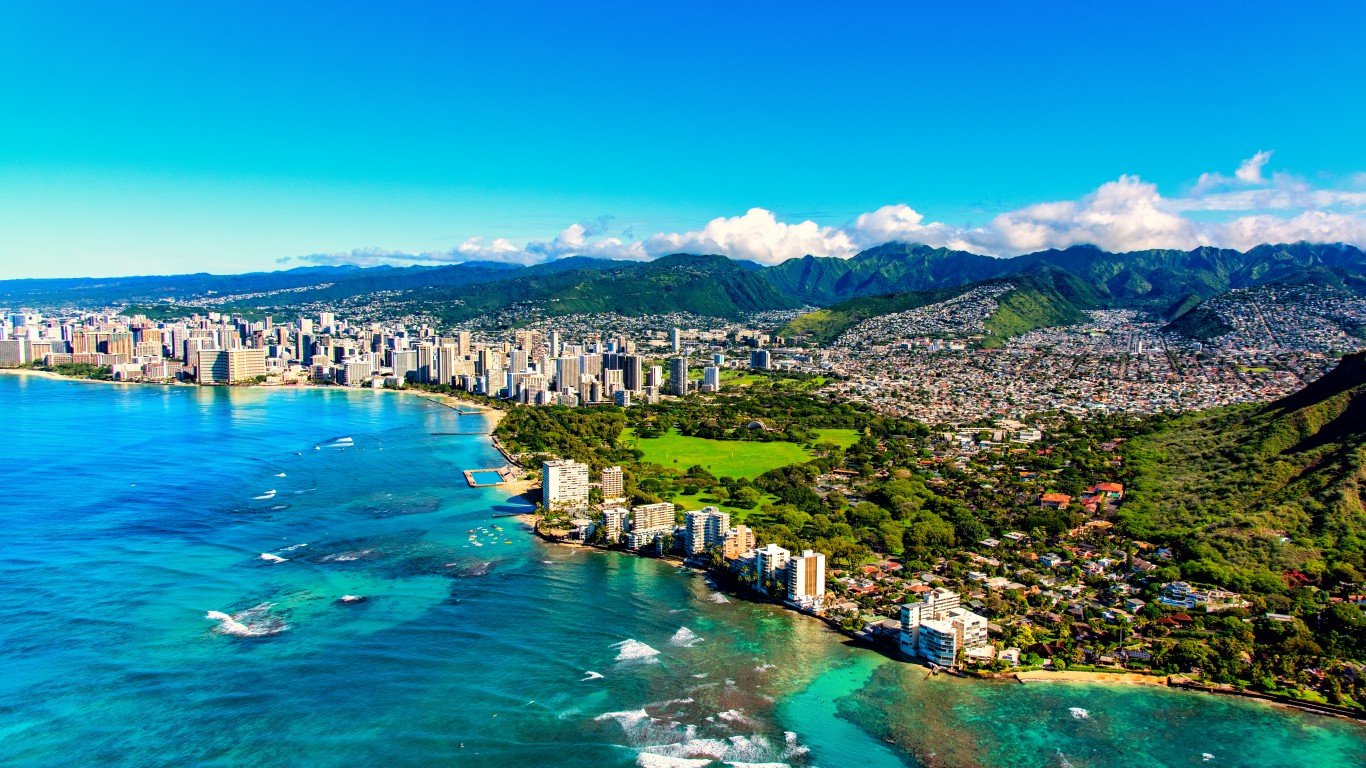
1. Honolulu, HI
> Suburban metro area residents who identify as nonwhite: 81.8%
> Largest suburban minority group: Asian American (46.8% of suburban pop.)
> 10-yr. change in suburban nonwhite population: +54,122
> 10-yr. change in suburban white population: -4,529
> Total metro area population: 1,016,508
Methodology
To identify the most racially diverse suburbs in the United States, 24/7 Wall St. reviewed a recent report from Brookings, a nonprofit public policy think tank, titled: Today’s suburbs are symbolic of America’s rising diversity: A 2020 census portrait.
Metro areas are ranked on the share of suburban residents who identify as a person of color, defined as those who identify as Latino or Hispanic, Black, Asian American, Native Hawaiian and Other Pacific Islander, American Indian/Alaska Native, two or more races, or other nonwhite racial groups. Only metro areas in which 40% or more of the suburban population identify as people of color rank on this list. All 56 U.S. metro areas with populations of at least 1 million as of the 2020 Decennial Census were considered.
Brookings defined suburbs as those areas in a metro area that lie outside the primary city or cities. All data in this story is from Brookings and the U.S. Census Bureau.
Contact [email protected] for any questions or corrections.