For the first time in the nation’s history, median monthly rents in the United States crossed the $2,000 mark. According to a report from real estate listing site Redfin, the median rent on all apartments listed nationwide rose 15% compared to a year ago. For those millions of Americans who do not have the stability afforded to them through homeownership, rising rent will take a serious financial toll.
Nationwide, 35.6% of housing units are occupied by renters. In 37 of the 50 states, there is at least one metro area with a higher rental rate.
To determine the metro with the highest rental rate in every state, 24/7 Wall St. reviewed five-year estimates of the share of housing units that are occupied by renters from the U.S. Census Bureau’s 2020 American Community Survey. Three states, Delaware, New Hampshire, Rhode Island, and Vermont, have only one metropolitan area, and so the metro area in these states is listed by default.
Young people are far more likely to rent homes than buy. Well over half of all renters in the United States are under the age of 35, whereas that age group accounts for less than 10% of homeowners. Many of the metropolitan areas on this list have such high shares of renters because they have younger populations.
According to the census, 23.2% of Americans are 18-34 years old. In all but four of the metro areas on this list, that age group accounts for a larger share of the population compared to the state figure. In the Manhattan, Kansas, metropolitan area, which has the highest rental rate in Kansas, 40.5% of the population are younger adults, the highest share in the state and the third highest in the country. This is the youngest county in every state.
Population density is a factor in the share of housing units that are rentals. In highly-urban areas, a large share of residents live in multi-story rental buildings, rather than single-family homes. The U.S. population density is 93.8 people per square mile. The vast majority of the metro areas on this list have higher population densities relative to their home state, and nine have population densities in excess of 1,000 people per square mile. The Los Angeles metro area, which has the highest rental rate in both the state and the country, has a population density of 2,720 per square mile. These are the 50 largest cities in America.
Click here to see the city where the highest share of homes are rented in every state
Click here to see our detailed methodology
Alabama: Auburn-Opelika
> Rental- occupied housing units: 36.6% (Alabama: 30.8%)
> Median rental cost: $856 (Alabama: $811)
> Median home value: $173,700 (Alabama: $149,600)
> Median household income: $52,930 (Alabama: $52,035)
> No. of metros considered in ranking: 12
[in-text-ad]

Alaska: Fairbanks
> Rental occupied housing units: 41.1% (Alaska: 35.2%)
> Median rental cost: $1,297 (Alaska: $1,240)
> Median home value: $240,300 (Alaska: $275,600)
> Median household income: $76,464 (Alaska: $77,790)
> No. of metros considered in ranking: 2
[recirclink id=1080770]

Arizona: Flagstaff
> Rental occupied housing units: 39.2% (Arizona: 34.7%)
> Median rental cost: $1,185 (Arizona: $1,097)
> Median home value: $299,100 (Arizona: $242,000)
> Median household income: $59,000 (Arizona: $61,529)
> No. of metros considered in ranking: 7

Arkansas: Jonesboro
> Rental occupied housing units: 41.9% (Arkansas: 34.2%)
> Median rental cost: $761 (Arkansas: $760)
> Median home value: $136,000 (Arkansas: $133,600)
> Median household income: $47,610 (Arkansas: $49,475)
> No. of metros considered in ranking: 6
[in-text-ad-2]

California: Los Angeles-Long Beach-Anaheim
> Rental occupied housing units: 51.3% (California: 44.7%)
> Median rental cost: $1,624 (California: $1,586)
> Median home value: $641,300 (California: $538,500)
> Median household income: $76,399 (California: $78,672)
> No. of metros considered in ranking: 26

Colorado: Boulder
> Rental occupied housing units: 36.4% (Colorado: 33.8%)
> Median rental cost: $1,582 (Colorado: $1,335)
> Median home value: $539,100 (Colorado: $369,900)
> Median household income: $87,476 (Colorado: $75,231)
> No. of metros considered in ranking: 7
[in-text-ad]

Connecticut: New Haven-Milford
> Rental occupied housing units: 37.9% (Connecticut: 33.9%)
> Median rental cost: $1,173 (Connecticut: $1,201)
> Median home value: $252,300 (Connecticut: $279,700)
> Median household income: $71,370 (Connecticut: $79,855)
> No. of metros considered in ranking: 4
[recirclink id=1090988]

Delaware: Dover
> Rental occupied housing units: 31.2% (Delaware: 28.6%)
> Median rental cost: $1,110 (Delaware: $1,150)
> Median home value: $226,600 (Delaware: $258,300)
> Median household income: $60,117 (Delaware: $69,110)
> No. of metros considered in ranking: 1
*Because Dover is the only eligible metro in Delaware, it is the metro with the highest rental rate by default.

Florida: Tallahassee
> Rental occupied housing units: 41.8% (Florida: 33.8%)
> Median rental cost: $990 (Florida: $1,218)
> Median home value: $187,400 (Florida: $232,000)
> Median household income: $53,423 (Florida: $57,703)
> No. of metros considered in ranking: 22
[in-text-ad-2]

Georgia: Hinesville
> Rental occupied housing units: 50.7% (Georgia: 36.0%)
> Median rental cost: $1,034 (Georgia: $1,042)
> Median home value: $133,000 (Georgia: $190,200)
> Median household income: $50,588 (Georgia: $61,224)
> No. of metros considered in ranking: 14

Hawaii: Urban Honolulu
> Rental occupied housing units: 42.5% (Hawaii: 39.7%)
> Median rental cost: $1,779 (Hawaii: $1,651)
> Median home value: $702,300 (Hawaii: $636,400)
> Median household income: $87,722 (Hawaii: $83,173)
> No. of metros considered in ranking: 2
[in-text-ad]

Idaho: Pocatello
> Rental occupied housing units: 31.7% (Idaho: 29.2%)
> Median rental cost: $702 (Idaho: $887)
> Median home value: $165,800 (Idaho: $235,600)
> Median household income: $51,914 (Idaho: $58,915)
> No. of metros considered in ranking: 6
[recirclink id=1093540]

Illinois: Champaign-Urbana
> Rental occupied housing units: 44.7% (Illinois: 33.7%)
> Median rental cost: $873 (Illinois: $1,038)
> Median home value: $163,900 (Illinois: $202,100)
> Median household income: $54,897 (Illinois: $68,428)
> No. of metros considered in ranking: 10

Indiana: Bloomington
> Rental occupied housing units: 41.7% (Indiana: 30.5%)
> Median rental cost: $931 (Indiana: $844)
> Median home value: $177,700 (Indiana: $148,900)
> Median household income: $52,226 (Indiana: $58,235)
> No. of metros considered in ranking: 12
[in-text-ad-2]

Iowa: Ames
> Rental occupied housing units: 40.3% (Iowa: 28.8%)
> Median rental cost: $909 (Iowa: $806)
> Median home value: $179,700 (Iowa: $153,900)
> Median household income: $60,442 (Iowa: $61,836)
> No. of metros considered in ranking: 8

Kansas: Manhattan
> Rental occupied housing units: 50.9% (Kansas: 33.8%)
> Median rental cost: $944 (Kansas: $863)
> Median home value: $180,500 (Kansas: $157,600)
> Median household income: $54,488 (Kansas: $61,091)
> No. of metros considered in ranking: 4
[in-text-ad]

Kentucky: Lexington-Fayette
> Rental occupied housing units: 40.2% (Kentucky: 32.4%)
> Median rental cost: $887 (Kentucky: $783)
> Median home value: $193,700 (Kentucky: $147,100)
> Median household income: $60,769 (Kentucky: $52,238)
> No. of metros considered in ranking: 5
[recirclink id=1094298]

Louisiana: Shreveport-Bossier City
> Rental occupied housing units: 37.1% (Louisiana: 33.4%)
> Median rental cost: $850 (Louisiana: $876)
> Median home value: $156,900 (Louisiana: $168,100)
> Median household income: $46,610 (Louisiana: $50,800)
> No. of metros considered in ranking: 9

Maine: Lewiston-Auburn
> Rental occupied housing units: 35.1% (Maine: 27.1%)
> Median rental cost: $771 (Maine: $873)
> Median home value: $166,600 (Maine: $198,000)
> Median household income: $55,002 (Maine: $59,489)
> No. of metros considered in ranking: 3
[in-text-ad-2]

Maryland: Baltimore-Columbia-Towson
> Rental occupied housing units: 33.4% (Maryland: 32.9%)
> Median rental cost: $1,324 (Maryland: $1,415)
> Median home value: $307,200 (Maryland: $325,400)
> Median household income: $83,811 (Maryland: $87,063)
> No. of metros considered in ranking: 5

Massachusetts: Boston-Cambridge-Newton
> Rental occupied housing units: 38.3% (Massachusetts: 37.5%)
> Median rental cost: $1,555 (Massachusetts: $1,336)
> Median home value: $461,500 (Massachusetts: $398,800)
> Median household income: $93,537 (Massachusetts: $84,385)
> No. of metros considered in ranking: 5
[in-text-ad]

Michigan: Ann Arbor
> Rental occupied housing units: 38.5% (Michigan: 28.3%)
> Median rental cost: $1,161 (Michigan: $892)
> Median home value: $278,500 (Michigan: $162,600)
> Median household income: $75,730 (Michigan: $59,234)
> No. of metros considered in ranking: 14
[recirclink id=1096547]

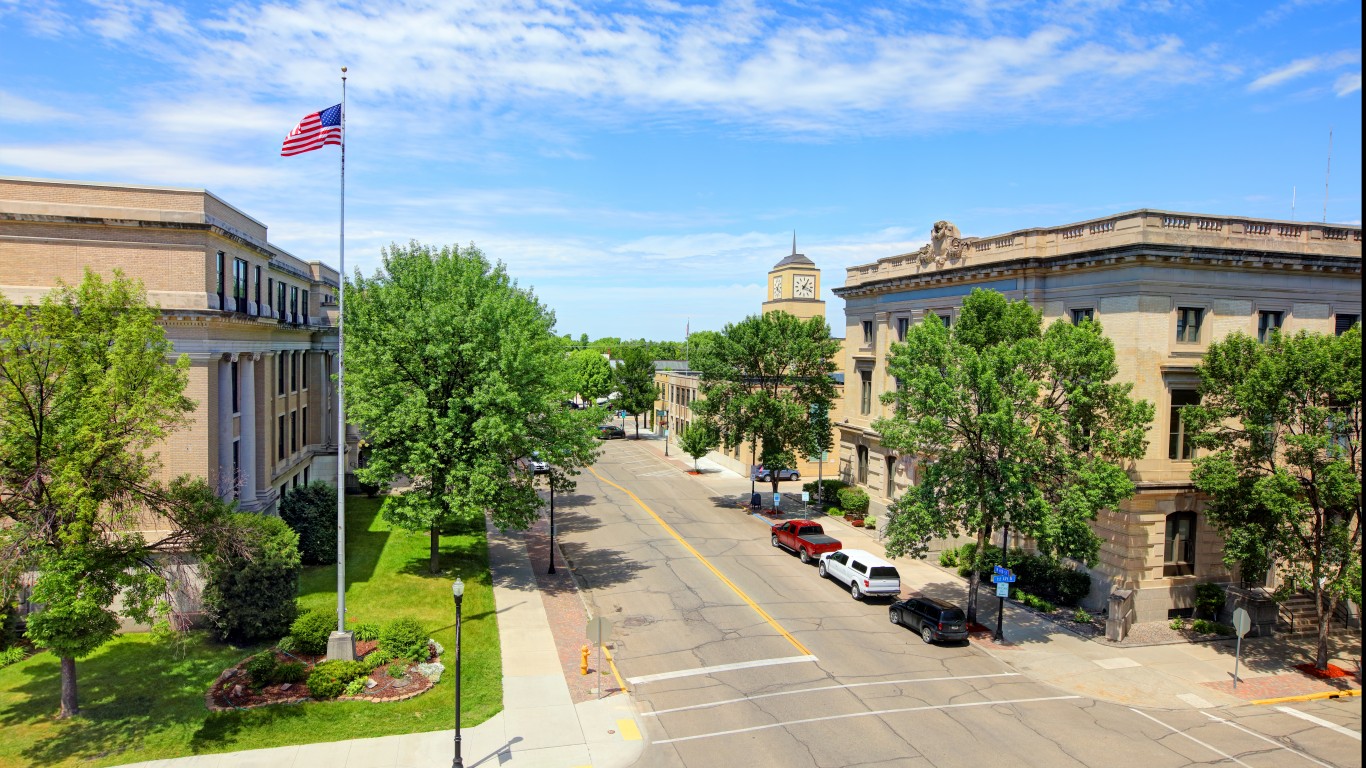
Minnesota: Mankato
> Rental occupied housing units: 34.7% (Minnesota: 28.1%)
> Median rental cost: $898 (Minnesota: $1,010)
> Median home value: $198,100 (Minnesota: $235,700)
> Median household income: $63,288 (Minnesota: $73,382)
> No. of metros considered in ranking: 5

Mississippi: Hattiesburg
> Rental occupied housing units: 34.9% (Mississippi: 31.2%)
> Median rental cost: $815 (Mississippi: $789)
> Median home value: $135,600 (Mississippi: $125,500)
> Median household income: $48,231 (Mississippi: $46,511)
> No. of metros considered in ranking: 3
[in-text-ad-2]

Missouri: Columbia
> Rental occupied housing units: 41.6% (Missouri: 32.9%)
> Median rental cost: $875 (Missouri: $843)
> Median home value: $189,900 (Missouri: $163,600)
> Median household income: $57,980 (Missouri: $57,290)
> No. of metros considered in ranking: 8

Montana: Missoula
> Rental occupied housing units: 41.4% (Montana: 31.5%)
> Median rental cost: $908 (Montana: $836)
> Median home value: $302,200 (Montana: $244,900)
> Median household income: $56,247 (Montana: $56,539)
> No. of metros considered in ranking: 3
[in-text-ad]

Nebraska: Lincoln
> Rental occupied housing units: 40.2% (Nebraska: 33.8%)
> Median rental cost: $870 (Nebraska: $857)
> Median home value: $188,700 (Nebraska: $164,000)
> Median household income: $62,883 (Nebraska: $63,015)
> No. of metros considered in ranking: 3
[recirclink id=1080770]

Nevada: Las Vegas-Henderson-Paradise
> Rental occupied housing units: 45.2% (Nevada: 42.9%)
> Median rental cost: $1,181 (Nevada: $1,159)
> Median home value: $285,100 (Nevada: $290,200)
> Median household income: $61,048 (Nevada: $62,043)
> No. of metros considered in ranking: 3

New Hampshire: Manchester-Nashua
> Rental occupied housing units: 34.3% (New Hampshire: 28.8%)
> Median rental cost: $1,217 (New Hampshire: $1,145)
> Median home value: $287,900 (New Hampshire: $272,300)
> Median household income: $82,099 (New Hampshire: $77,923)
> No. of metros considered in ranking: 1
*Because Manchester-Nashua is the only eligible metro in New Hampshire, it is the metro with the highest rental rate by default.
[in-text-ad-2]

New Jersey: Trenton-Princeton
> Rental occupied housing units: 36.5% (New Jersey: 36.0%)
> Median rental cost: $1,311 (New Jersey: $1,368)
> Median home value: $290,100 (New Jersey: $343,500)
> Median household income: $83,306 (New Jersey: $85,245)
> No. of metros considered in ranking: 4
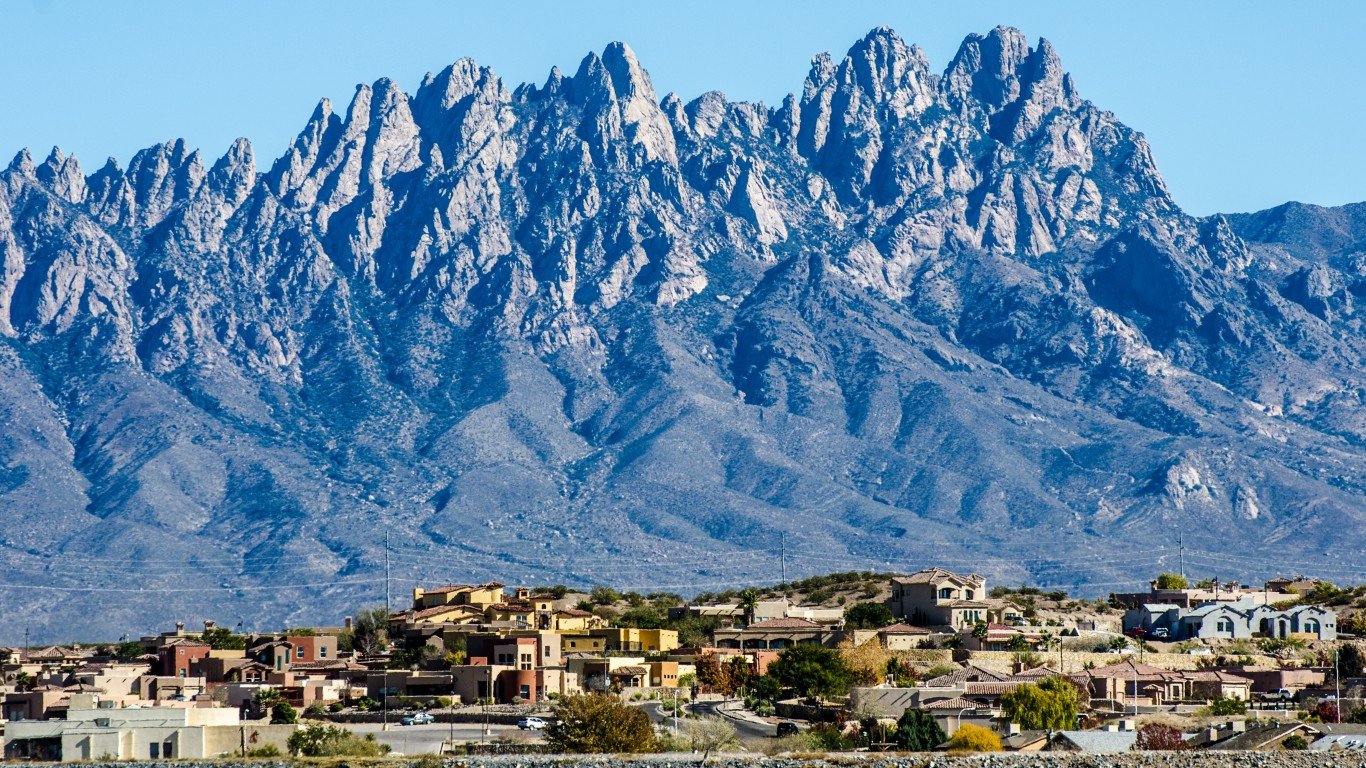
New Mexico: Las Cruces
> Rental occupied housing units: 35.4% (New Mexico: 32.0%)
> Median rental cost: $765 (New Mexico: $857)
> Median home value: $153,600 (New Mexico: $175,700)
> Median household income: $44,024 (New Mexico: $51,243)
> No. of metros considered in ranking: 4
[in-text-ad]

New York: New York-Newark-Jersey City
> Rental occupied housing units: 48.4% (New York: 45.9%)
> Median rental cost: $1,483 (New York: $1,315)
> Median home value: $465,400 (New York: $325,000)
> Median household income: $81,951 (New York: $71,117)
> No. of metros considered in ranking: 13
[recirclink id=1090988]

North Carolina: Greenville
> Rental occupied housing units: 47.4% (North Carolina: 34.3%)
> Median rental cost: $793 (North Carolina: $932)
> Median home value: $146,700 (North Carolina: $182,100)
> Median household income: $49,337 (North Carolina: $56,642)
> No. of metros considered in ranking: 15
North Dakota: Grand Forks
> Rental occupied housing units: 44.8% (North Dakota: 37.5%)
> Median rental cost: $804 (North Dakota: $828)
> Median home value: $195,500 (North Dakota: $199,900)
> Median household income: $55,122 (North Dakota: $65,315)
> No. of metros considered in ranking: 3
[in-text-ad-2]

Ohio: Columbus
> Rental occupied housing units: 38.2% (Ohio: 33.7%)
> Median rental cost: $981 (Ohio: $825)
> Median home value: $195,900 (Ohio: $151,400)
> Median household income: $66,715 (Ohio: $58,116)
> No. of metros considered in ranking: 11

Oklahoma: Lawton
> Rental occupied housing units: 45.6% (Oklahoma: 33.9%)
> Median rental cost: $810 (Oklahoma: $818)
> Median home value: $121,500 (Oklahoma: $142,400)
> Median household income: $52,219 (Oklahoma: $53,840)
> No. of metros considered in ranking: 4
[in-text-ad]

Oregon: Corvallis
> Rental occupied housing units: 43.2% (Oregon: 37.2%)
> Median rental cost: $1,145 (Oregon: $1,173)
> Median home value: $357,900 (Oregon: $336,700)
> Median household income: $65,142 (Oregon: $65,667)
> No. of metros considered in ranking: 8
[recirclink id=1093540]

Pennsylvania: State College
> Rental occupied housing units: 37.5% (Pennsylvania: 31.0%)
> Median rental cost: $1,019 (Pennsylvania: $958)
> Median home value: $242,700 (Pennsylvania: $187,500)
> Median household income: $61,921 (Pennsylvania: $63,627)
> No. of metros considered in ranking: 18

Rhode Island: Providence-Warwick
> Rental occupied housing units: 38.0% (Rhode Island: 38.4%)
> Median rental cost: $993 (Rhode Island: $1,031)
> Median home value: $290,500 (Rhode Island: $276,600)
> Median household income: $70,676 (Rhode Island: $70,305)
> No. of metros considered in ranking: 1
*Because Providence-Warwick is the only eligible metro in Rhode Island, it is the metro with the highest rental rate by default.
[in-text-ad-2]

South Carolina: Charleston-North Charleston
> Rental occupied housing units: 33.2% (South Carolina: 29.9%)
> Median rental cost: $1,197 (South Carolina: $918)
> Median home value: $249,800 (South Carolina: $170,100)
> Median household income: $65,894 (South Carolina: $54,864)
> No. of metros considered in ranking: 8

South Dakota: Sioux Falls
> Rental occupied housing units: 33.8% (South Dakota: 32.0%)
> Median rental cost: $836 (South Dakota: $761)
> Median home value: $208,400 (South Dakota: $174,600)
> Median household income: $67,713 (South Dakota: $59,896)
> No. of metros considered in ranking: 2
[in-text-ad]

Tennessee: Clarksville
> Rental occupied housing units: 40.7% (Tennessee: 33.5%)
> Median rental cost: $920 (Tennessee: $897)
> Median home value: $165,100 (Tennessee: $177,600)
> Median household income: $54,911 (Tennessee: $54,833)
> No. of metros considered in ranking: 10
[recirclink id=1094298]

Texas: College Station-Bryan
> Rental occupied housing units: 48.9% (Texas: 37.7%)
> Median rental cost: $954 (Texas: $1,082)
> Median home value: $201,900 (Texas: $187,200)
> Median household income: $51,261 (Texas: $63,826)
> No. of metros considered in ranking: 25

Utah: Logan
> Rental occupied housing units: 35.3% (Utah: 29.5%)
> Median rental cost: $839 (Utah: $1,090)
> Median home value: $252,800 (Utah: $305,400)
> Median household income: $60,466 (Utah: $74,197)
> No. of metros considered in ranking: 5
[in-text-ad-2]

Vermont: Burlington-South Burlington
> Rental occupied housing units: 33.2% (Vermont: 28.7%)
> Median rental cost: $1,248 (Vermont: $999)
> Median home value: $285,200 (Vermont: $230,900)
> Median household income: $73,447 (Vermont: $63,477)
> No. of metros considered in ranking: 1
*Because Burlington-South Burlington is the only eligible metro in Vermont, it is the metro with the highest rental rate by default.
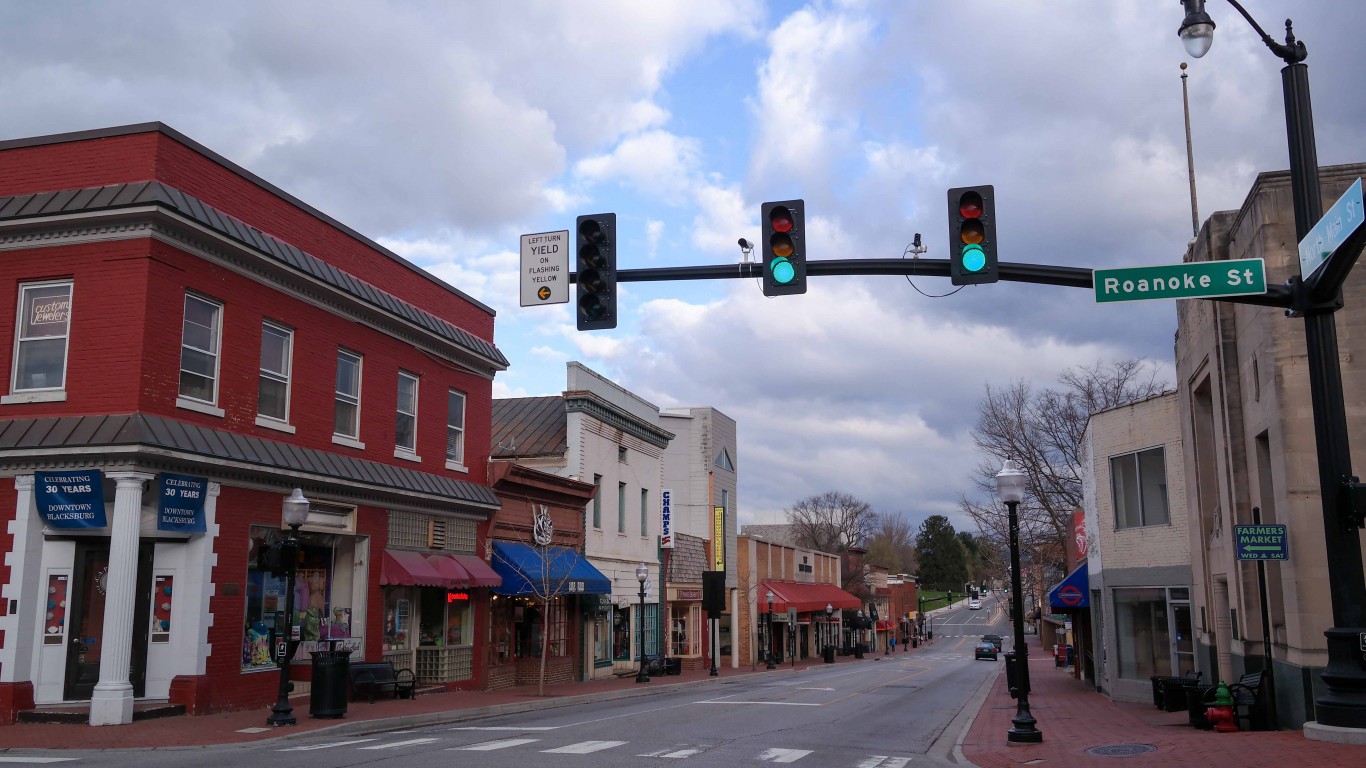
Virginia: Blacksburg-Christiansburg
> Rental occupied housing units: 39.7% (Virginia: 33.3%)
> Median rental cost: $905 (Virginia: $1,257)
> Median home value: $189,300 (Virginia: $282,800)
> Median household income: $55,475 (Virginia: $76,398)
> No. of metros considered in ranking: 9
[in-text-ad]

Washington: Seattle-Tacoma-Bellevue
> Rental occupied housing units: 39.8% (Washington: 36.7%)
> Median rental cost: $1,589 (Washington: $1,337)
> Median home value: $471,900 (Washington: $366,800)
> Median household income: $90,790 (Washington: $77,006)
> No. of metros considered in ranking: 11
[recirclink id=1096547]

West Virginia: Morgantown
> Rental occupied housing units: 36.4% (West Virginia: 26.3%)
> Median rental cost: $831 (West Virginia: $732)
> Median home value: $181,600 (West Virginia: $123,200)
> Median household income: $53,681 (West Virginia: $48,037)
> No. of metros considered in ranking: 7

Wisconsin: Milwaukee-Waukesha
> Rental occupied housing units: 40.2% (Wisconsin: 32.9%)
> Median rental cost: $917 (Wisconsin: $872)
> Median home value: $223,700 (Wisconsin: $189,200)
> Median household income: $63,739 (Wisconsin: $63,293)
> No. of metros considered in ranking: 12
[in-text-ad-2]
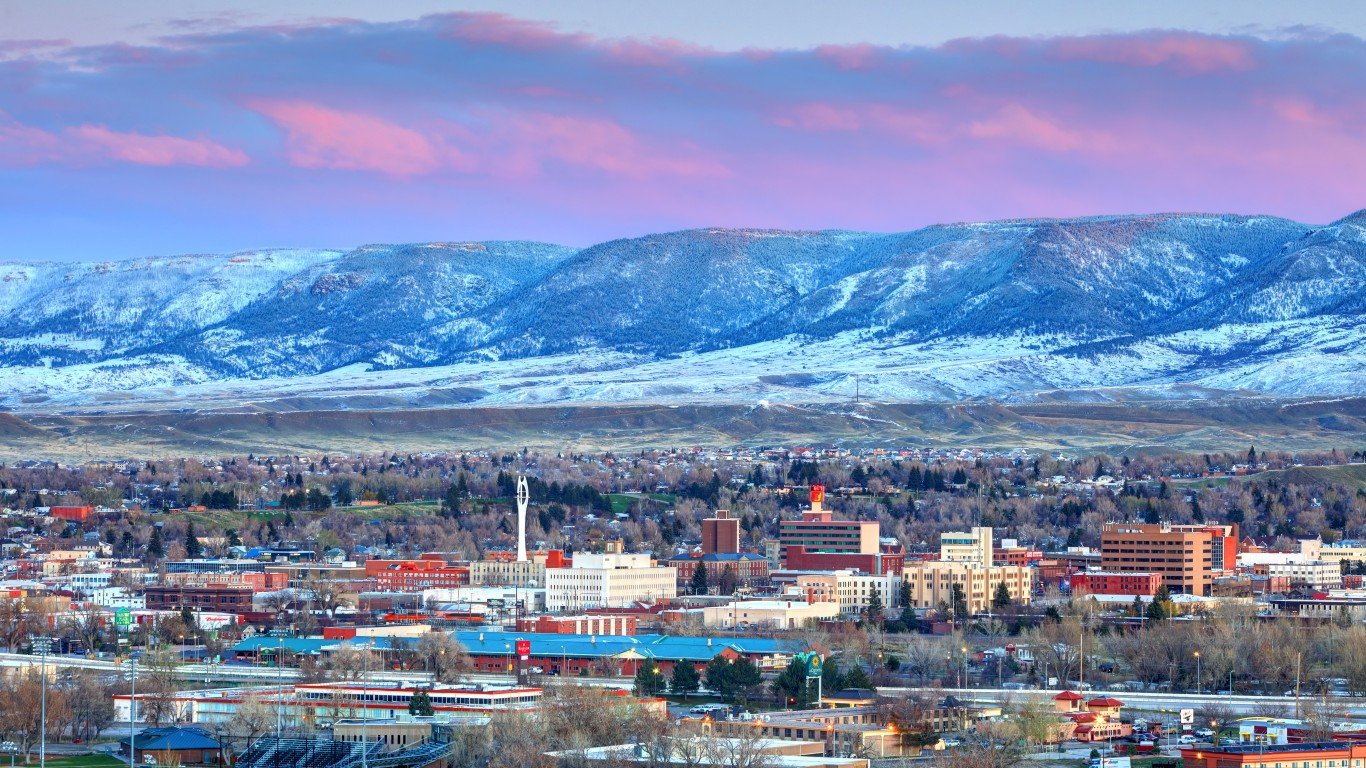
Wyoming: Casper
> Rental occupied housing units: 29.4% (Wyoming: 29.0%)
> Median rental cost: $846 (Wyoming: $853)
> Median home value: $215,400 (Wyoming: $228,000)
> Median household income: $62,168 (Wyoming: $65,304)
> No. of metros considered in ranking: 2
Methodology
To determine the metro with the highest rental rate in every state, 24/7 Wall St. reviewed five-year estimates of the share of housing units that are occupied by renters from the U.S. Census Bureau’s 2020 American Community Survey.
We used the 384 metropolitan statistical areas as delineated by the United States Office of Management and Budget and used by the Census Bureau as our definition of metros.
Metros were excluded if rental rates were not available in the 2020 ACS, if there were fewer than 1,000 housing units, or if the sampling error associated with a metro’s data was deemed too high.
The sampling error was defined as too high if the coefficient of variation — a statistical assessment of how reliable an estimate is — for a metro’s rental rate was above 15% and greater than two standard deviations above the mean CV for all metros’ rental rates. We similarly excluded metros that had a sampling error too high for their population, using the same definition.
Metros were ranked based on the percentage of housing units that are occupied by renters. To break ties, we used the number of housing units that are occupied by renters.
Additional information on median rental cost, median home value, and median household income are also five-year estimates from the 2020 ACS. Because the Census Bureau didn’t release one-year estimates for 2020 due to data collection issues caused by the COVID-19 pandemic, all ACS data are five-year estimates.
Contact [email protected] for any questions or corrections.