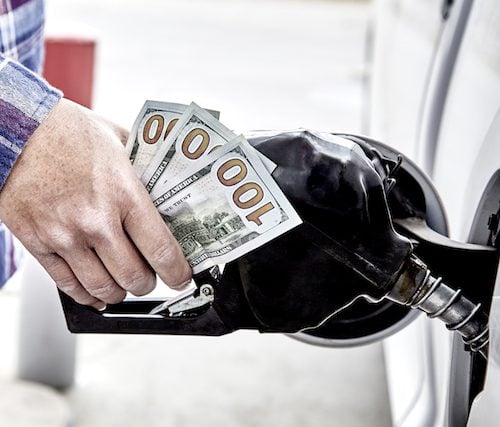
Gas prices across the nation reached levels unheard of in recent years, and they have become a topic of contention. Only a year ago, gas prices were just above the $2 per gallon mark, but since then we have seen them rise as high as $5 and more in some states. Only recently has there been a slight pullback in gas prices. Gas prices have been high before, of course.
In fact, economic cycles, supply and demand, and even war have contributed to higher and lower gas prices over the years.
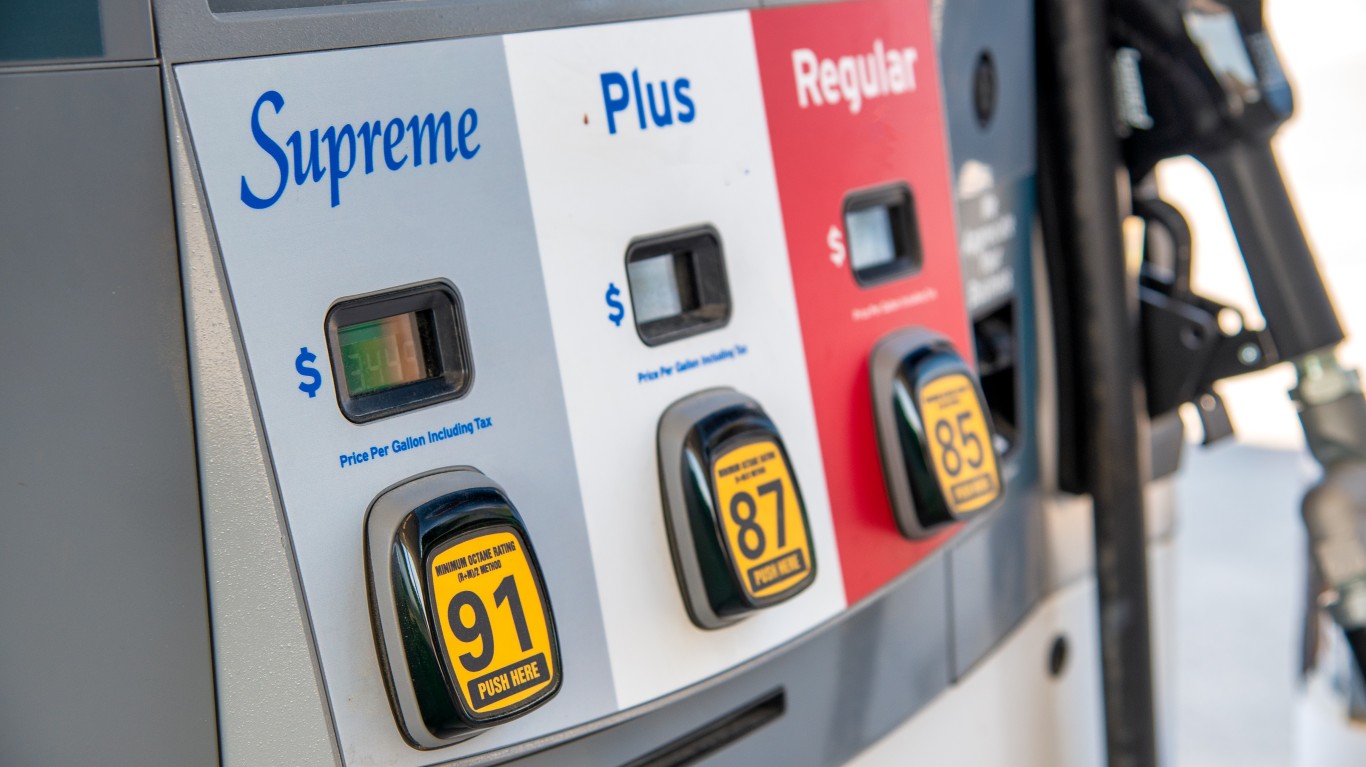
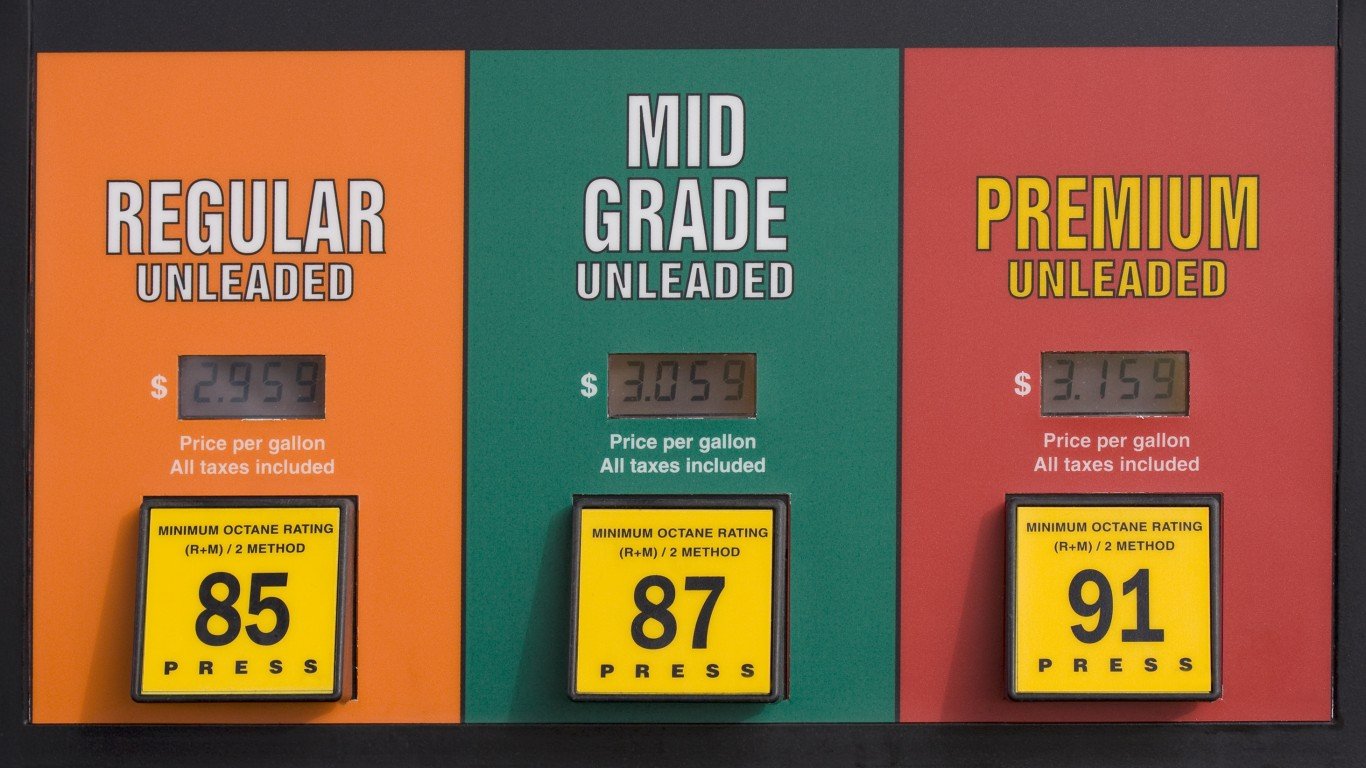
How much Americans actually pay at the pump depends on several factors, namely, the price of crude oil, which is determined in large part by global supply and demand. Other variables affecting the price of a gallon of gasoline include transportation and refining costs and taxes.
Often geopolitical concerns affect the price of crude. Recently, a key driver of global oil prices has been the ongoing war in Ukraine following Russia’s invasion of the country. It begs the question of what comes next. For comparison, here’s how every war in U.S. history ended.
While Ukraine is thousands of miles away, the war has far-reaching effects and reaches Americans at their local gas pump. The war has also contributed to surging prices of other commodities, leading to inflation in many countries, including the U.S., where the consumer price index grew at historic levels in recent months. In the past few weeks, oil prices fell, leading to an easing in inflation in July. (See, the price of this household item is soaring.)
Some are blaming the current administration for the high gas prices and high inflation, while others are pointing the finger abroad. Regardless of the culpability, it is indisputable that gas prices, though slightly cheaper than a few weeks ago, are very high historically.
To find the cost of gas each year since 1990, 24/7 Wall St. reviewed annual average gas prices nationwide each year from the Energy Information Administration. All data is from the EIA.
Click here to see the price of gas every year since 1990.
1990
> 3-month average gas price (per gallon): $1.306 – partial year avg., not ranked
> Peak price: $1.335 in Oct
[in-text-ad]

1991
> 11-month average gas price (per gallon): $1.095 – partial year avg., not ranked
> Peak price: $1.128 in June
[recirclink id=1159452]

1992
> Average gas price (per gallon): $1.087 – #27 highest
> Peak price: $1.145 in June

1993
> Average gas price (per gallon): $1.067 – #29 highest
> Peak price: $1.100 in May
[in-text-ad-2]

1994
> Average gas price (per gallon): $1.075 – #28 highest
> Peak price: $1.155 in August

1995
> Average gas price (per gallon): $1.111 – #26 highest
> Peak price: $1.192 in June
[in-text-ad]

1996
> Average gas price (per gallon): $1.199 – #23 highest
> Peak price: $1.279 in May
[recirclink id=1160474]

1997
> Average gas price (per gallon): $1.199 – #23 highest
> Peak price: $1.236 in January

1998
> Average gas price (per gallon): $1.030 – #30 highest
> Peak price: $1.086 in January
[in-text-ad-2]

1999
> Average gas price (per gallon): $1.136 – #25 highest
> Peak price: $1.273 in December
2000
> Average gas price (per gallon): $1.484 – #20 highest
> Peak price: $1.633 in June
[in-text-ad]

2001
> Average gas price (per gallon): $1.420 – #21 highest
> Peak price: $1.702 in May
[recirclink id=1159452]

2002
> Average gas price (per gallon): $1.345 – #22 highest
> Peak price: $1.445 in Oct
2003
> Average gas price (per gallon): $1.561 – #19 highest
> Peak price: $1.693 in March
[in-text-ad-2]

2004
> Average gas price (per gallon): $1.852 – #18 highest
> Peak price: $2.000 in October

2005
> Average gas price (per gallon): $2.270 – #15 highest
> Peak price: $2.903 in September
[in-text-ad]

2006
> Average gas price (per gallon): $2.572 – #11 highest
> Peak price: $2.981 in July
[recirclink id=1159452]

2007
> Average gas price (per gallon): $2.796 – #7 highest
> Peak price: $3.146 in May
2008
> Average gas price (per gallon): $3.246 – #5 highest
> Peak price: $4.062 in July
[in-text-ad-2]

2009
> Average gas price (per gallon): $2.353 – #14 highest
> Peak price: $2.651 in November

2010
> Average gas price (per gallon): $2.782 – #8 highest
> Peak price: $2.993 in December
[in-text-ad]

2011
> Average gas price (per gallon): $3.521 – #2 highest
> Peak price: $3.906 in May
[recirclink id=1159452]

2012
> Average gas price (per gallon): $3.618 – #1 highest
> Peak price: $3.900 in April

2013
> Average gas price (per gallon): $3.505 – #3 highest
> Peak price: $3.711 in March
[in-text-ad-2]

2014
> Average gas price (per gallon): $3.358 – #4 highest
> Peak price: $3.692 in June
2015
> Average gas price (per gallon): $2.429 – #12 highest
> Peak price: $2.802 in June
[in-text-ad]

2016
> Average gas price (per gallon): $2.143 – #17 highest
> Peak price: $2.366 in June
[recirclink id=1160474]
2017
> Average gas price (per gallon): $2.415 – #13 highest
> Peak price: $2.645 in September

2018
> Average gas price (per gallon): $2.719 – #9 highest
> Peak price: $2.901 in May
[in-text-ad-2]

2019
> Average gas price (per gallon): $2.604 – #10 highest
> Peak price: $2.859 in May

2020
> Average gas price (per gallon): $2.168 – #16 highest
> Peak price: $2.548 in January
[in-text-ad]

2021
> Average gas price (per gallon): $3.008 – #6 highest
> Peak price: $3.395 in November
[recirclink id=1159452]

2022
> 7-month average gas price (per gallon): $4.453 – partial year, not ranked
> Peak price: $4.929 in June
Contact [email protected] for any questions or corrections.