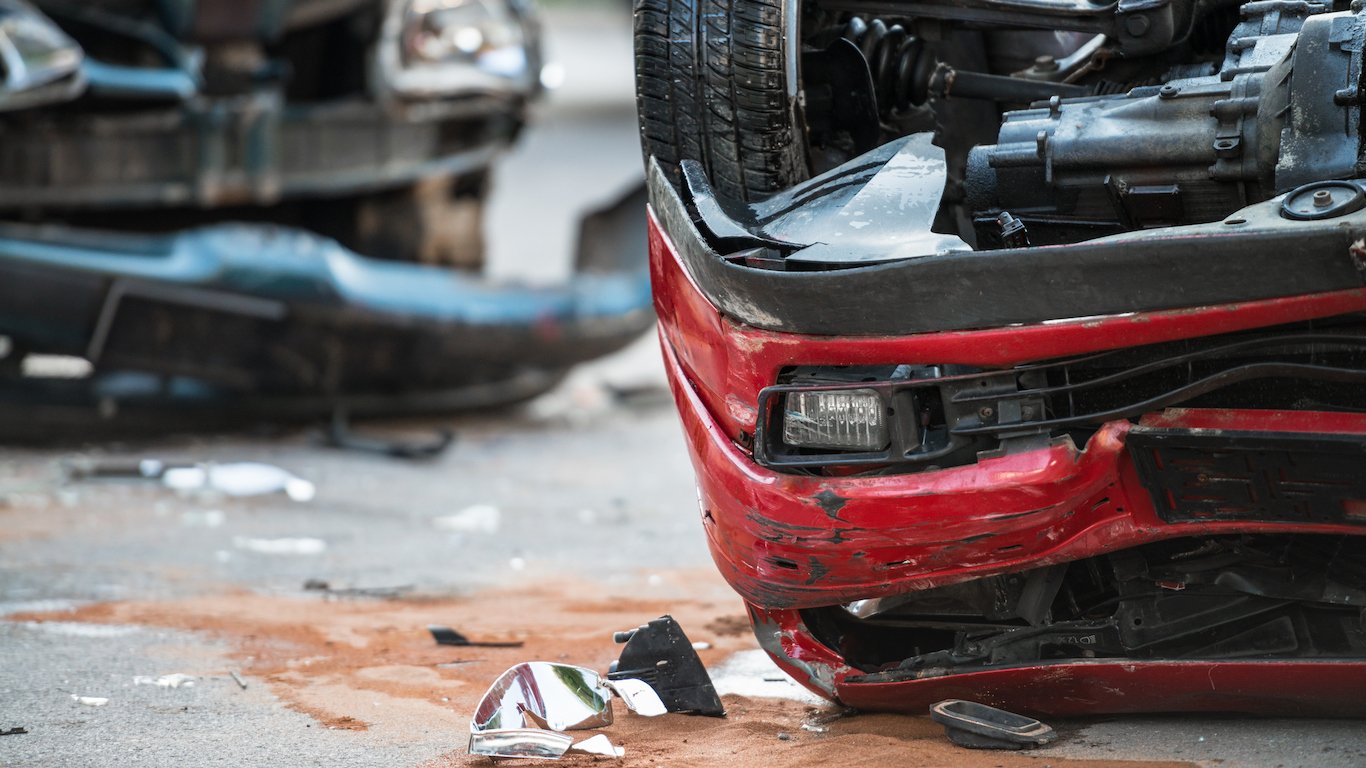
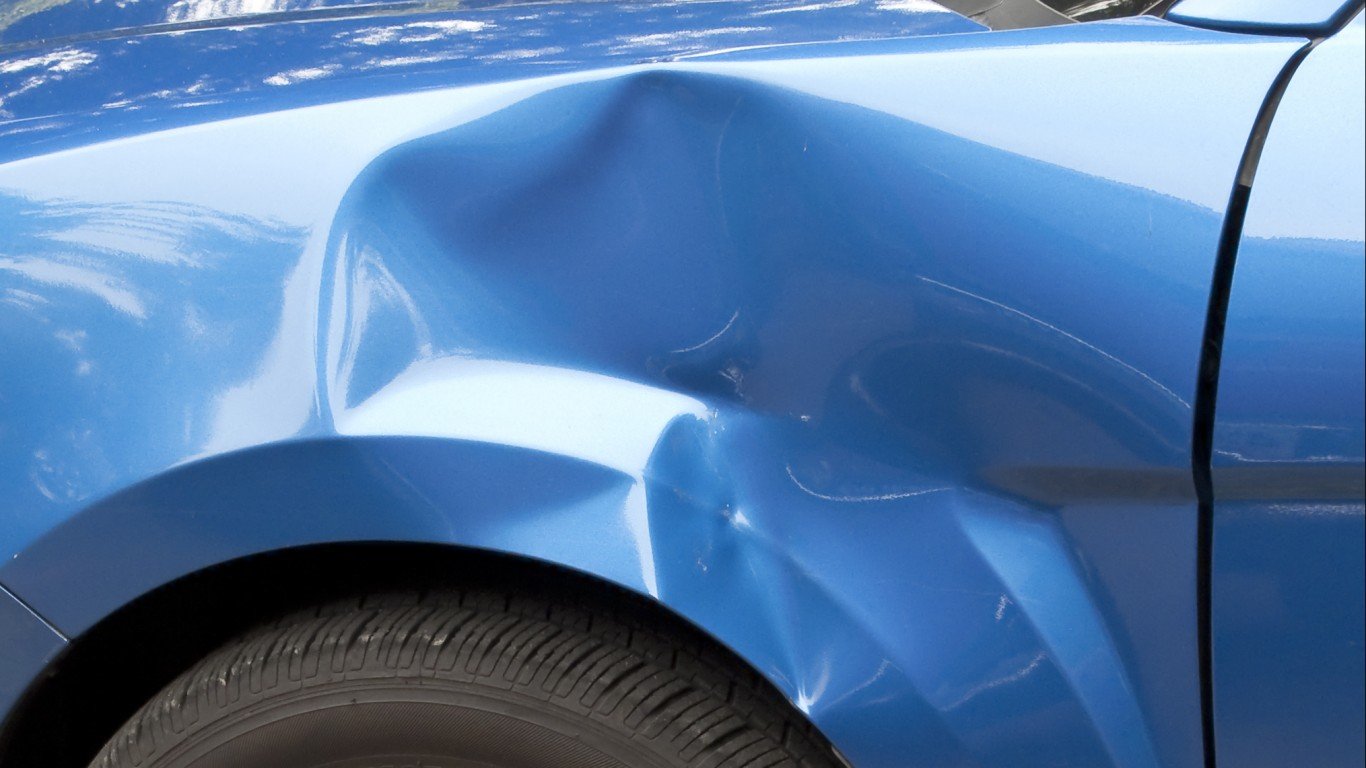
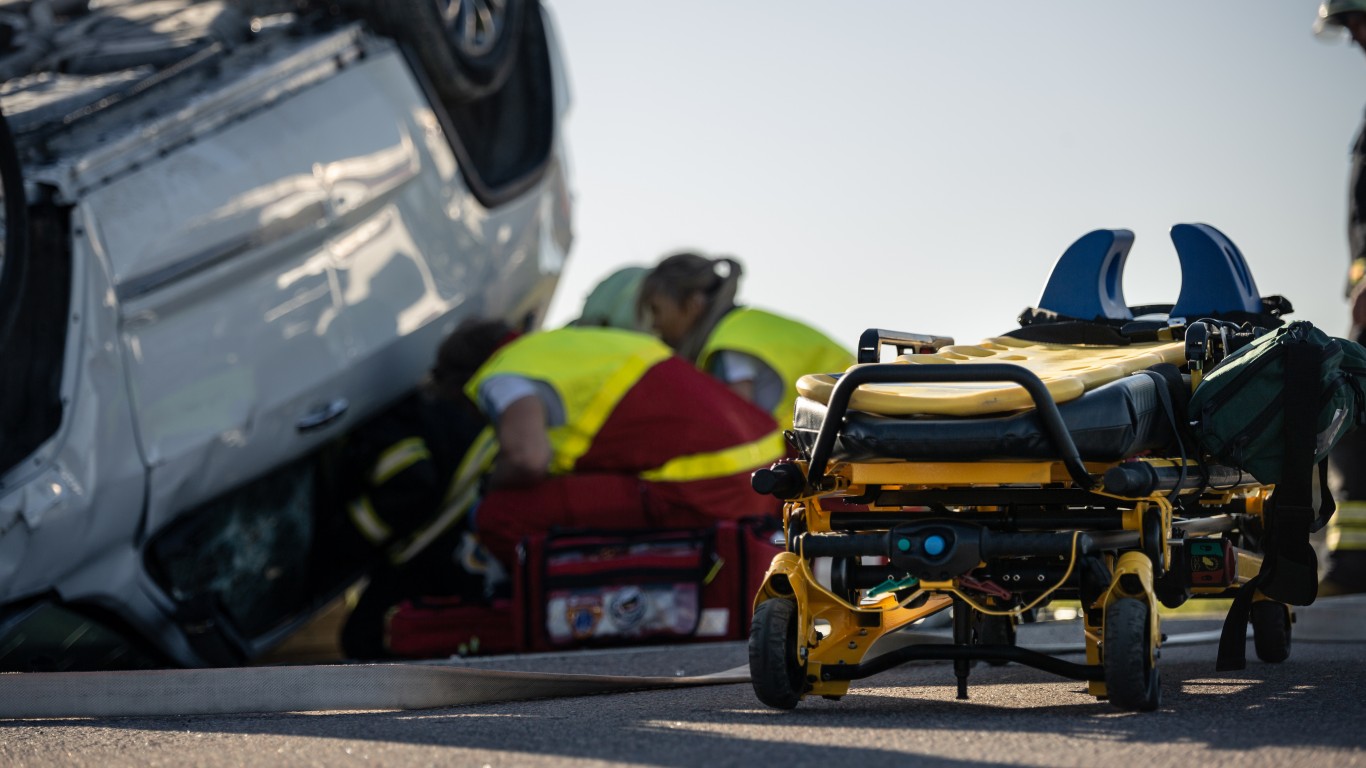
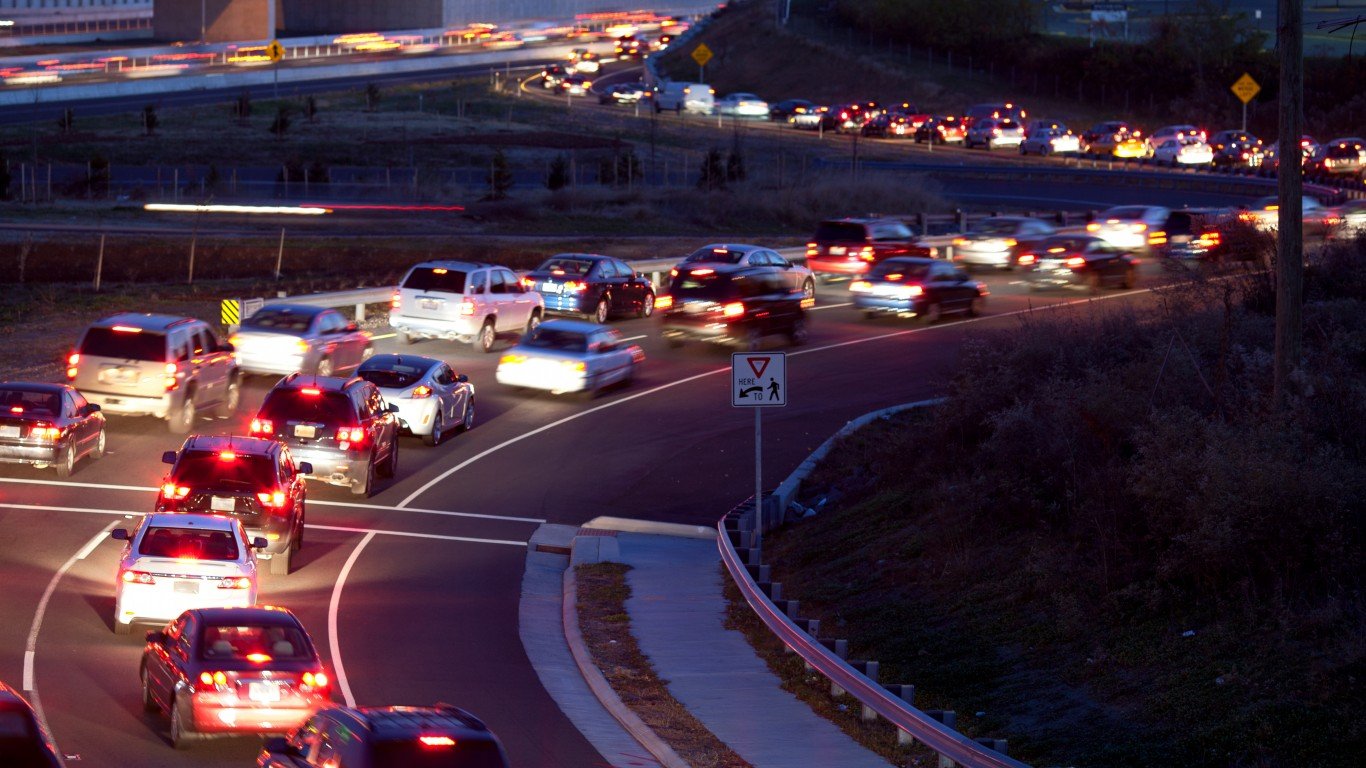
There are millions of auto accidents across the U.S. each year. Over the last decade, there were more than 6 million auto accidents on average per year. While even minor bumps or scratches can be a major hassle to repair, more major crashes put drivers, passengers, and pedestrians at risk of serious injury or death.
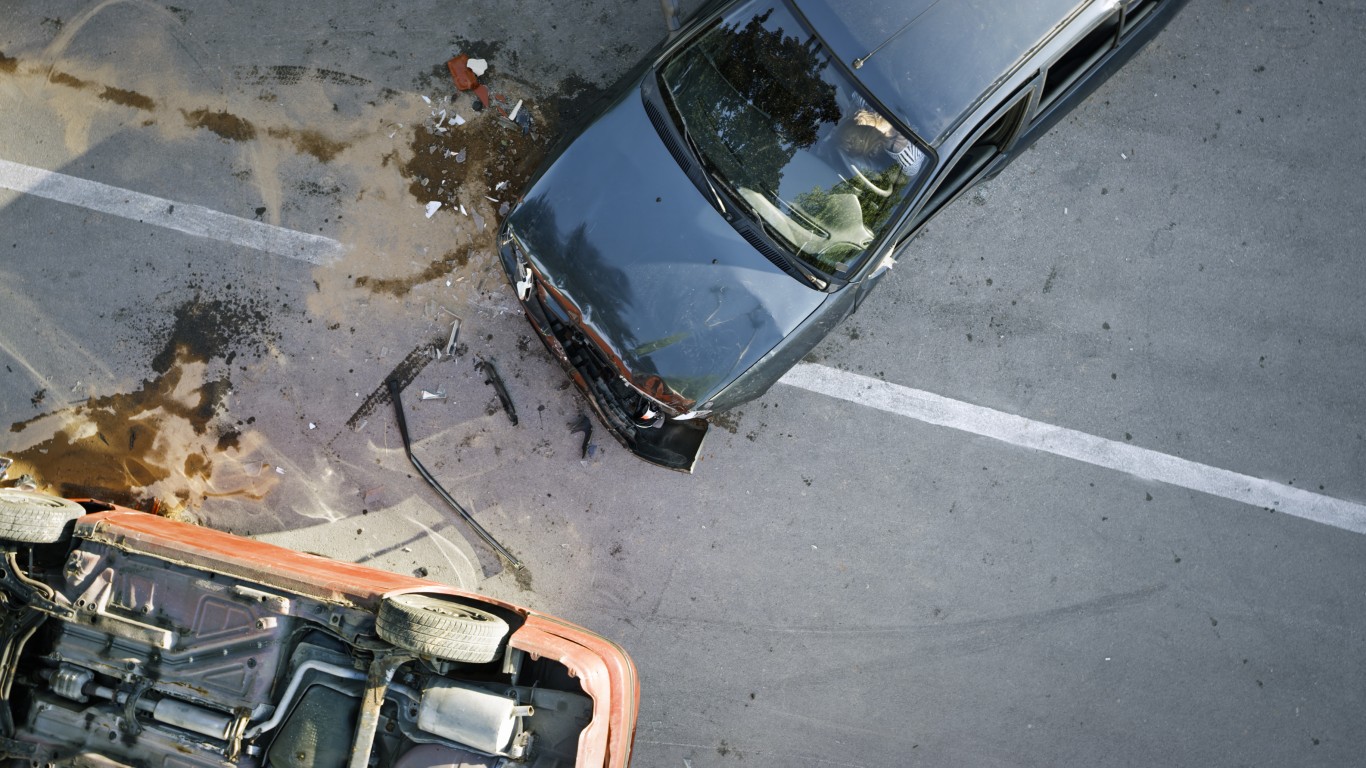
There are four major types of accidents, per the National Highway Traffic Safety Administration: collisions with a motor vehicle in transport, collisions with a fixed object like a light pole or guard rail, collisions with non-fixed objects like pedestrians, cyclists, or animals, and non-collision car wrecks like rollovers. Some types of car wrecks are much more common than others.
To determine the most common types of car wrecks, 24/7 Wall St. reviewed data on the over 61 million documented auto incidents from 2011 to 2020, as categorized by the National Highway Traffic Safety Administration. In the event of multi-faceted car wrecks, the incidents were categorized based on the first collision. Miscellaneous or uncategorized accidents were excluded.
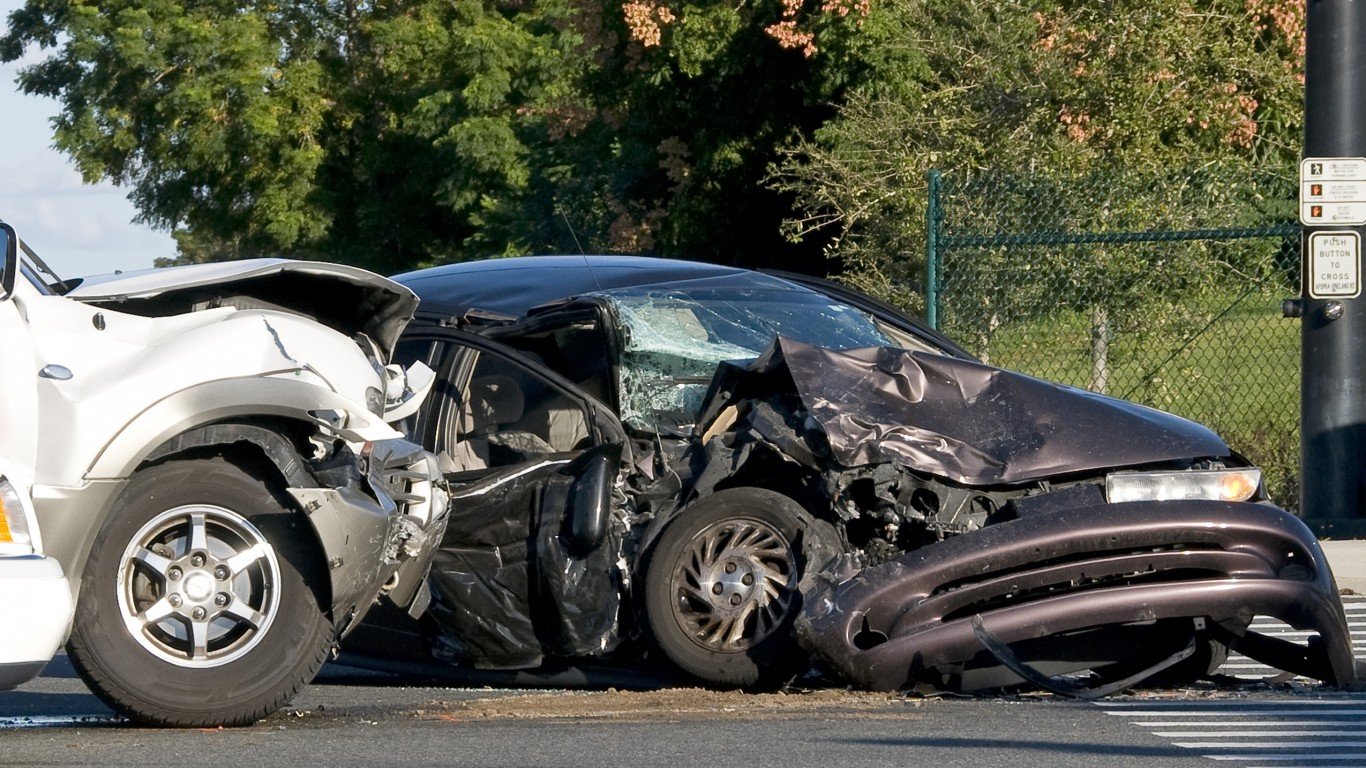
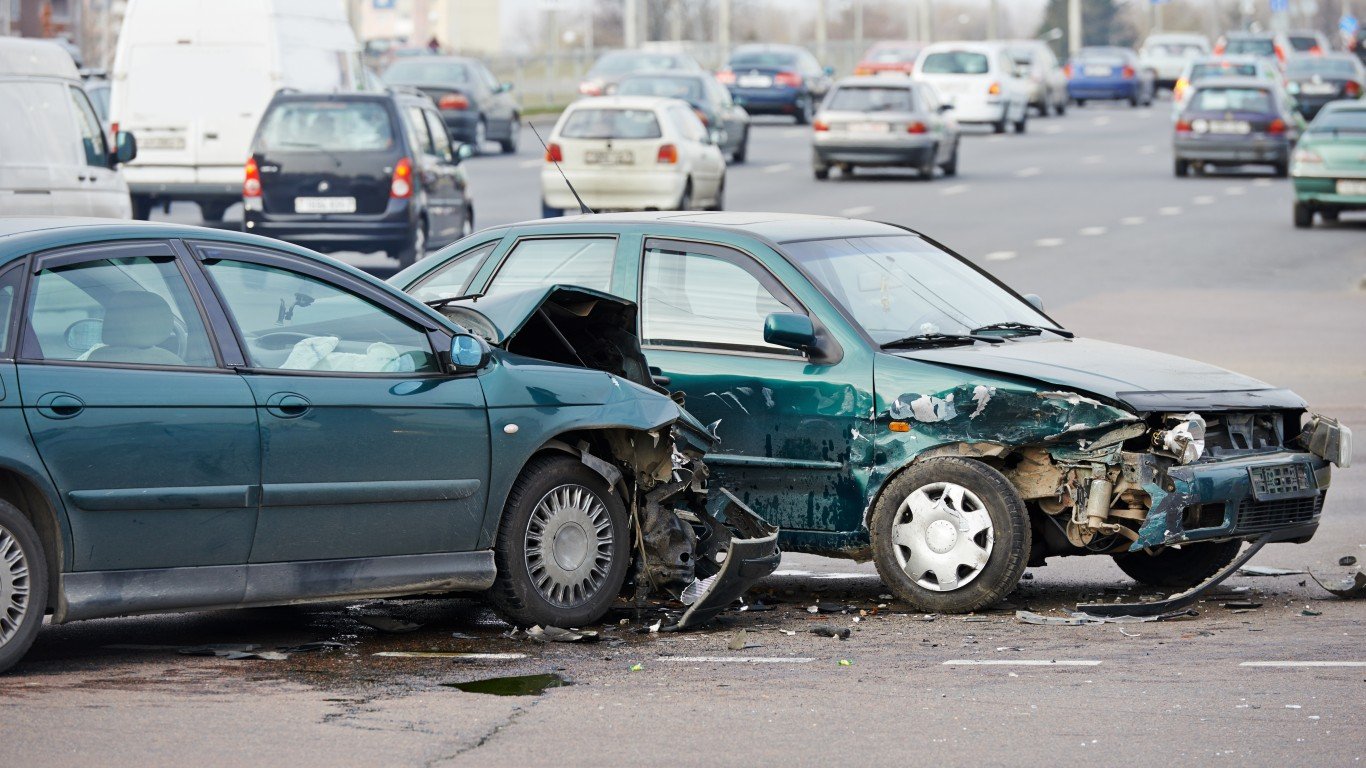
Collisions between two cars in transit make up the majority of all American auto accidents. This includes rear-ending, sideswiping, or running into another car at an angle. With cars regularly driving at high speeds very close to one another, just a momentary lapse in concentration can result in a wreck. (Fatigue can contribute to crashes. This is the city with the longest commute in every state.)
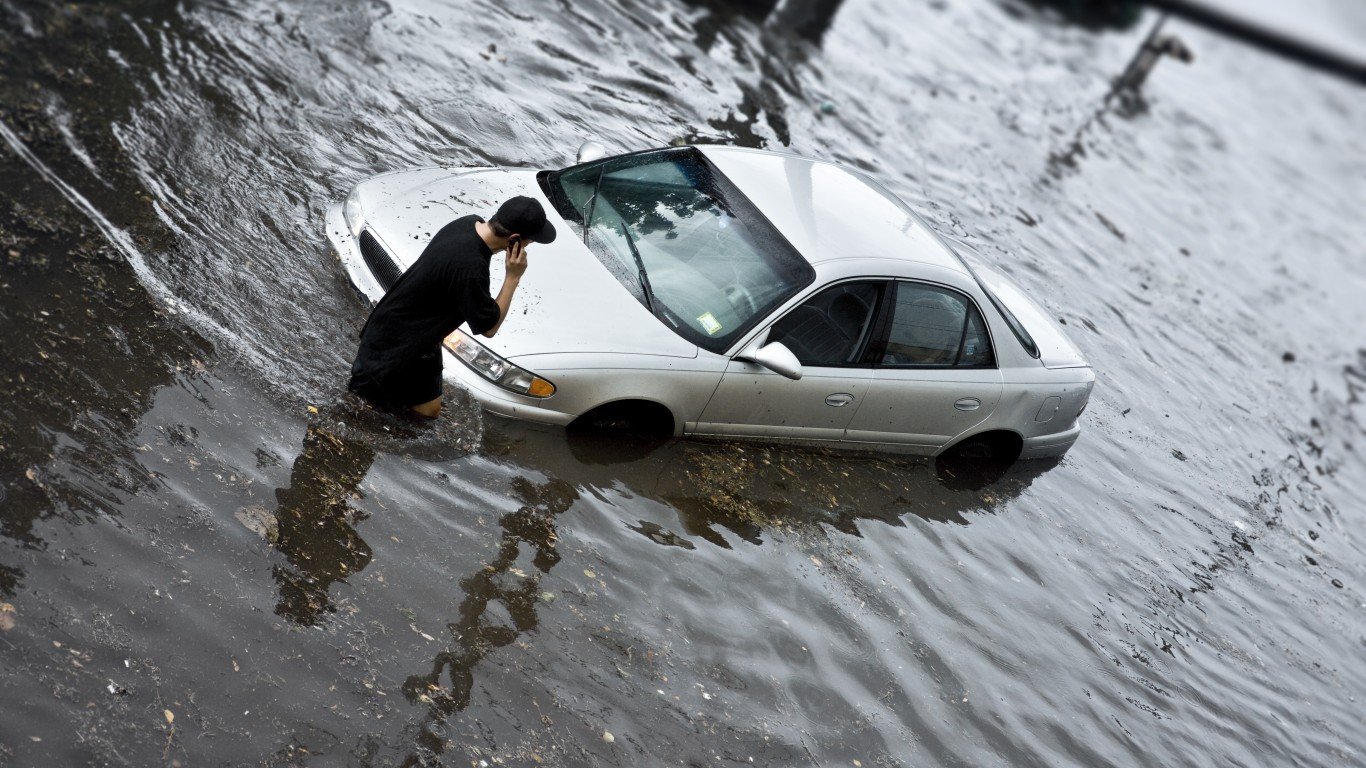
There are often aggravating factors behind these auto accidents. Weather conditions may reduce visibility or make driving more difficult. Drivers themselves may be impaired, distracted, or drowsy, making them much more likely to run into something. Road conditions can also play a part, as twisting highways or rough surfaces can increase the likelihood of accidents. This state has the worst highways in America.
Click here to see the 20 car accidents Americans get in the most.

20. Hit train
> Occurrences, 2011-2020: 10,869 (0.0% of total)
> Injuries: 3,235 injuries
> Fatalities: 1,072 fatalities
[in-text-ad]

19. Hit bridge
> Occurrences, 2011-2020: 148,870 (0.2% of total)
> Injuries: 38,458 injuries
> Fatalities: 1,986 fatalities
[recirclink id=1117797]
18. Other noncollision
> Occurrences, 2011-2020: 262,652 (0.4% of total)
> Injuries: 69,064 injuries
> Fatalities: 3,739 fatalities
17. Hit embankment
> Occurrences, 2011-2020: 482,196 (0.8% of total)
> Injuries: 204,334 injuries
> Fatalities: 9,388 fatalities
[in-text-ad-2]

16. Hit cyclist
> Occurrences, 2011-2020: 537,628 (0.9% of total)
> Injuries: 484,373 injuries
> Fatalities: 7,939 fatalities
15. Hit pedestrian
> Occurrences, 2011-2020: 710,565 (1.2% of total)
> Injuries: 641,863 injuries
> Fatalities: 51,649 fatalities
[in-text-ad]
14. Hit something else; not fixed
> Occurrences, 2011-2020: 751,150 (1.2% of total)
> Injuries: 138,654 injuries
> Fatalities: 3,811 fatalities
[recirclink id=1108174]
13. Hit another car; other
> Occurrences, 2011-2020: 814,546 (1.3% of total)
> Injuries: 87,885 injuries
> Fatalities: 1,429 fatalities
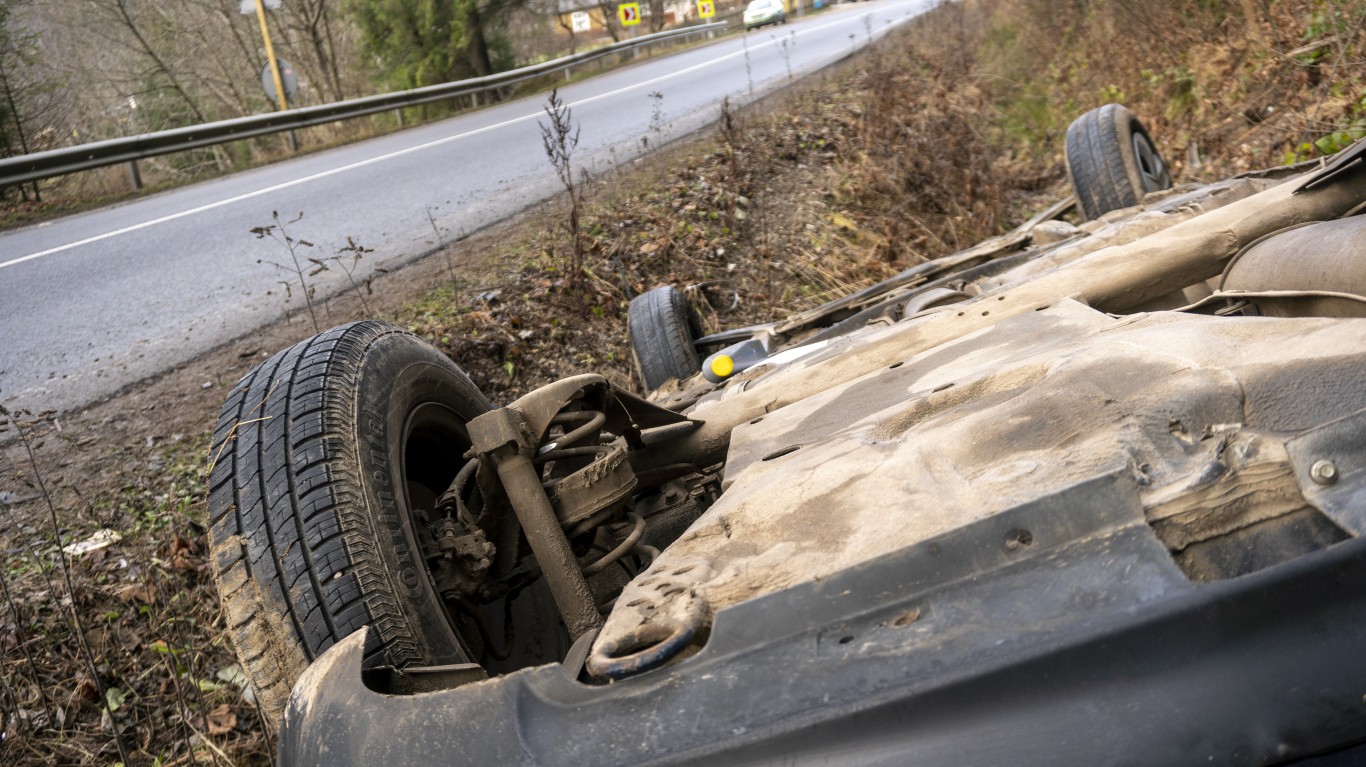
12. Rollover
> Occurrences, 2011-2020: 972,172 (1.6% of total)
> Injuries: 595,124 injuries
> Fatalities: 27,935 fatalities
[in-text-ad-2]
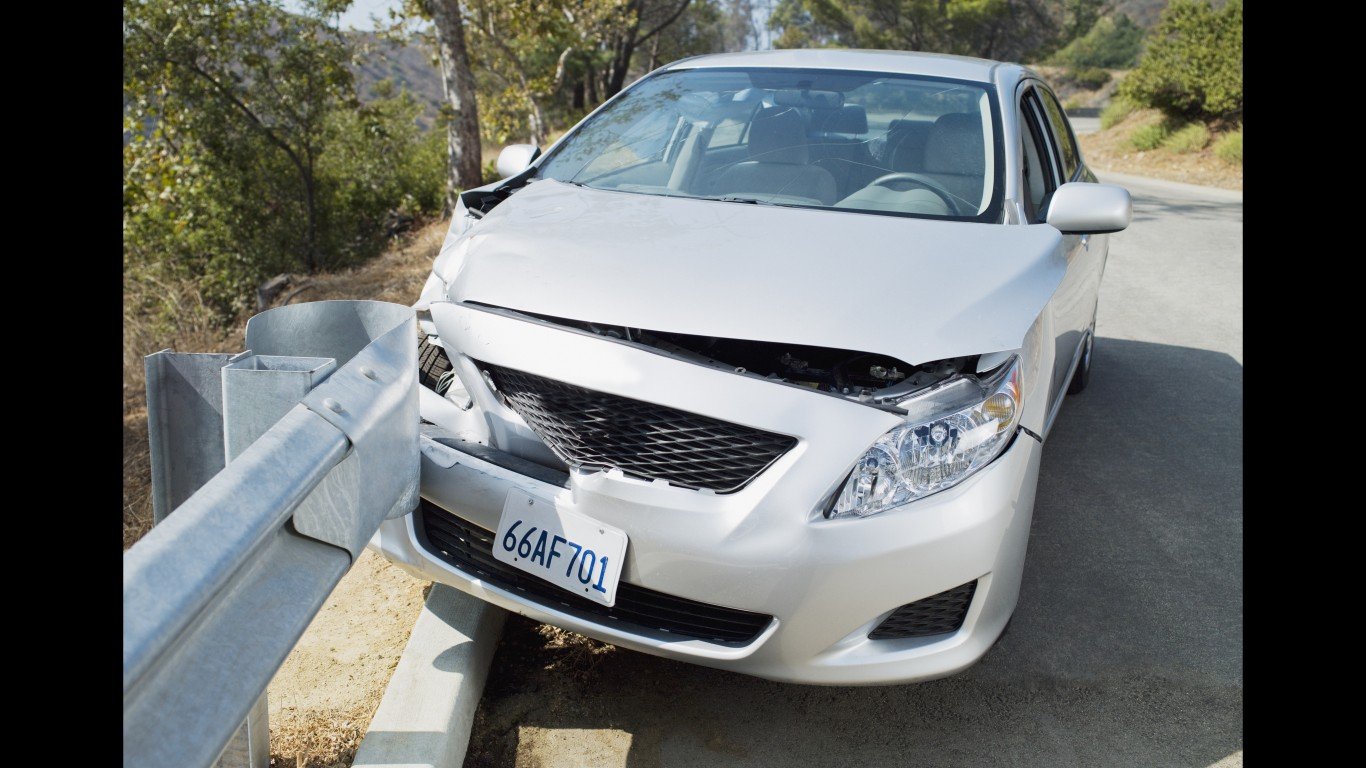
11. Hit guardrail
> Occurrences, 2011-2020: 1,004,352 (1.6% of total)
> Injuries: 281,611 injuries
> Fatalities: 9,031 fatalities
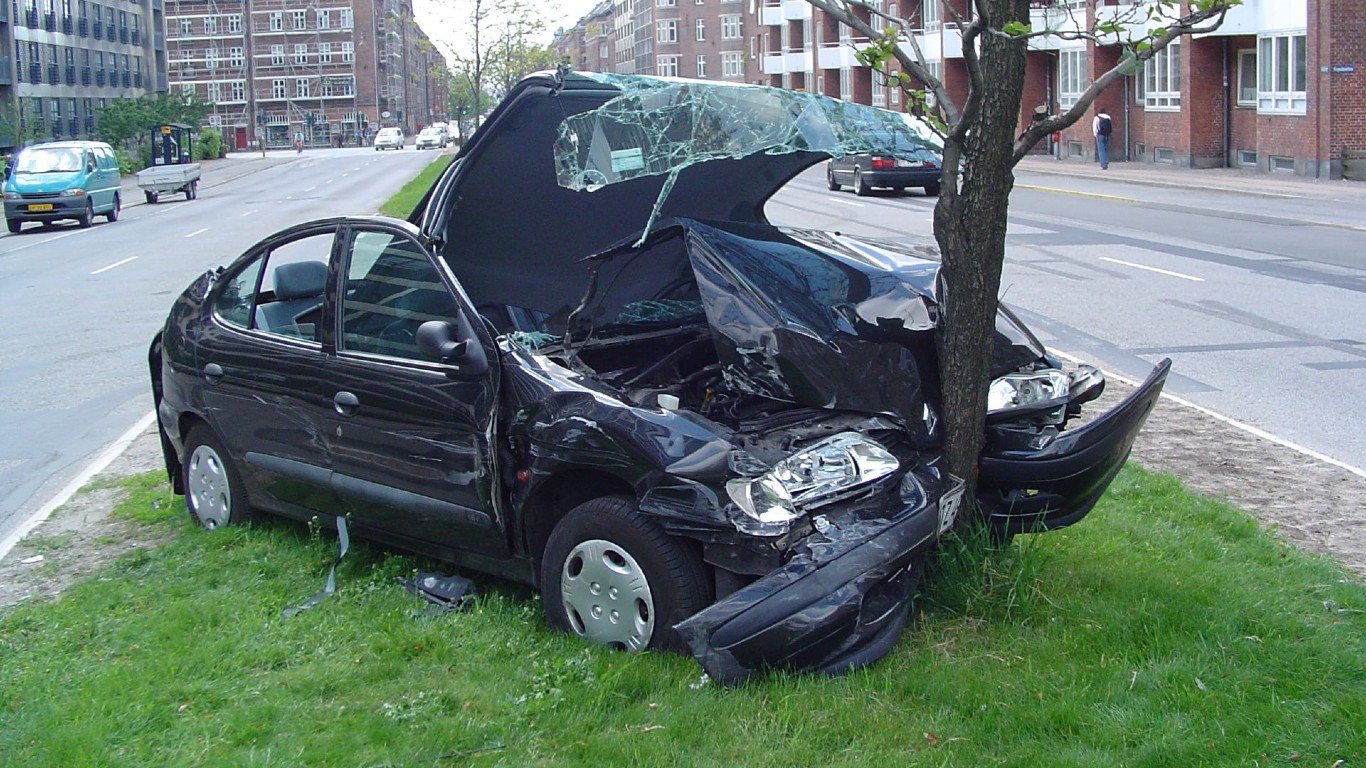
10. Hit shrubbery/tree
> Occurrences, 2011-2020: 1,130,992 (1.9% of total)
> Injuries: 449,957 injuries
> Fatalities: 24,584 fatalities
[in-text-ad]
9. Hit another car; head on
> Occurrences, 2011-2020: 1,450,173 (2.4% of total)
> Injuries: 711,910 injuries
> Fatalities: 32,609 fatalities
[recirclink id=1090212]
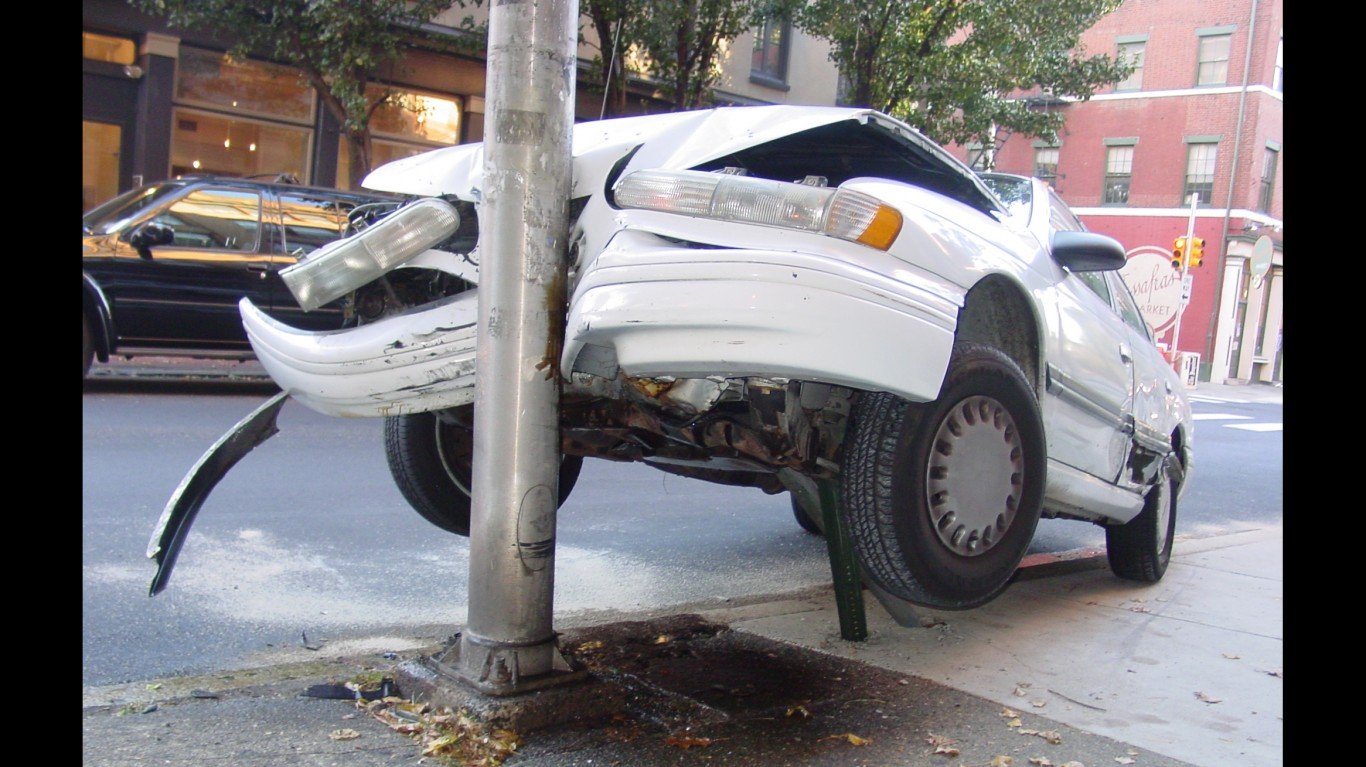
8. Hit a pole/post
> Occurrences, 2011-2020: 1,906,073 (3.1% of total)
> Injuries: 535,784 injuries
> Fatalities: 14,181 fatalities
7. Hit a culvert/curb/ditch
> Occurrences, 2011-2020: 2,140,550 (3.5% of total)
> Injuries: 684,758 injuries
> Fatalities: 24,388 fatalities
[in-text-ad-2]
6. Hit something else fixed
> Occurrences, 2011-2020: 2,508,934 (4.1% of total)
> Injuries: 677,702 injuries
> Fatalities: 17,641 fatalities

5. Hit animal
> Occurrences, 2011-2020: 2,875,127 (4.7% of total)
> Injuries: 193,112 injuries
> Fatalities: 1,810 fatalities
[in-text-ad]

4. Hit parked car
> Occurrences, 2011-2020: 3,402,886 (5.6% of total)
> Injuries: 488,877 injuries
> Fatalities: 3,722 fatalities
[recirclink id=1027744]
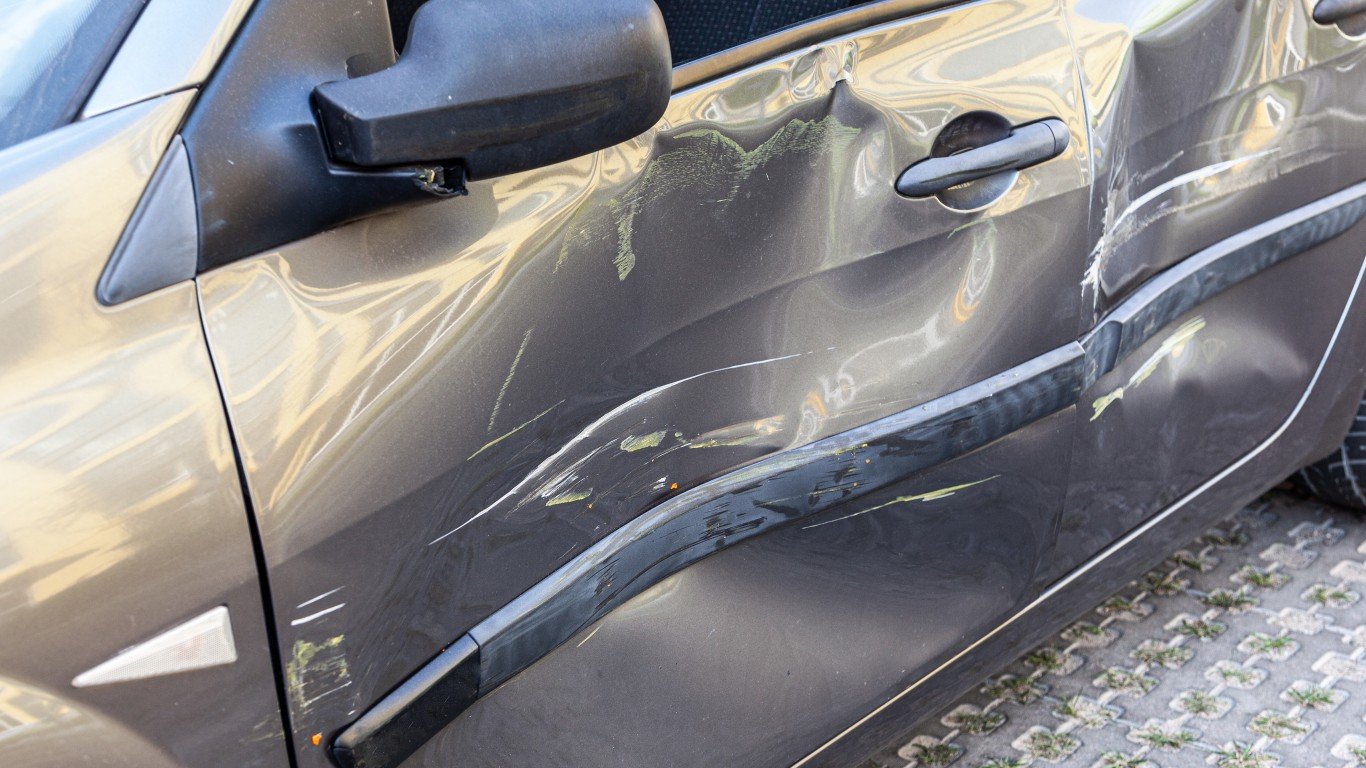
3. Hit another car; sideswipe
> Occurrences, 2011-2020: 7,147,877 (11.7% of total)
> Injuries: 1,075,045 injuries
> Fatalities: 8,713 fatalities
2. Hit another car; at an angle
> Occurrences, 2011-2020: 13,145,773 (21.5% of total)
> Injuries: 4,708,872 injuries
> Fatalities: 58,465 fatalities
[in-text-ad-2]
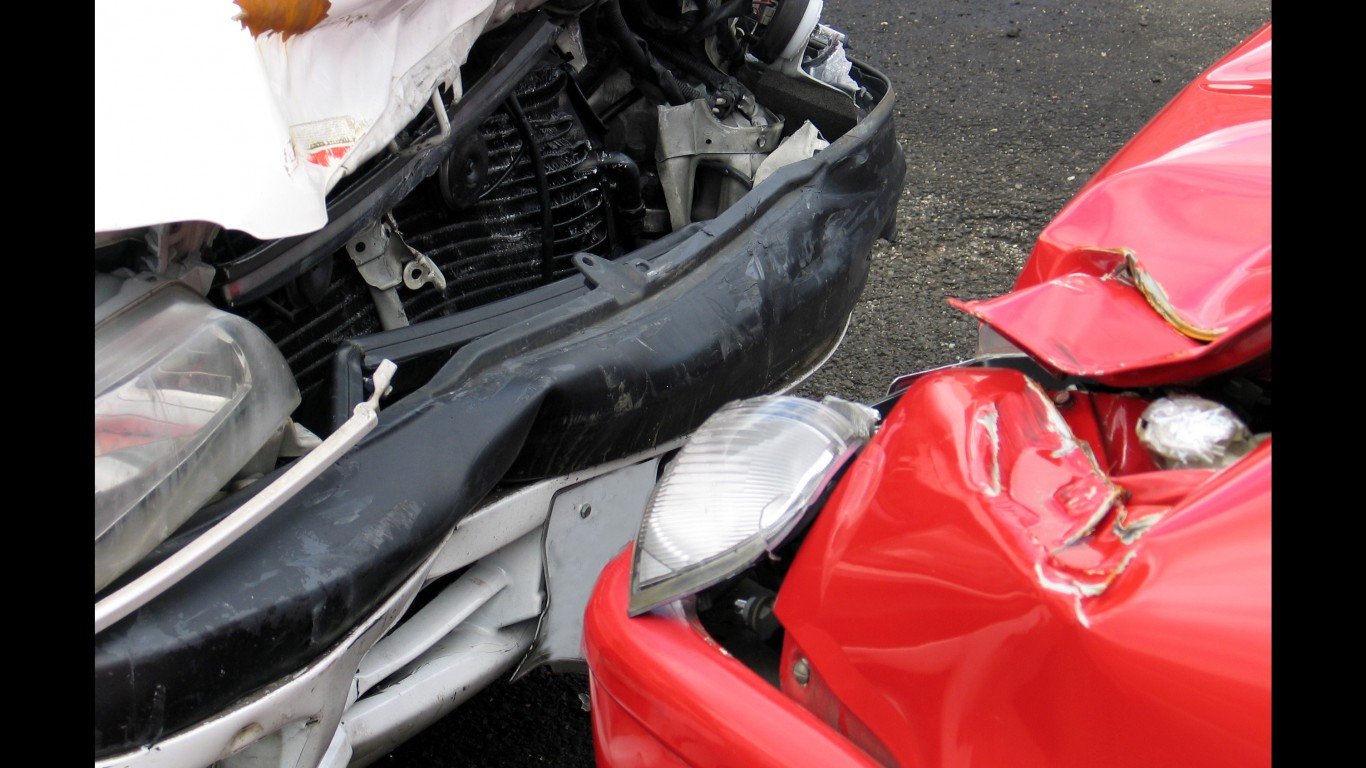
1. Hit another car; rear end
> Occurrences, 2011-2020: 19,611,823 (32.1% of total)
> Injuries: 5,455,937 injuries
> Fatalities: 21,750 fatalities
Contact [email protected] for any questions or corrections.