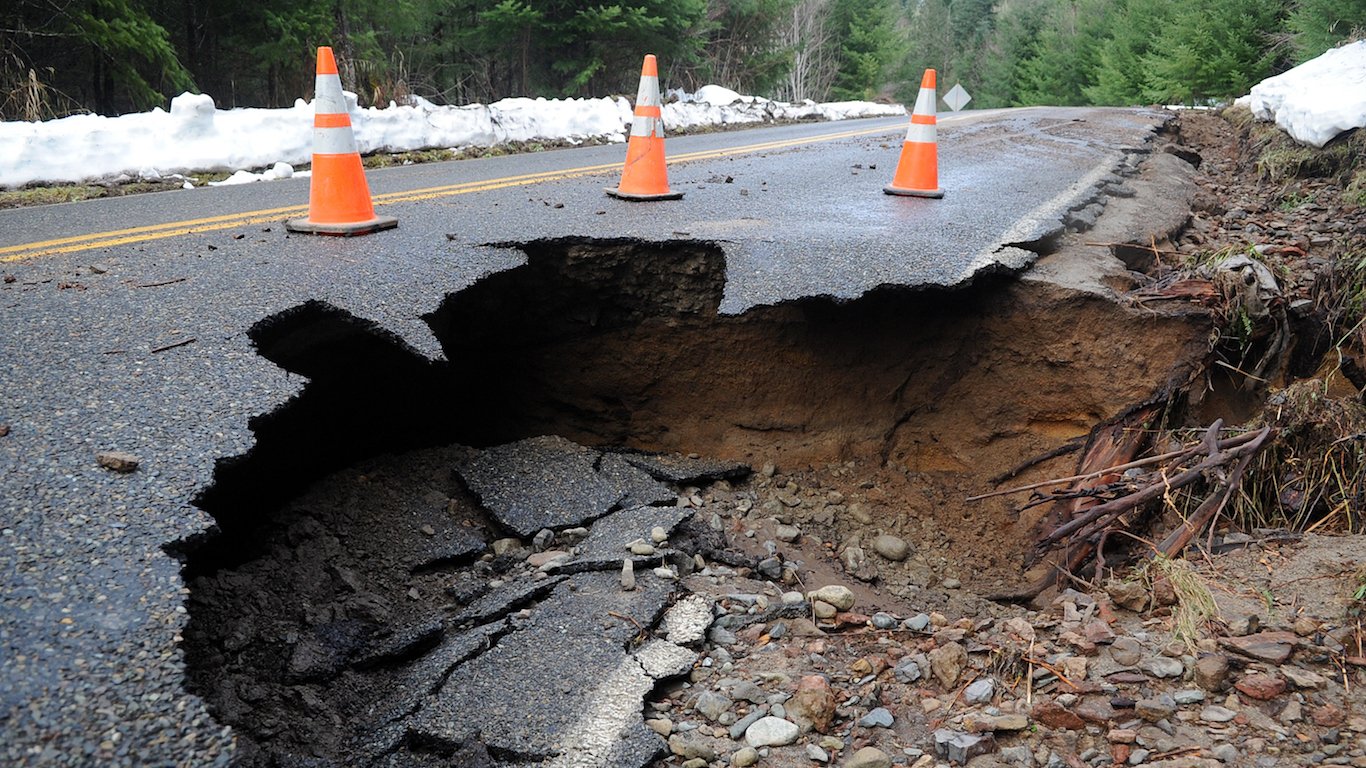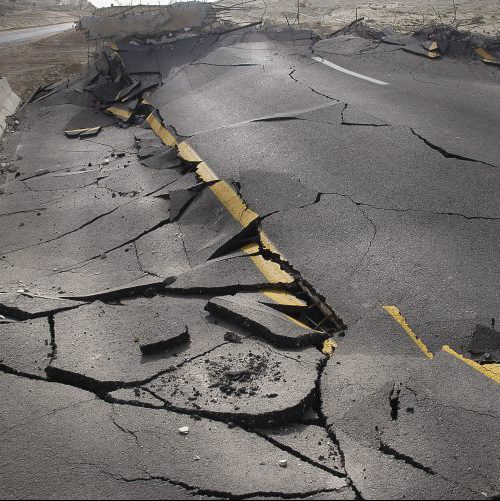
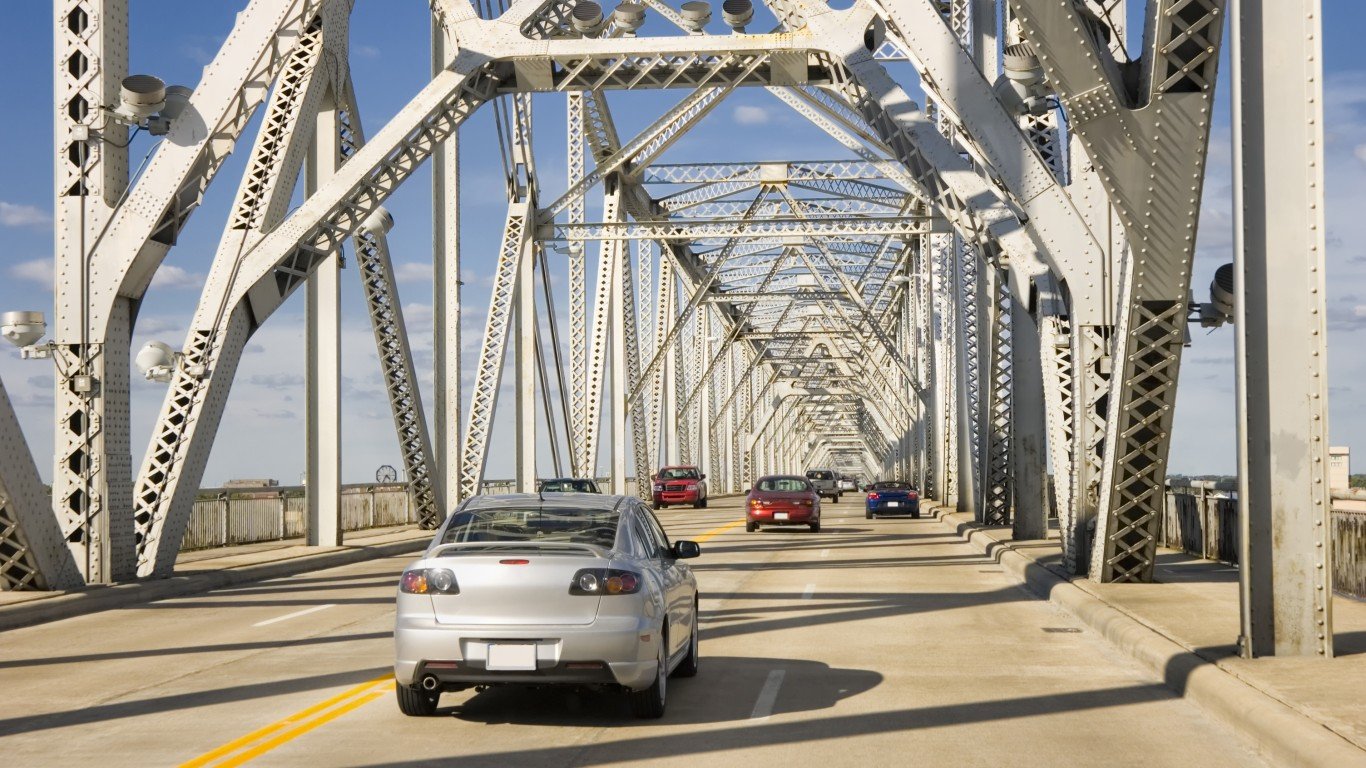
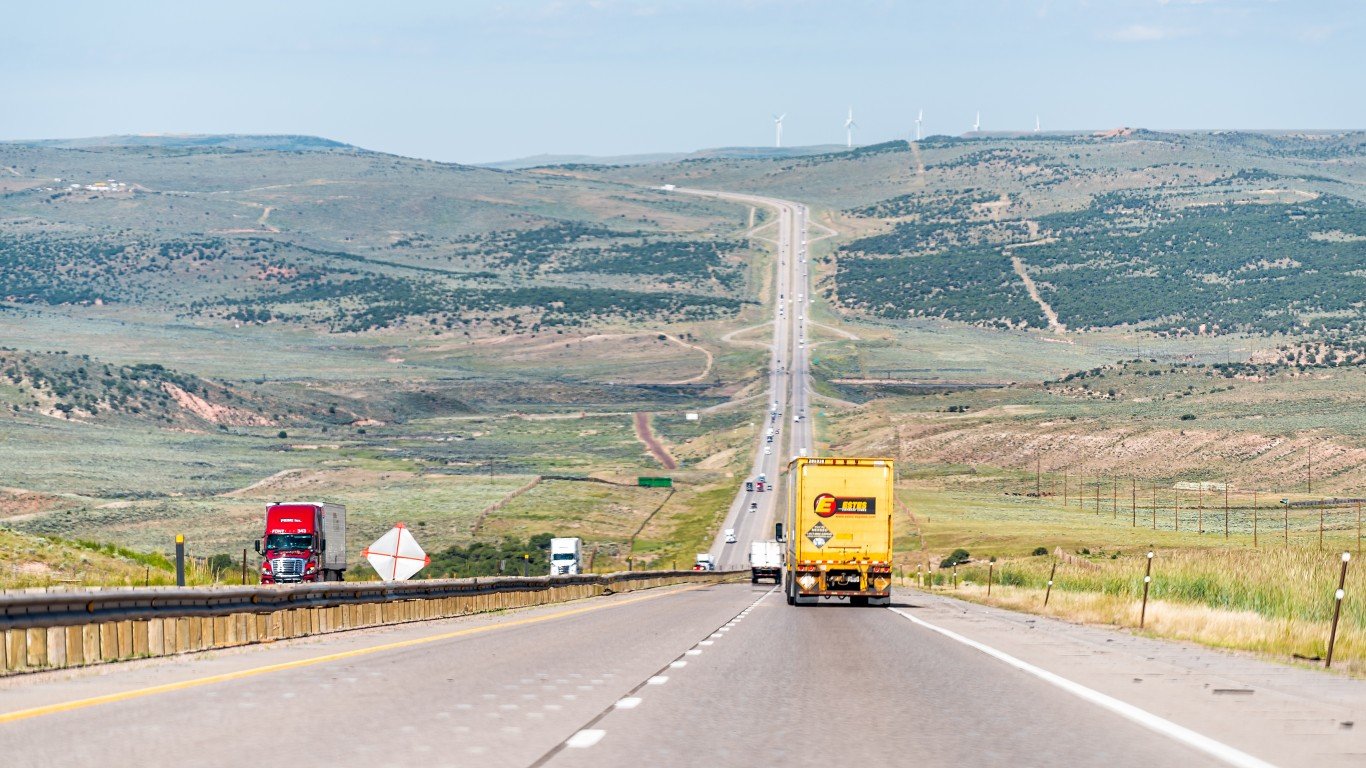
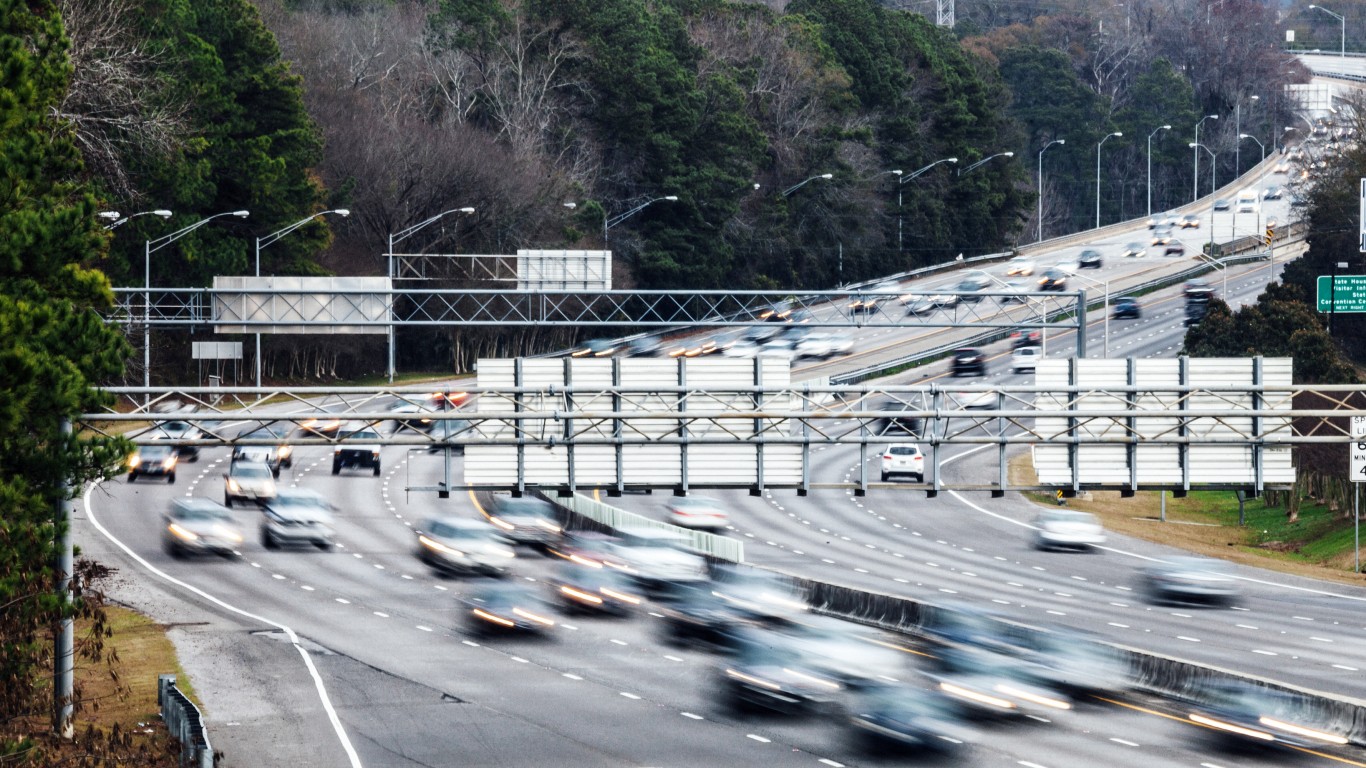
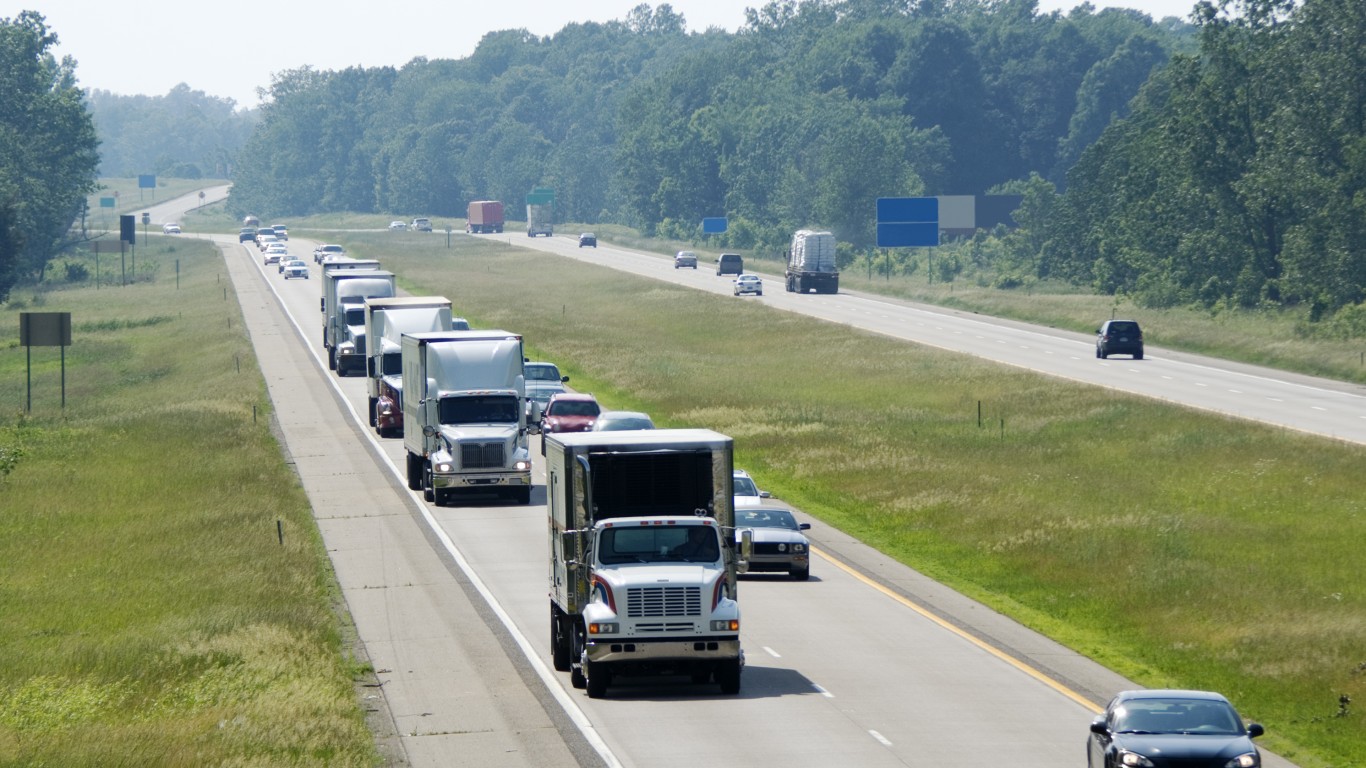
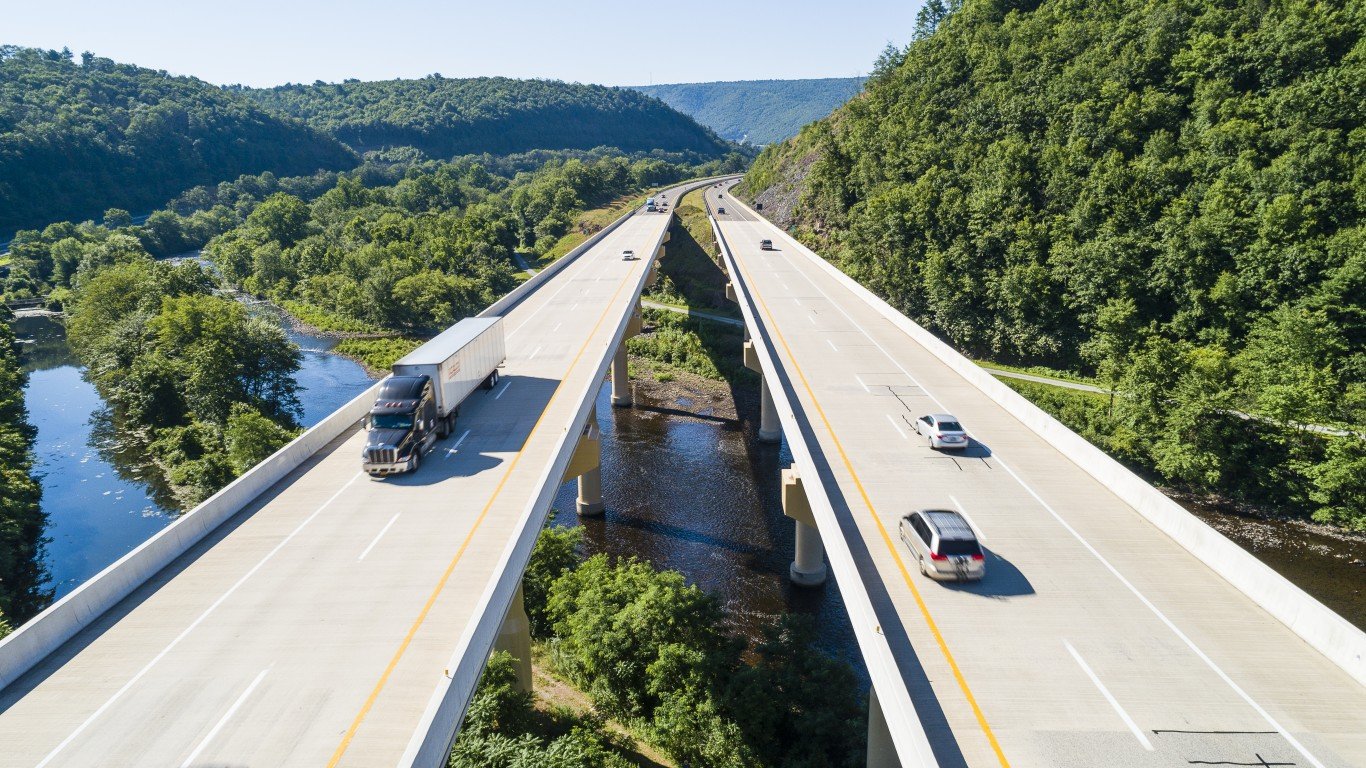
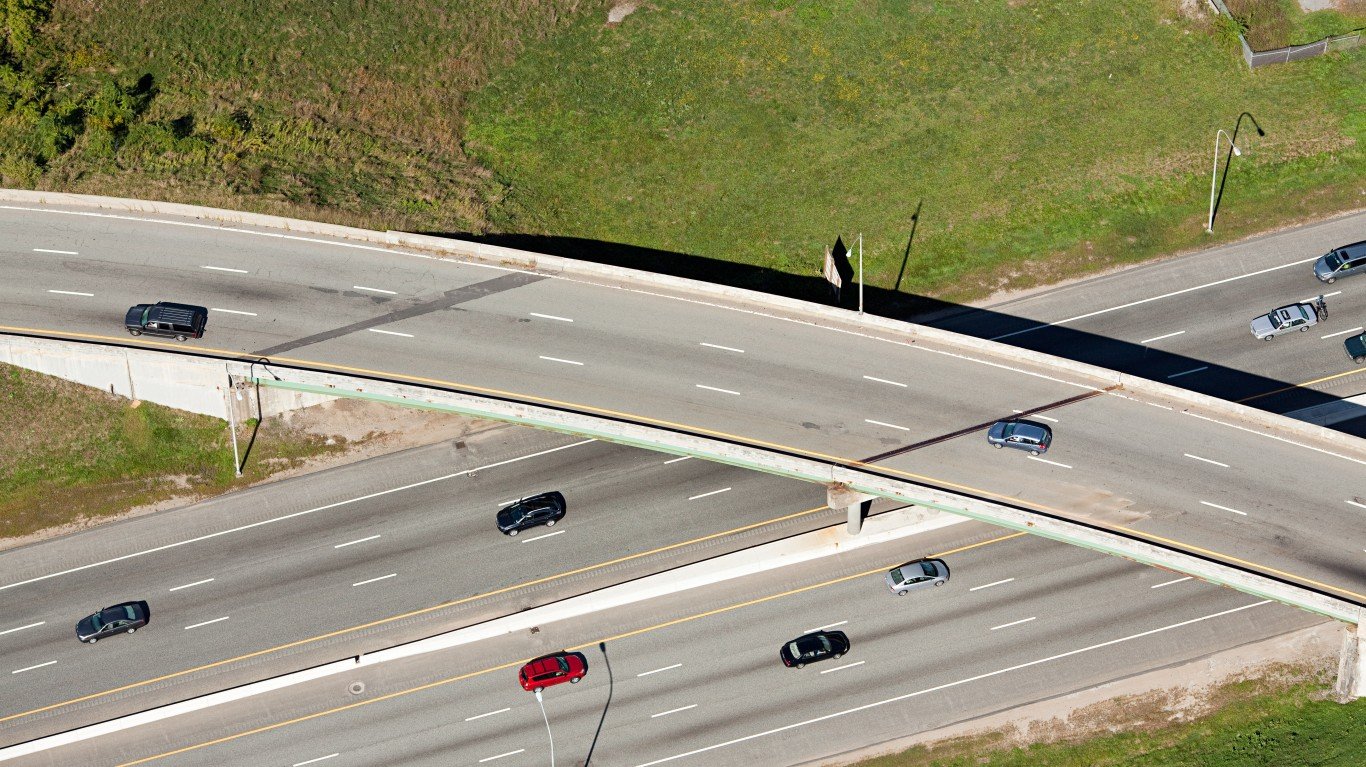
The federal Infrastructure Investment and Jobs Act, passed by Congress on Nov. 6 of last year,, will provide money to, among other things, rebuild 20,000 miles of road and 10,000 bridges. Among the calculations of the plan is that one in five miles of major highway in the United States is in poor condition. This is certainly the case with the largest major road network in America: the Dwight D. Eisenhower National System of Interstate and Defense Highways, also known as the Interstate Highway System. The first parts of this were built in 1956. (The system encompasses many of the longest roads in America.)
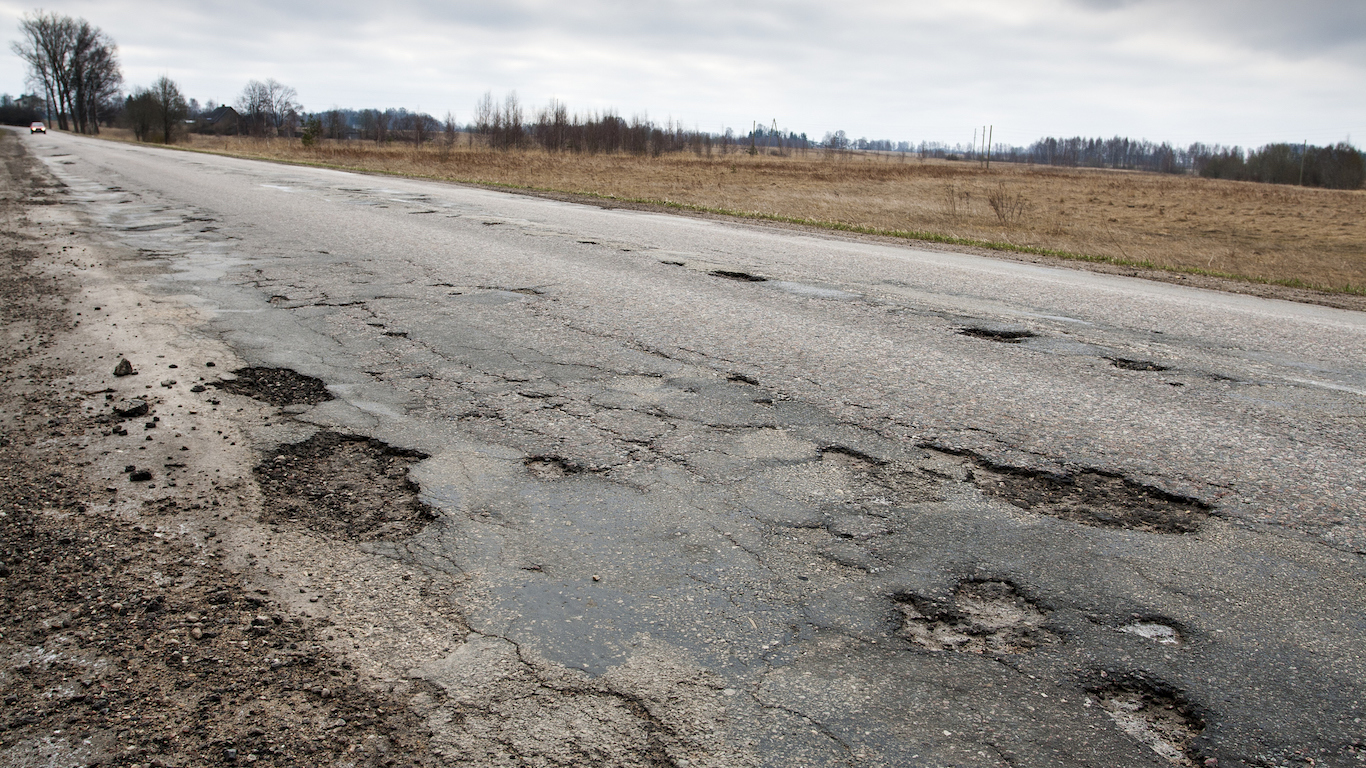
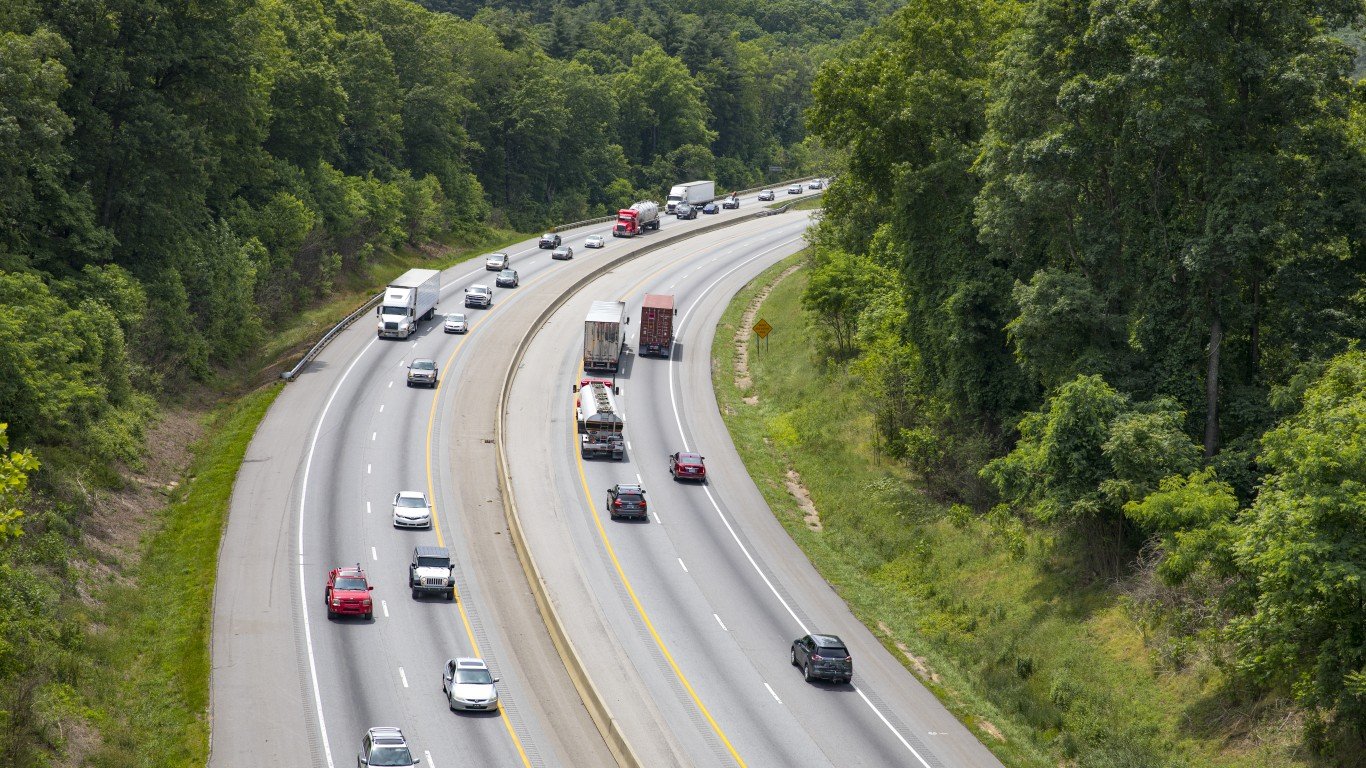
Several think tanks and engineers’ groups issue reports on the state of America’s infrastructure, usually with a focus on roads, bridges, tunnels, water and sewage systems, and airports. One of the most highly regarded of these is the Libertarian Reason Foundation’s Annual Highway Report. The 26th annual edition of the report was released recently, and it names New Jersey as the state with the worst highways in America. (Perhaps surprisingly, the Garden State isn’t home to any of America’s 50 worst cities to drive in.)
Using data from 2019 and 2020, the report looks at state-controlled highways. In sum, the report says, “State-controlled mileage encompasses the state highway systems, state-agency toll roads, some ferry services, and smaller systems serving universities and state-owned properties. It includes the Interstate System, the National Highway System, and most federal-aid system roads.”
The report’s co-author, Baruch Feigenbaum, told Route Fifty that “States need to ensure their highway spending produces safer roads, smoother pavement, fewer deficient bridges, and less traffic congestion. The states with the best overall rankings maintain better-than-average highways with relatively efficient spending per mile.”
The report uses 13 yardsticks to create a final ranking for each state. These include state financial disbursements for roads and bridges, disbursements for maintenance, analysis of both urban and rural roads, pavement condition, and structurally deficient bridges.
Click here to see the states with the worst highways, ranked best to worst
North Dakota topped the list for best highways, followed by Virginia, Missouri, and Kentucky. The state with the highest score – indicating the worst overall performance ranking – is New Jersey. It fell last in almost every measure of disbursements and near the bottom of the rankings for urban congestion.
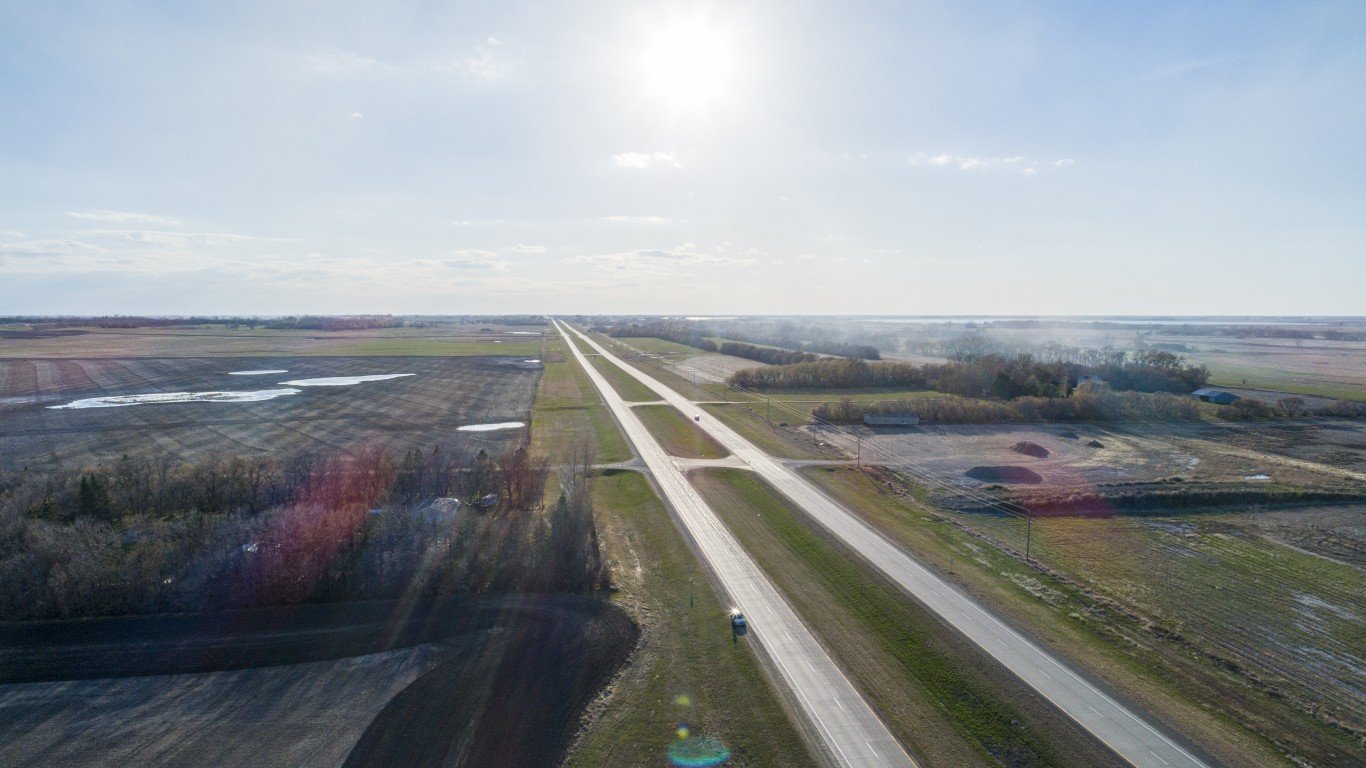
1. North Dakota
> Total disbursements per mile: $26,943 – 2nd lowest
> Structurally deficient bridges: 10.7% – 9th highest
> Fatality rate per 100 million vehicle-miles: 1.02 – 20th lowest
[in-text-ad]

2. Virginia
> Total disbursements per mile: $34,969 – 8th lowest
> Structurally deficient bridges: 4.4% – 10th lowest
> Fatality rate per 100 million vehicle-miles: 0.97 – 15th lowest
[recirclink id=970370]

3. Missouri
> Total disbursements per mile: $27,770 – 5th lowest
> Structurally deficient bridges: 8.8% – 17th highest
> Fatality rate per 100 million vehicle-miles: 1.11 – 24th highest
4. Kentucky
> Total disbursements per mile: $36,205 – 12th lowest
> Structurally deficient bridges: 7.2% – 22nd highest
> Fatality rate per 100 million vehicle-miles: 1.48 – 4th highest
[in-text-ad-2]
5. North Carolina
> Total disbursements per mile: $41,220 – 14th lowest
> Structurally deficient bridges: 9.3% – 12th highest
> Fatality rate per 100 million vehicle-miles: 1.12 – 22nd highest

6. Utah
> Total disbursements per mile: $104,840 – 15th highest
> Structurally deficient bridges: 2.1% – 4th lowest
> Fatality rate per 100 million vehicle-miles: 0.75 – 8th lowest
[in-text-ad]
7. Kansas
> Total disbursements per mile: $50,253 – 18th lowest
> Structurally deficient bridges: 5.1% – 16th lowest
> Fatality rate per 100 million vehicle-miles: 1.29 – 16th highest
[recirclink id=837738]

8. Idaho
> Total disbursements per mile: $68,482 – 21st lowest
> Structurally deficient bridges: 6.6% – 23rd lowest
> Fatality rate per 100 million vehicle-miles: 1.24 – 19th highest

9. South Dakota
> Total disbursements per mile: $27,629 – 4th lowest
> Structurally deficient bridges: 17.0% – 4th highest
> Fatality rate per 100 million vehicle-miles: 1.03 – 21st lowest
[in-text-ad-2]

10. Tennessee
> Total disbursements per mile: $48,943 – 16th lowest
> Structurally deficient bridges: 4.4% – 11th lowest
> Fatality rate per 100 million vehicle-miles: 1.37 – 11th highest
11. Montana
> Total disbursements per mile: $31,131 – 6th lowest
> Structurally deficient bridges: 7.2% – 24th highest
> Fatality rate per 100 million vehicle-miles: 1.43 – 7th highest
[in-text-ad]
12. Wyoming
> Total disbursements per mile: $35,768 – 10th lowest
> Structurally deficient bridges: 6.9% – 24th lowest
> Fatality rate per 100 million vehicle-miles: 1.44 – 5th highest
[recirclink id=1007359]
13. Vermont
> Total disbursements per mile: $78,883 – 25th lowest
> Structurally deficient bridges: 2.4% – 5th lowest
> Fatality rate per 100 million vehicle-miles: 0.64 – 3rd lowest

14. Georgia
> Total disbursements per mile: $66,994 – 20th lowest
> Structurally deficient bridges: 3.0% – 7th lowest
> Fatality rate per 100 million vehicle-miles: 1.12 – 23rd highest
[in-text-ad-2]
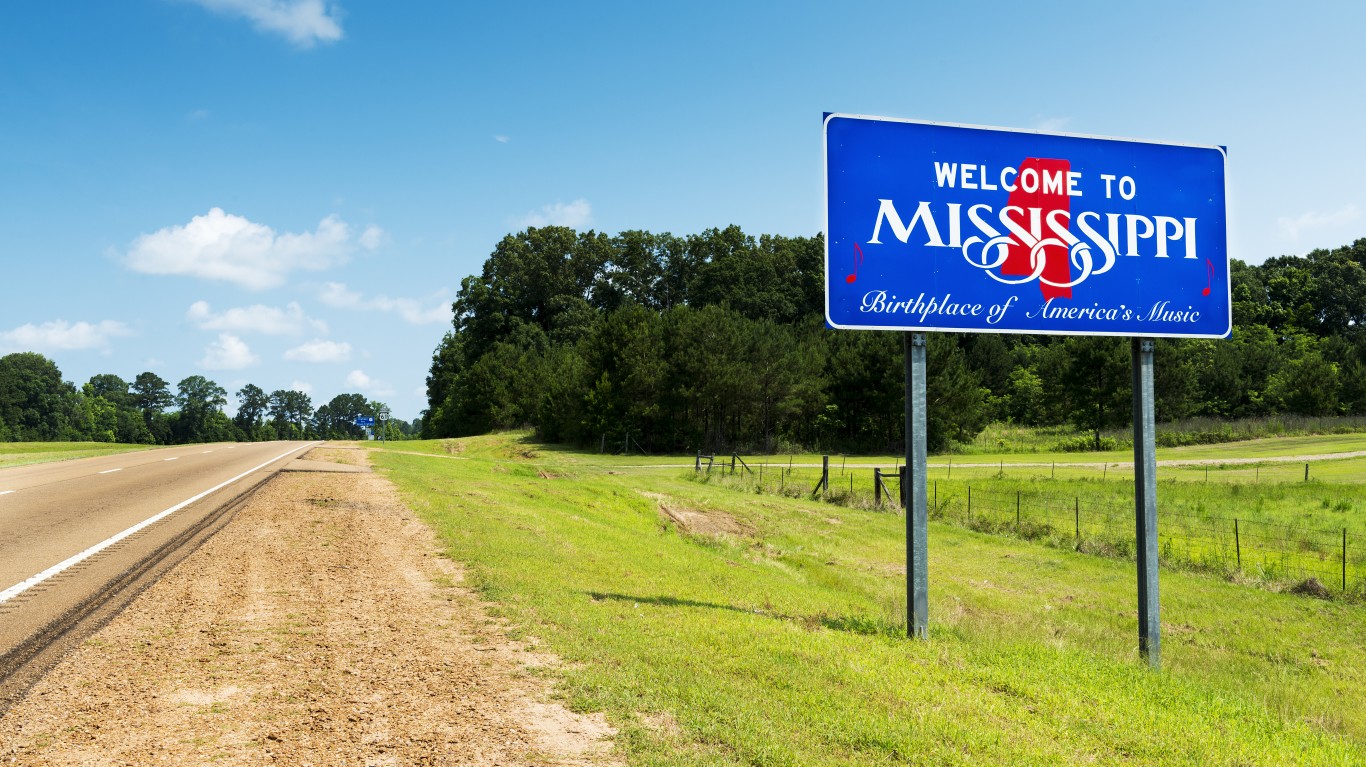
15. Mississippi
> Total disbursements per mile: $36,473 – 13th lowest
> Structurally deficient bridges: 8.7% – 18th highest
> Fatality rate per 100 million vehicle-miles: 1.56 – 2nd highest

16. Texas
> Total disbursements per mile: $75,153 – 24th lowest
> Structurally deficient bridges: 1.3% – 2nd lowest
> Fatality rate per 100 million vehicle-miles: 1.25 – 18th highest
[in-text-ad]

17. Arkansas
> Total disbursements per mile: $35,410 – 9th lowest
> Structurally deficient bridges: 4.9% – 14th lowest
> Fatality rate per 100 million vehicle-miles: 1.36 – 14th highest
[recirclink id=1000298]

18. Minnesota
> Total disbursements per mile: $80,561 – 24th highest
> Structurally deficient bridges: 4.7% – 13th lowest
> Fatality rate per 100 million vehicle-miles: 0.60 – 2nd lowest
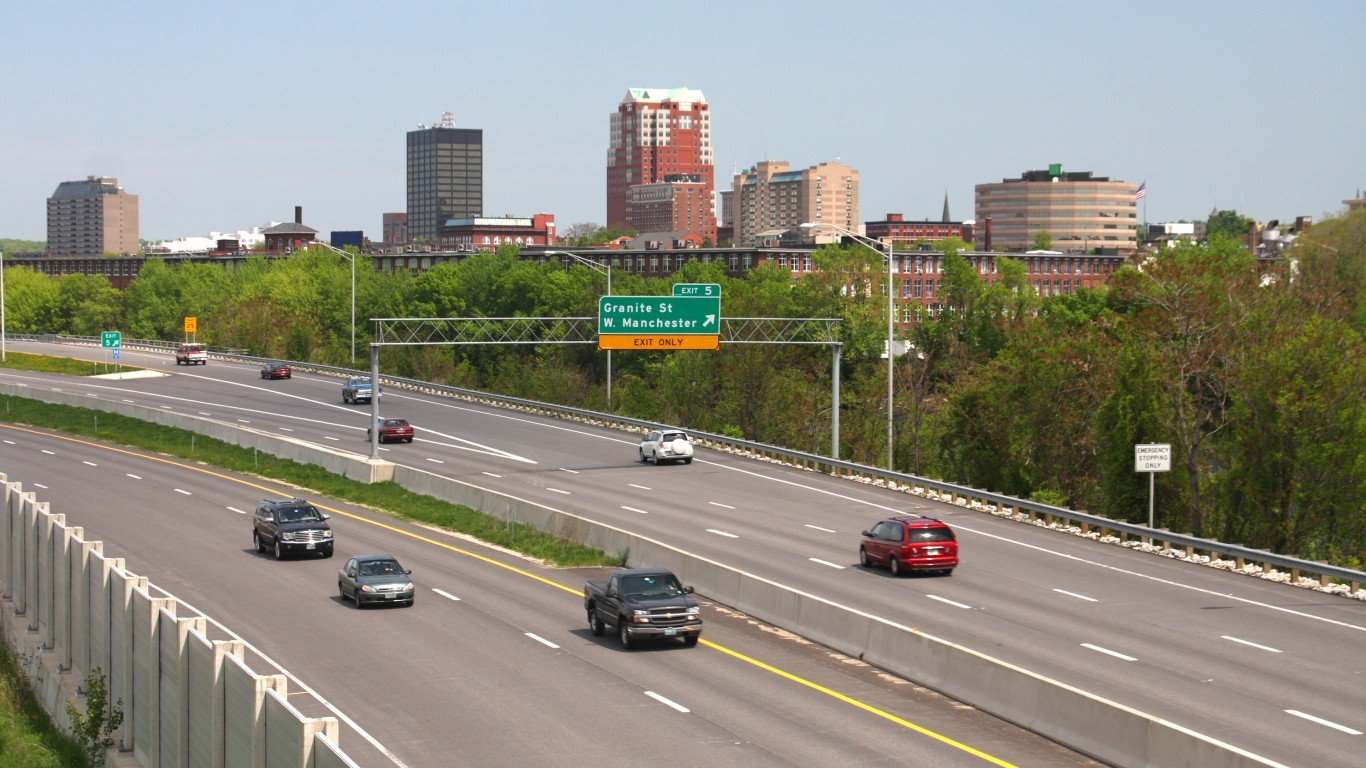
19. New Hampshire
> Total disbursements per mile: $71,214 – 22nd lowest
> Structurally deficient bridges: 8.5% – 19th highest
> Fatality rate per 100 million vehicle-miles: 0.73 – 5th lowest
[in-text-ad-2]

20. Nevada
> Total disbursements per mile: $90,048 – 20th highest
> Structurally deficient bridges: 1.3% – the lowest
> Fatality rate per 100 million vehicle-miles: 1.06 – 24th lowest

21. Nebraska
> Total disbursements per mile: $36,173 – 11th lowest
> Structurally deficient bridges: 8.8% – 16th highest
> Fatality rate per 100 million vehicle-miles: 1.17 – 20th highest
[in-text-ad]

22. Iowa
> Total disbursements per mile: $63,471 – 19th lowest
> Structurally deficient bridges: 19.0% – 3rd highest
> Fatality rate per 100 million vehicle-miles: 1.00 – 18th lowest
[recirclink id=966404]
23. South Carolina
> Total disbursements per mile: $27,479 – 3rd lowest
> Structurally deficient bridges: 8.4% – 20th highest
> Fatality rate per 100 million vehicle-miles: 1.73 – the highest

24. Ohio
> Total disbursements per mile: $80,409 – 25th highest
> Structurally deficient bridges: 5.4% – 19th lowest
> Fatality rate per 100 million vehicle-miles: 1.01 – 19th lowest
[in-text-ad-2]

25. Oregon
> Total disbursements per mile: $108,880 – 13th highest
> Structurally deficient bridges: 5.2% – 17th lowest
> Fatality rate per 100 million vehicle-miles: 1.37 – 12th highest

26. Wisconsin
> Total disbursements per mile: $85,343 – 22nd highest
> Structurally deficient bridges: 7.2% – 23rd highest
> Fatality rate per 100 million vehicle-miles: 0.85 – 11th lowest
[in-text-ad]

27. New Mexico
> Total disbursements per mile: $33,094 – 7th lowest
> Structurally deficient bridges: 5.5% – 20th lowest
> Fatality rate per 100 million vehicle-miles: 1.53 – 3rd highest
[recirclink id=970370]

28. Alabama
> Total disbursements per mile: $74,015 – 23rd lowest
> Structurally deficient bridges: 4.0% – 9th lowest
> Fatality rate per 100 million vehicle-miles: 1.30 – 15th highest

29. Arizona
> Total disbursements per mile: $108,044 – 14th highest
> Structurally deficient bridges: 1.6% – 3rd lowest
> Fatality rate per 100 million vehicle-miles: 1.40 – 10th highest
[in-text-ad-2]

30. West Virginia
> Total disbursements per mile: $20,884 – the lowest
> Structurally deficient bridges: 21.0% – 2nd highest
> Fatality rate per 100 million vehicle-miles: 1.36 – 13th highest

31. Connecticut
> Total disbursements per mile: $205,802 – 8th highest
> Structurally deficient bridges: 6.3% – 22nd lowest
> Fatality rate per 100 million vehicle-miles: 0.79 – 9th lowest
[in-text-ad]

32. Indiana
> Total disbursements per mile: $94,623 – 18th highest
> Structurally deficient bridges: 6.0% – 21st lowest
> Fatality rate per 100 million vehicle-miles: 0.98 – 16th lowest
[recirclink id=837738]

33. Maine
> Total disbursements per mile: $49,204 – 17th lowest
> Structurally deficient bridges: 12.8% – 7th highest
> Fatality rate per 100 million vehicle-miles: 1.06 – 23rd lowest
34. Michigan
> Total disbursements per mile: $92,547 – 19th highest
> Structurally deficient bridges: 10.8% – 8th highest
> Fatality rate per 100 million vehicle-miles: 0.96 – 14th lowest
[in-text-ad-2]
35. Louisiana
> Total disbursements per mile: $41,800 – 15th lowest
> Structurally deficient bridges: 13.2% – 6th highest
> Fatality rate per 100 million vehicle-miles: 1.42 – 8th highest
36. Oklahoma
> Total disbursements per mile: $88,266 – 21st highest
> Structurally deficient bridges: 10.2% – 10th highest
> Fatality rate per 100 million vehicle-miles: 1.43 – 6th highest
[in-text-ad]

37. Colorado
> Total disbursements per mile: $84,554 – 23rd highest
> Structurally deficient bridges: 5.3% – 18th lowest
> Fatality rate per 100 million vehicle-miles: 1.09 – 25th highest
[recirclink id=1007359]

38. Maryland
> Total disbursements per mile: $213,631 – 6th highest
> Structurally deficient bridges: 5.0% – 15th lowest
> Fatality rate per 100 million vehicle-miles: 0.87 – 12th lowest
39. Pennsylvania
> Total disbursements per mile: $102,329 – 16th highest
> Structurally deficient bridges: 15.3% – 5th highest
> Fatality rate per 100 million vehicle-miles: 1.03 – 22nd lowest
[in-text-ad-2]
40. Illinois
> Total disbursements per mile: $123,522 – 12th highest
> Structurally deficient bridges: 9.0% – 14th highest
> Fatality rate per 100 million vehicle-miles: 0.94 – 13th lowest
41. Florida
> Total disbursements per mile: $242,597 – 4th highest
> Structurally deficient bridges: 2.9% – 6th lowest
> Fatality rate per 100 million vehicle-miles: 1.41 – 9th highest
[in-text-ad]

42. Washington
> Total disbursements per mile: $202,823 – 9th highest
> Structurally deficient bridges: 4.6% – 12th lowest
> Fatality rate per 100 million vehicle-miles: 0.83 – 10th lowest
[recirclink id=1000298]

43. Massachusetts
> Total disbursements per mile: $345,947 – 3rd highest
> Structurally deficient bridges: 9.0% – 15th highest
> Fatality rate per 100 million vehicle-miles: 0.51 – the lowest

44. Delaware
> Total disbursements per mile: $148,736 – 11th highest
> Structurally deficient bridges: 3.2% – 8th lowest
> Fatality rate per 100 million vehicle-miles: 1.29 – 17th highest
[in-text-ad-2]

45. California
> Total disbursements per mile: $206,924 – 7th highest
> Structurally deficient bridges: 7.0% – 25th lowest
> Fatality rate per 100 million vehicle-miles: 1.06 – 25th lowest

46. New York
> Total disbursements per mile: $373,555 – 2nd highest
> Structurally deficient bridges: 10.0% – 11th highest
> Fatality rate per 100 million vehicle-miles: 0.75 – 6th lowest
[in-text-ad]

47. Hawaii
> Total disbursements per mile: $155,728 – 10th highest
> Structurally deficient bridges: 7.0% – 25th highest
> Fatality rate per 100 million vehicle-miles: 0.98 – 17th lowest
[recirclink id=966404]
48. Alaska
> Total disbursements per mile: $98,683 – 17th highest
> Structurally deficient bridges: 9.1% – 13th highest
> Fatality rate per 100 million vehicle-miles: 1.14 – 21st highest
49. Rhode Island
> Total disbursements per mile: $225,118 – 5th highest
> Structurally deficient bridges: 22.3% – the highest
> Fatality rate per 100 million vehicle-miles: 0.75 – 7th lowest
[in-text-ad-2]

50. New Jersey
> Total disbursements per mile: $1,136,255 – the highest
> Structurally deficient bridges: 7.8% – 21st highest
> Fatality rate per 100 million vehicle-miles: 0.71 – 4th lowest
Contact [email protected] for any questions or corrections.