Results from the 2020 census reveal some notable changes to the U.S. population over the last decade. The U.S. population grew by about 7% from 2010 to 2020. Over the same period, major cities such as Dallas, Houston, Phoenix, and San Antonio reported a more than 10% population increase.
As urban populations swelled, however, the rest of the country has suffered steep population declines. More than half of all U.S. counties and county equivalents reported population declines since 2010 – and in many small towns across the country, populations have cratered by over 15%.
Using data from the U.S. Census Bureau’s Population and Housing Unit Estimates Program, 24/7 Wall St. identified America’s fastest shrinking towns. U.S. places are ranked by the percent change in population from 2010 to 2020. We only considered incorporated places with populations between 1,000 and 25,000 on July 1, 2010.
Population change is the end result of two factors: migration and natural change. Migration is the net change of people moving to and from an area, while natural change is the number of births less the number of deaths.
The majority of the fastest shrinking towns are located in the South, including 10 in Mississippi. Economic opportunity is one of the most common reasons people move in the United States, and a lack of jobs in many of the towns on this list may be pushing people away. In most of the 50 fastest shrinking towns, the five-year average unemployment rate is higher than the 5.3% national average. (Here is a look at the states where job openings are disappearing right now.)
For many who are working in these towns, wages appear to be low. Only one town on this list has a higher median household income than the national median of $64,994, and only three have a lower poverty rate than the 12.8% national average.
The towns on this list also tend to have aging populations. In over half of these places, the share of the population who is 65 or older exceeds the 16.0% national share. (Here is a look at the best U.S. cities for retirees.)
Click here to see America’s disappearing small towns.
Click here to see our detailed methodology.

50. Jonestown, MS
> Pop. change; 2010-2020: -17.6% (-228 people)
> Total population: 1,298 in 2010; 1,070 in 2020
> Median household income: $16,652
> Poverty rate: 51.2%
> 2020 5-yr. avg. unemployment: 27.1%
[in-text-ad]

49. Lake Providence, LA
> Pop. change; 2010-2020: -17.6% (-715 people)
> Total population: 4,062 in 2010; 3,347 in 2020
> Median household income: $18,941
> Poverty rate: 56.1%
> 2020 5-yr. avg. unemployment: 1.8%
[recirclink id=1147374]

48. Eudora, AR
> Pop. change; 2010-2020: -17.6% (-400 people)
> Total population: 2,269 in 2010; 1,869 in 2020
> Median household income: $23,554
> Poverty rate: 39.1%
> 2020 5-yr. avg. unemployment: 19.3%

47. Denmark, SC
> Pop. change; 2010-2020: -17.7% (-622 people)
> Total population: 3,524 in 2010; 2,902 in 2020
> Median household income: $31,818
> Poverty rate: 19.0%
> 2020 5-yr. avg. unemployment: 12.0%
[in-text-ad-2]

46. Fort Sumner, NM
> Pop. change; 2010-2020: -17.8% (-185 people)
> Total population: 1,039 in 2010; 854 in 2020
> Median household income: $32,375
> Poverty rate: 12.8%
> 2020 5-yr. avg. unemployment: 14.6%

45. Durant, MS
> Pop. change; 2010-2020: -17.9% (-478 people)
> Total population: 2,676 in 2010; 2,198 in 2020
> Median household income: $23,575
> Poverty rate: 39.5%
> 2020 5-yr. avg. unemployment: 12.2%
[in-text-ad]
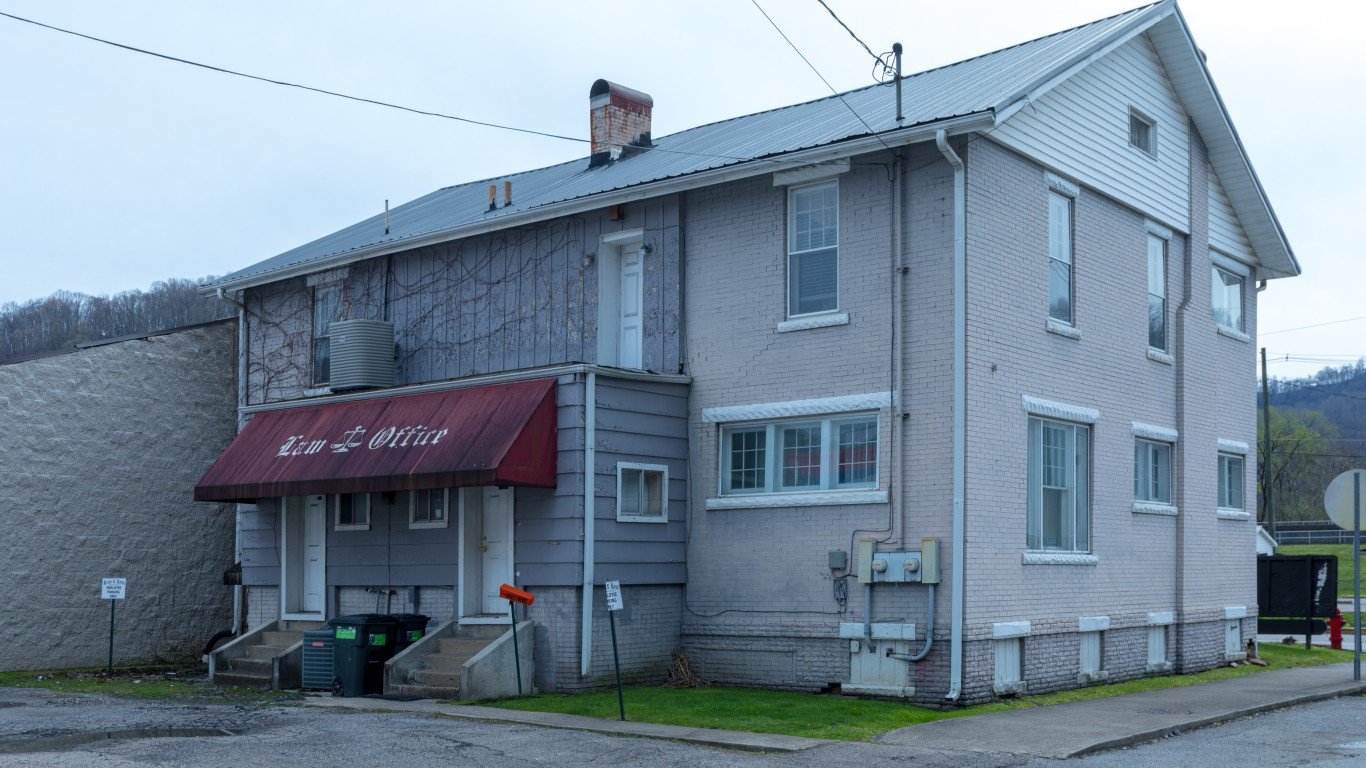
44. Williamson, WV
> Pop. change; 2010-2020: -17.9% (-572 people)
> Total population: 3,188 in 2010; 2,616 in 2020
> Median household income: $25,707
> Poverty rate: 34.9%
> 2020 5-yr. avg. unemployment: 20.5%
[recirclink id=1124973]

43. Mullens, WV
> Pop. change; 2010-2020: -18.0% (-282 people)
> Total population: 1,570 in 2010; 1,288 in 2020
> Median household income: $50,688
> Poverty rate: 16.6%
> 2020 5-yr. avg. unemployment: 2.9%

42. Lambert, MS
> Pop. change; 2010-2020: -18.1% (-292 people)
> Total population: 1,617 in 2010; 1,325 in 2020
> Median household income: $18,125
> Poverty rate: 42.2%
> 2020 5-yr. avg. unemployment: 24.0%
[in-text-ad-2]

41. Allendale, SC
> Pop. change; 2010-2020: -18.1% (-626 people)
> Total population: 3,455 in 2010; 2,829 in 2020
> Median household income: N/A
> Poverty rate: N/A
> 2020 5-yr. avg. unemployment: N/A

40. Cameron, MO
> Pop. change; 2010-2020: -18.1% (-1,801 people)
> Total population: 9,937 in 2010; 8,136 in 2020
> Median household income: $57,855
> Poverty rate: 10.3%
> 2020 5-yr. avg. unemployment: 2.4%
[in-text-ad]

39. Leland, MS
> Pop. change; 2010-2020: -18.1% (-811 people)
> Total population: 4,470 in 2010; 3,659 in 2020
> Median household income: $41,465
> Poverty rate: 21.9%
> 2020 5-yr. avg. unemployment: 9.0%
[recirclink id=1045905]
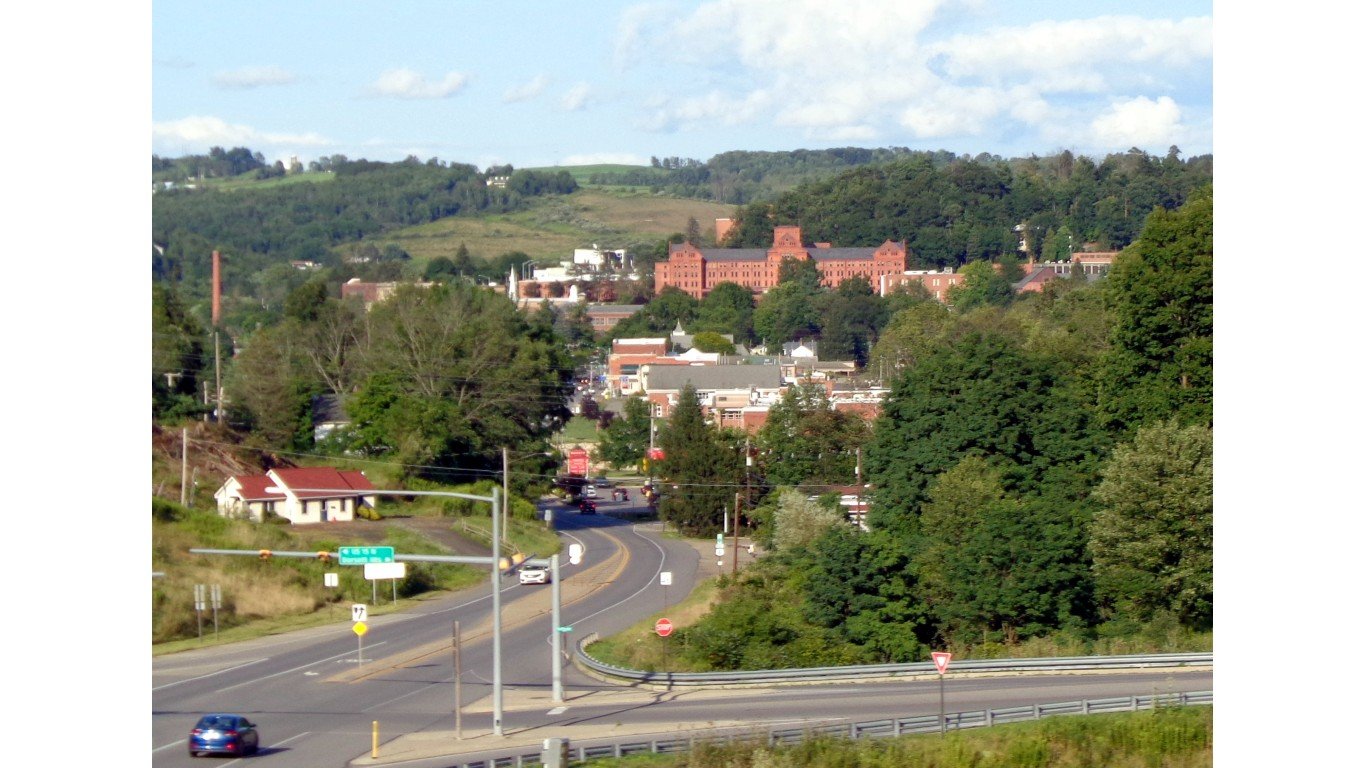
38. Mansfield borough, PA
> Pop. change; 2010-2020: -18.2% (-660 people)
> Total population: 3,632 in 2010; 2,972 in 2020
> Median household income: $37,188
> Poverty rate: 26.3%
> 2020 5-yr. avg. unemployment: 4.1%

37. Marks, MS
> Pop. change; 2010-2020: -18.2% (-313 people)
> Total population: 1,721 in 2010; 1,408 in 2020
> Median household income: $30,250
> Poverty rate: 22.5%
> 2020 5-yr. avg. unemployment: 16.7%
[in-text-ad-2]

36. Drew, MS
> Pop. change; 2010-2020: -18.3% (-353 people)
> Total population: 1,932 in 2010; 1,579 in 2020
> Median household income: $20,325
> Poverty rate: 45.3%
> 2020 5-yr. avg. unemployment: 7.6%

35. Lexington, MS
> Pop. change; 2010-2020: -18.3% (-317 people)
> Total population: 1,729 in 2010; 1,412 in 2020
> Median household income: $30,542
> Poverty rate: 29.2%
> 2020 5-yr. avg. unemployment: 12.0%
[in-text-ad]

34. Tuskegee, AL
> Pop. change; 2010-2020: -18.5% (-1,817 people)
> Total population: 9,843 in 2010; 8,026 in 2020
> Median household income: $28,629
> Poverty rate: 28.4%
> 2020 5-yr. avg. unemployment: 10.7%
[recirclink id=1156704]

33. Susanville, CA
> Pop. change; 2010-2020: -18.5% (-3,282 people)
> Total population: 17,707 in 2010; 14,425 in 2020
> Median household income: $47,685
> Poverty rate: 20.0%
> 2020 5-yr. avg. unemployment: 5.6%

32. Logan, WV
> Pop. change; 2010-2020: -18.6% (-331 people)
> Total population: 1,778 in 2010; 1,447 in 2020
> Median household income: $40,980
> Poverty rate: 19.0%
> 2020 5-yr. avg. unemployment: 7.9%
[in-text-ad-2]

31. Bennettsville, SC
> Pop. change; 2010-2020: -18.9% (-1,736 people)
> Total population: 9,191 in 2010; 7,455 in 2020
> Median household income: N/A
> Poverty rate: N/A
> 2020 5-yr. avg. unemployment: N/A

30. Helena-West Helena, AR
> Pop. change; 2010-2020: -19.2% (-2,390 people)
> Total population: 12,422 in 2010; 10,032 in 2020
> Median household income: $23,483
> Poverty rate: 39.3%
> 2020 5-yr. avg. unemployment: 16.0%
[in-text-ad]

29. Clarksdale, MS
> Pop. change; 2010-2020: -19.3% (-3,456 people)
> Total population: 17,926 in 2010; 14,470 in 2020
> Median household income: $30,603
> Poverty rate: 38.7%
> 2020 5-yr. avg. unemployment: 12.4%
[recirclink id=942076]

28. St. Joseph, LA
> Pop. change; 2010-2020: -19.3% (-226 people)
> Total population: 1,171 in 2010; 945 in 2020
> Median household income: $26,204
> Poverty rate: 22.2%
> 2020 5-yr. avg. unemployment: 14.4%

27. Fairfax, SC
> Pop. change; 2010-2020: -19.3% (-388 people)
> Total population: 2,010 in 2010; 1,622 in 2020
> Median household income: $27,364
> Poverty rate: 30.7%
> 2020 5-yr. avg. unemployment: 14.3%
[in-text-ad-2]

26. Selma, AL
> Pop. change; 2010-2020: -19.7% (-4,096 people)
> Total population: 20,767 in 2010; 16,671 in 2020
> Median household income: $26,581
> Poverty rate: 36.2%
> 2020 5-yr. avg. unemployment: 13.7%

25. Morrisville, NY
> Pop. change; 2010-2020: -19.9% (-430 people)
> Total population: 2,163 in 2010; 1,733 in 2020
> Median household income: $48,100
> Poverty rate: 21.4%
> 2020 5-yr. avg. unemployment: 3.9%
[in-text-ad]

24. Tunica, MS
> Pop. change; 2010-2020: -20.1% (-207 people)
> Total population: 1,030 in 2010; 823 in 2020
> Median household income: $39,716
> Poverty rate: 19.2%
> 2020 5-yr. avg. unemployment: 2.0%
[recirclink id=1147374]

23. Uniontown, AL
> Pop. change; 2010-2020: -20.1% (-542 people)
> Total population: 2,692 in 2010; 2,150 in 2020
> Median household income: $19,408
> Poverty rate: 64.2%
> 2020 5-yr. avg. unemployment: 24.5%
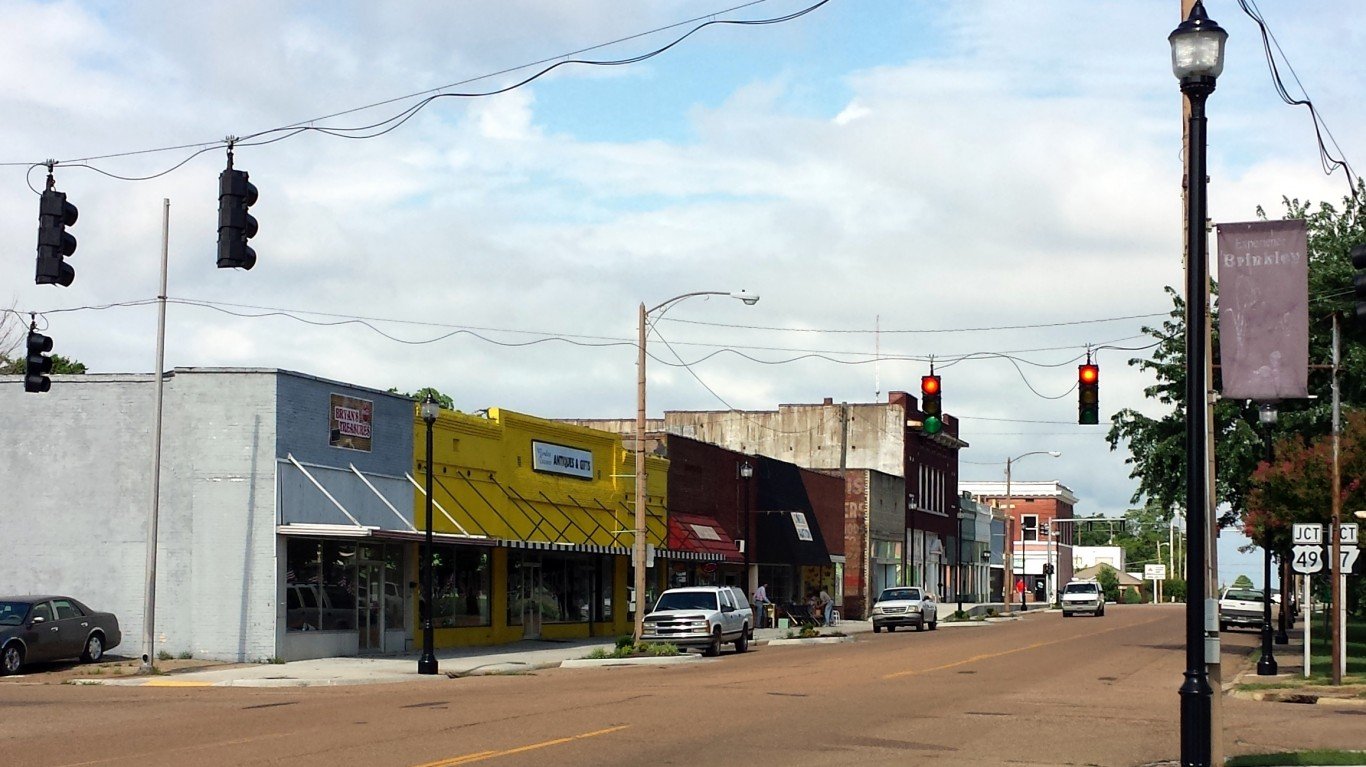
22. Brinkley, AR
> Pop. change; 2010-2020: -20.3% (-645 people)
> Total population: 3,182 in 2010; 2,537 in 2020
> Median household income: N/A
> Poverty rate: N/A
> 2020 5-yr. avg. unemployment: N/A
[in-text-ad-2]

21. Marfa, TX
> Pop. change; 2010-2020: -20.3% (-405 people)
> Total population: 1,996 in 2010; 1,591 in 2020
> Median household income: $41,250
> Poverty rate: 15.9%
> 2020 5-yr. avg. unemployment: 0.0%

20. Hiram, OH
> Pop. change; 2010-2020: -20.4% (-287 people)
> Total population: 1,404 in 2010; 1,117 in 2020
> Median household income: $81,036
> Poverty rate: 0.0%
> 2020 5-yr. avg. unemployment: 9.6%
[in-text-ad]

19. Clarendon, AR
> Pop. change; 2010-2020: -20.5% (-343 people)
> Total population: 1,676 in 2010; 1,333 in 2020
> Median household income: $23,333
> Poverty rate: 23.4%
> 2020 5-yr. avg. unemployment: 9.4%
[recirclink id=1124973]

18. Eldorado, TX
> Pop. change; 2010-2020: -20.8% (-411 people)
> Total population: 1,977 in 2010; 1,566 in 2020
> Median household income: $36,577
> Poverty rate: 21.0%
> 2020 5-yr. avg. unemployment: 8.7%

17. Marianna, AR
> Pop. change; 2010-2020: -21.2% (-885 people)
> Total population: 4,181 in 2010; 3,296 in 2020
> Median household income: $16,704
> Poverty rate: 40.0%
> 2020 5-yr. avg. unemployment: 22.5%
[in-text-ad-2]
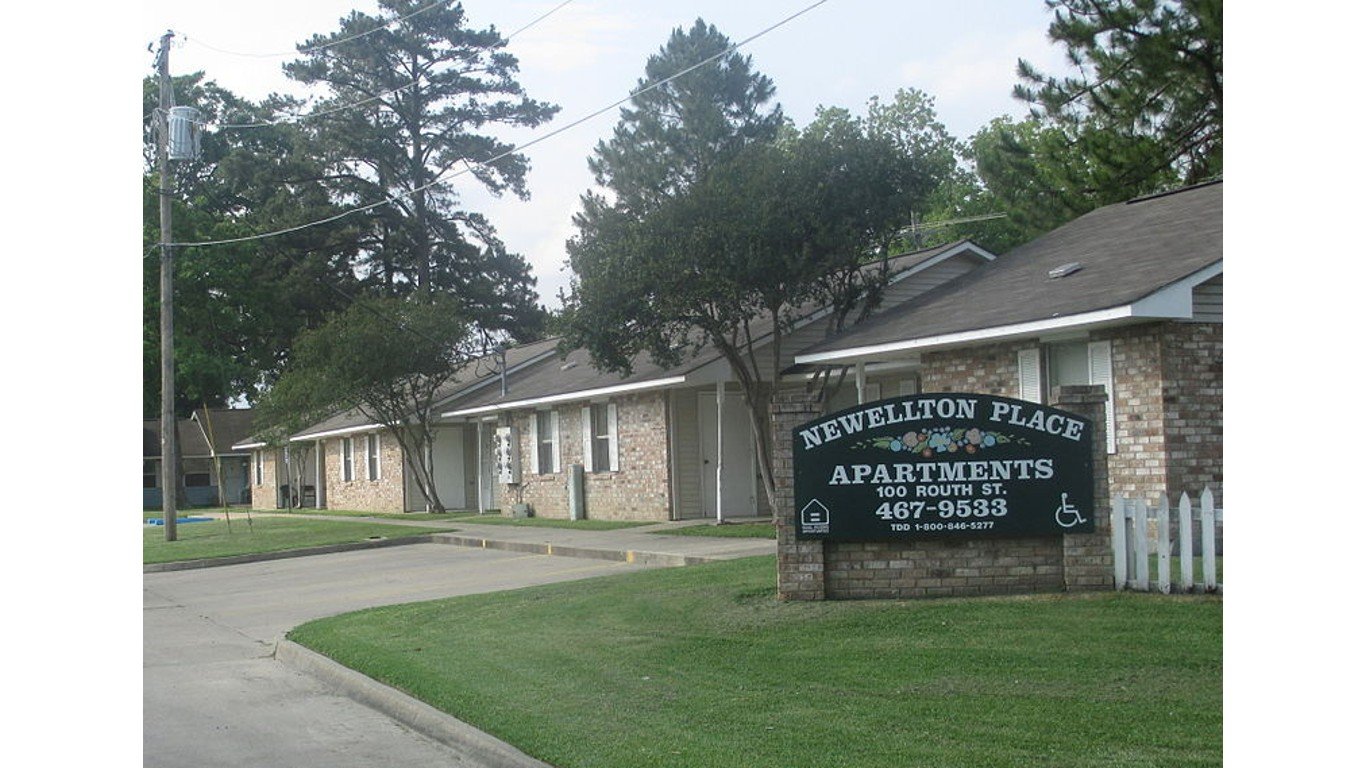
16. Newellton, LA
> Pop. change; 2010-2020: -21.6% (-255 people)
> Total population: 1,182 in 2010; 927 in 2020
> Median household income: $25,766
> Poverty rate: 37.8%
> 2020 5-yr. avg. unemployment: 17.7%

15. Elkhart, KS
> Pop. change; 2010-2020: -21.9% (-484 people)
> Total population: 2,211 in 2010; 1,727 in 2020
> Median household income: $40,765
> Poverty rate: 18.0%
> 2020 5-yr. avg. unemployment: 1.8%
[in-text-ad]

14. Bethany, WV
> Pop. change; 2010-2020: -22.7% (-235 people)
> Total population: 1,035 in 2010; 800 in 2020
> Median household income: N/A
> Poverty rate: N/A
> 2020 5-yr. avg. unemployment: N/A
[recirclink id=1045905]

13. Winona, MS
> Pop. change; 2010-2020: -23.5% (-1,176 people)
> Total population: 5,006 in 2010; 3,830 in 2020
> Median household income: $34,315
> Poverty rate: 40.3%
> 2020 5-yr. avg. unemployment: 5.5%

12. Baldwin, MI
> Pop. change; 2010-2020: -23.6% (-283 people)
> Total population: 1,197 in 2010; 914 in 2020
> Median household income: N/A
> Poverty rate: N/A
> 2020 5-yr. avg. unemployment: N/A
[in-text-ad-2]

11. Marvell, AR
> Pop. change; 2010-2020: -24.3% (-284 people)
> Total population: 1,168 in 2010; 884 in 2020
> Median household income: $33,576
> Poverty rate: 35.5%
> 2020 5-yr. avg. unemployment: 23.3%

10. Marianna, FL
> Pop. change; 2010-2020: -24.4% (-1,839 people)
> Total population: 7,551 in 2010; 5,712 in 2020
> Median household income: $26,747
> Poverty rate: 30.4%
> 2020 5-yr. avg. unemployment: 6.0%
[in-text-ad]

9. Burlington, CO
> Pop. change; 2010-2020: -26.5% (-1,125 people)
> Total population: 4,251 in 2010; 3,126 in 2020
> Median household income: $51,114
> Poverty rate: 6.3%
> 2020 5-yr. avg. unemployment: 3.2%
[recirclink id=1156704]

8. Cairo, IL
> Pop. change; 2010-2020: -29.4% (-829 people)
> Total population: 2,818 in 2010; 1,989 in 2020
> Median household income: $27,661
> Poverty rate: 36.2%
> 2020 5-yr. avg. unemployment: 9.9%

7. Lawrenceville, VA
> Pop. change; 2010-2020: -30.4% (-439 people)
> Total population: 1,442 in 2010; 1,003 in 2020
> Median household income: $26,746
> Poverty rate: 46.6%
> 2020 5-yr. avg. unemployment: 18.0%
[in-text-ad-2]

6. Polkton, NC
> Pop. change; 2010-2020: -31.7% (-1,062 people)
> Total population: 3,350 in 2010; 2,288 in 2020
> Median household income: $43,875
> Poverty rate: 13.5%
> 2020 5-yr. avg. unemployment: 5.3%

5. Welch, WV
> Pop. change; 2010-2020: -34.2% (-820 people)
> Total population: 2,395 in 2010; 1,575 in 2020
> Median household income: $25,227
> Poverty rate: 32.2%
> 2020 5-yr. avg. unemployment: 9.5%
[in-text-ad]

4. Bartlett, TX
> Pop. change; 2010-2020: -34.8% (-944 people)
> Total population: 2,710 in 2010; 1,766 in 2020
> Median household income: N/A
> Poverty rate: N/A
> 2020 5-yr. avg. unemployment: N/A
[recirclink id=942076]

3. Eden, TX
> Pop. change; 2010-2020: -51.8% (-1,441 people)
> Total population: 2,780 in 2010; 1,339 in 2020
> Median household income: $33,804
> Poverty rate: 20.7%
> 2020 5-yr. avg. unemployment: 2.4%

2. Tamms, IL
> Pop. change; 2010-2020: -56.8% (-590 people)
> Total population: 1,039 in 2010; 449 in 2020
> Median household income: $45,227
> Poverty rate: 17.5%
> 2020 5-yr. avg. unemployment: 7.2%
[in-text-ad-2]
1. Wheelwright, KY
> Pop. change; 2010-2020: -59.0% (-700 people)
> Total population: 1,187 in 2010; 487 in 2020
> Median household income: $22,031
> Poverty rate: 39.1%
> 2020 5-yr. avg. unemployment: 21.3%
Methodology
To identify the 50 fastest shrinking towns in America, 24/7 Wall St. reviewed population data from the U.S. Census Bureau’s Population and Housing Unit Estimates Program. Places are ranked by the percent population change from July 1, 2010 to July 1, 2020.
For the purposes of this story, towns are defined by their population – and only incorporated places with populations between 1,000 and 25,000 on July 1, 2010 were considered.
We also considered median household income, the share of households earning over $200,000 annually, and unemployment rate. Each of these measures is a five year estimate from the U.S. Census Bureau’s 2020 American Community Survey.
Contact [email protected] for any questions or corrections.