
How much money you should have saved depends on numerous factors, including your age, lifestyle, and monthly expenses.
For retirement savings, Fidelity Investments recommends that you have at least the equivalent of your annual salary socked away by age 30; three times your salary by 40; six times by 50; and so on until retirement age. (Here are eight things to consider about your 401k before you retire.)
Then there is emergency savings. That is the money set aside for unexpected life events, like a period of unemployment or surprise home repairs or medical bills. Ideally, this rainy-day fund is separate from the money put away for retirement.
Unfortunately, Americans are doing poorly in savings of any kind.
One in four have nothing saved for retirement, and many more are not saving enough for their sunset years, according to PwC’s Retirement in America Report released last year. For emergency savings, most Americans wouldn’t last six months with the money they have set aside, according to state-by-state data on average individual savings, personal consumption, and cost of living.
To determine how long the typical person can live on savings alone in every state, 24/7 Wall St. used savings and personal consumption data to calculate how long the average total savings would last in days. States are ranked by the number of days savings would last.
Data on total savings (meaning for any purpose) in each state came from a 2020 survey from finance outlet SlickDeals. Data on each state’s annual personal consumption expenditures in 2020 came from the Bureau of Economic Analysis. Median household income data came from the U.S. Census Bureau. Data for Mississippi was not available, and the state was excluded.
The average individual savings account in most of the country would be sufficient to cover living expenses for at least three months. But residents in only three states — Montana, Wyoming, and South Dakota — have enough savings to last six months. In other words, outside of these three low-population states, the average American saver would run out of rainy-day money somewhere between three and six months. (Here is how to gradually build wealth using passive investing.)
Among the top 10 most populous states, where more than half of the country’s population reside, the average individual savings account in Georgia and Pennsylvania would last for about five-and-a-half months. In California, Florida, Ohio, and Illinois, these savings would be tapped out between the third and fourth month.
Here is how long a typical person can live on savings alone in every state.

49. West Virginia
> How long typical savings last: 68.0 days
> Avg. savings per resident: $6,936 — the lowest
> Annual cost of living: $37,206 — 7th lowest
> Median household income: $51,615 — 4th lowest
[in-text-ad]

48. California
> How long typical savings last: 92.5 days
> Avg. savings per resident: $11,815 — 10th lowest
> Annual cost of living: $46,636 — 9th highest
> Median household income: $77,358 — 13th highest
[recirclink id=1157797]

47. Connecticut
> How long typical savings last: 92.8 days
> Avg. savings per resident: $12,823 — 15th lowest
> Annual cost of living: $50,437 — 3rd highest
> Median household income: $79,043 — 11th highest

46. Tennessee
> How long typical savings last: 93.7 days
> Avg. savings per resident: $9,628 — 2nd lowest
> Annual cost of living: $37,499 — 10th lowest
> Median household income: $54,665 — 7th lowest
[in-text-ad-2]

45. Missouri
> How long typical savings last: 95.6 days
> Avg. savings per resident: $10,478 — 4th lowest
> Annual cost of living: $39,999 — 21st lowest
> Median household income: $61,901 — 16th lowest

44. Colorado
> How long typical savings last: 97.7 days
> Avg. savings per resident: $12,490 — 14th lowest
> Annual cost of living: $46,642 — 8th highest
> Median household income: $82,611 — 6th highest
[in-text-ad]

43. Florida
> How long typical savings last: 100.0 days
> Avg. savings per resident: $11,955 — 11th lowest
> Annual cost of living: $43,615 — 19th highest
> Median household income: $57,435 — 10th lowest
[recirclink id=1157618]

42. Vermont
> How long typical savings last: 104.5 days
> Avg. savings per resident: $13,573 — 19th lowest
> Annual cost of living: $47,397 — 7th highest
> Median household income: $66,902 — 24th lowest

41. Ohio
> How long typical savings last: 104.7 days
> Avg. savings per resident: $11,436 — 8th lowest
> Annual cost of living: $39,866 — 20th lowest
> Median household income: $60,110 — 13th lowest
[in-text-ad-2]

40. Oregon
> How long typical savings last: 105.0 days
> Avg. savings per resident: $12,094 — 12th lowest
> Annual cost of living: $42,055 — 23rd highest
> Median household income: $76,554 — 14th highest

39. Idaho
> How long typical savings last: 105.1 days
> Avg. savings per resident: $10,208 — 3rd lowest
> Annual cost of living: $35,459 — 4th lowest
> Median household income: $66,499 — 22nd lowest
[in-text-ad]

38. Louisiana
> How long typical savings last: 106.9 days
> Avg. savings per resident: $10,939 — 6th lowest
> Annual cost of living: $37,354 — 8th lowest
> Median household income: $50,935 — 3rd lowest
[recirclink id=1154210]

37. New Jersey
> How long typical savings last: 110.1 days
> Avg. savings per resident: $15,151 — 20th highest
> Annual cost of living: $50,221 — 4th highest
> Median household income: $85,239 — 4th highest

36. Illinois
> How long typical savings last: 111.3 days
> Avg. savings per resident: $13,416 — 18th lowest
> Annual cost of living: $43,981 — 17th highest
> Median household income: $73,753 — 16th highest
[in-text-ad-2]

35. Arizona
> How long typical savings last: 111.4 days
> Avg. savings per resident: $11,804 — 9th lowest
> Annual cost of living: $38,684 — 16th lowest
> Median household income: $66,628 — 23rd lowest

34. Maryland
> How long typical savings last: 113.7 days
> Avg. savings per resident: $13,815 — 20th lowest
> Annual cost of living: $44,331 — 16th highest
> Median household income: $94,384 — the highest
[in-text-ad]

33. Arkansas
> How long typical savings last: 114.4 days
> Avg. savings per resident: $10,805 — 5th lowest
> Annual cost of living: $34,479 — the lowest
> Median household income: $50,540 — the lowest
[recirclink id=1138210]

32. Washington
> How long typical savings last: 114.4 days
> Avg. savings per resident: $14,431 — 23rd lowest
> Annual cost of living: $46,041 — 10th highest
> Median household income: $81,083 — 8th highest

31. Maine
> How long typical savings last: 118.2 days
> Avg. savings per resident: $14,657 — 24th lowest
> Annual cost of living: $45,272 — 12th highest
> Median household income: $63,440 — 17th lowest
[in-text-ad-2]

30. South Carolina
> How long typical savings last: 119.0 days
> Avg. savings per resident: $12,240 — 13th lowest
> Annual cost of living: $37,544 — 11th lowest
> Median household income: $60,097 — 12th lowest

29. Oklahoma
> How long typical savings last: 120.6 days
> Avg. savings per resident: $11,414 — 7th lowest
> Annual cost of living: $34,533 — 2nd lowest
> Median household income: $52,341 — 5th lowest
[in-text-ad]

28. New York
> How long typical savings last: 121.9 days
> Avg. savings per resident: $16,609 — 18th highest
> Annual cost of living: $49,735 — 5th highest
> Median household income: $68,304 — 23rd highest
[recirclink id=1156642]

27. North Carolina
> How long typical savings last: 126.2 days
> Avg. savings per resident: $13,237 — 16th lowest
> Annual cost of living: $38,295 — 15th lowest
> Median household income: $60,266 — 14th lowest

26. Minnesota
> How long typical savings last: 130.6 days
> Avg. savings per resident: $15,884 — 19th highest
> Annual cost of living: $44,403 — 15th highest
> Median household income: $78,461 — 12th highest
[in-text-ad-2]

25. Kansas
> How long typical savings last: 130.6 days
> Avg. savings per resident: $13,900 — 21st lowest
> Annual cost of living: $38,845 — 17th lowest
> Median household income: $72,815 — 17th highest

24. Alaska
> How long typical savings last: 131.0 days
> Avg. savings per resident: $17,491 — 13th highest
> Annual cost of living: $48,739 — 6th highest
> Median household income: $74,476 — 15th highest
[in-text-ad]

23. Michigan
> How long typical savings last: 132.0 days
> Avg. savings per resident: $14,928 — 23rd highest
> Annual cost of living: $41,274 — 24th lowest
> Median household income: $63,829 — 19th lowest
[recirclink id=1157797]

22. Kentucky
> How long typical savings last: 132.1 days
> Avg. savings per resident: $13,238 — 17th lowest
> Annual cost of living: $36,574 — 6th lowest
> Median household income: $56,525 — 9th lowest

21. Texas
> How long typical savings last: 136.5 days
> Avg. savings per resident: $14,832 — 24th highest
> Annual cost of living: $39,661 — 19th lowest
> Median household income: $68,093 — 24th highest
[in-text-ad-2]

20. Massachusetts
> How long typical savings last: 137.3 days
> Avg. savings per resident: $19,565 — 8th highest
> Annual cost of living: $52,001 — the highest
> Median household income: $86,725 — 3rd highest

19. Indiana
> How long typical savings last: 137.9 days
> Avg. savings per resident: $14,396 — 22nd lowest
> Annual cost of living: $38,097 — 13th lowest
> Median household income: $66,360 — 21st lowest
[in-text-ad]

18. Delaware
> How long typical savings last: 140.2 days
> Avg. savings per resident: $17,451 — 14th highest
> Annual cost of living: $45,434 — 11th highest
> Median household income: $69,132 — 21st highest
[recirclink id=1157618]

17. Utah
> How long typical savings last: 147.2 days
> Avg. savings per resident: $15,066 — 21st highest
> Annual cost of living: $37,369 — 9th lowest
> Median household income: $83,670 — 5th highest

16. Virginia
> How long typical savings last: 147.2 days
> Avg. savings per resident: $17,245 — 15th highest
> Annual cost of living: $42,757 — 21st highest
> Median household income: $81,947 — 7th highest
[in-text-ad-2]

15. Alabama
> How long typical savings last: 150.8 days
> Avg. savings per resident: $14,813 — 25th highest
> Annual cost of living: $35,859 — 5th lowest
> Median household income: $54,393 — 6th lowest

14. New Mexico
> How long typical savings last: 155.7 days
> Avg. savings per resident: $15,039 — 22nd highest
> Annual cost of living: $35,264 — 3rd lowest
> Median household income: $50,822 — 2nd lowest
[in-text-ad]

13. Nevada
> How long typical savings last: 155.9 days
> Avg. savings per resident: $16,752 — 16th highest
> Annual cost of living: $39,211 — 18th lowest
> Median household income: $60,956 — 15th lowest
[recirclink id=1154210]

12. Hawaii
> How long typical savings last: 158.8 days
> Avg. savings per resident: $19,613 — 7th highest
> Annual cost of living: $45,080 — 13th highest
> Median household income: $80,729 — 9th highest

11. North Dakota
> How long typical savings last: 159.3 days
> Avg. savings per resident: $19,185 — 9th highest
> Annual cost of living: $43,945 — 18th highest
> Median household income: $63,657 — 18th lowest
[in-text-ad-2]

10. Iowa
> How long typical savings last: 162.5 days
> Avg. savings per resident: $16,738 — 17th highest
> Annual cost of living: $37,586 — 12th lowest
> Median household income: $68,469 — 22nd highest

9. Nebraska
> How long typical savings last: 164.3 days
> Avg. savings per resident: $18,517 — 11th highest
> Annual cost of living: $41,142 — 23rd lowest
> Median household income: $72,024 — 18th highest
[in-text-ad]

8. Pennsylvania
> How long typical savings last: 165.6 days
> Avg. savings per resident: $20,252 — 5th highest
> Annual cost of living: $44,650 — 14th highest
> Median household income: $70,117 — 19th highest
[recirclink id=1138210]

7. Wisconsin
> How long typical savings last: 166.8 days
> Avg. savings per resident: $18,725 — 10th highest
> Annual cost of living: $40,963 — 22nd lowest
> Median household income: $67,094 — 25th highest

6. Georgia
> How long typical savings last: 168.0 days
> Avg. savings per resident: $17,562 — 12th highest
> Annual cost of living: $38,165 — 14th lowest
> Median household income: $58,952 — 11th lowest
[in-text-ad-2]

5. New Hampshire
> How long typical savings last: 170.6 days
> Avg. savings per resident: $24,187 — 2nd highest
> Annual cost of living: $51,760 — 2nd highest
> Median household income: $88,235 — 2nd highest

4. Rhode Island
> How long typical savings last: 171.9 days
> Avg. savings per resident: $20,227 — 6th highest
> Annual cost of living: $42,944 — 20th highest
> Median household income: $80,012 — 10th highest
[in-text-ad]
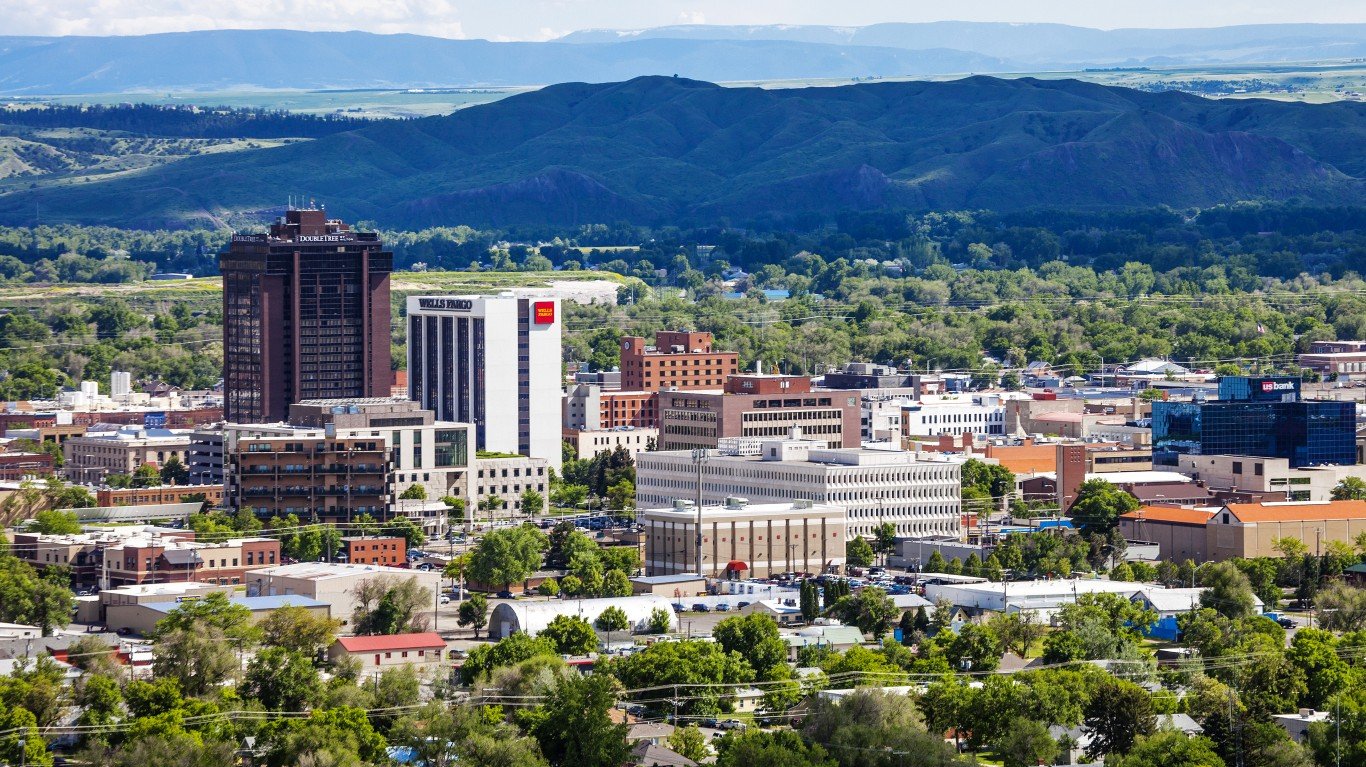
3. Montana
> How long typical savings last: 194.3 days
> Avg. savings per resident: $22,522 — 4th highest
> Annual cost of living: $42,310 — 22nd highest
> Median household income: $56,442 — 8th lowest
[recirclink id=1156642]
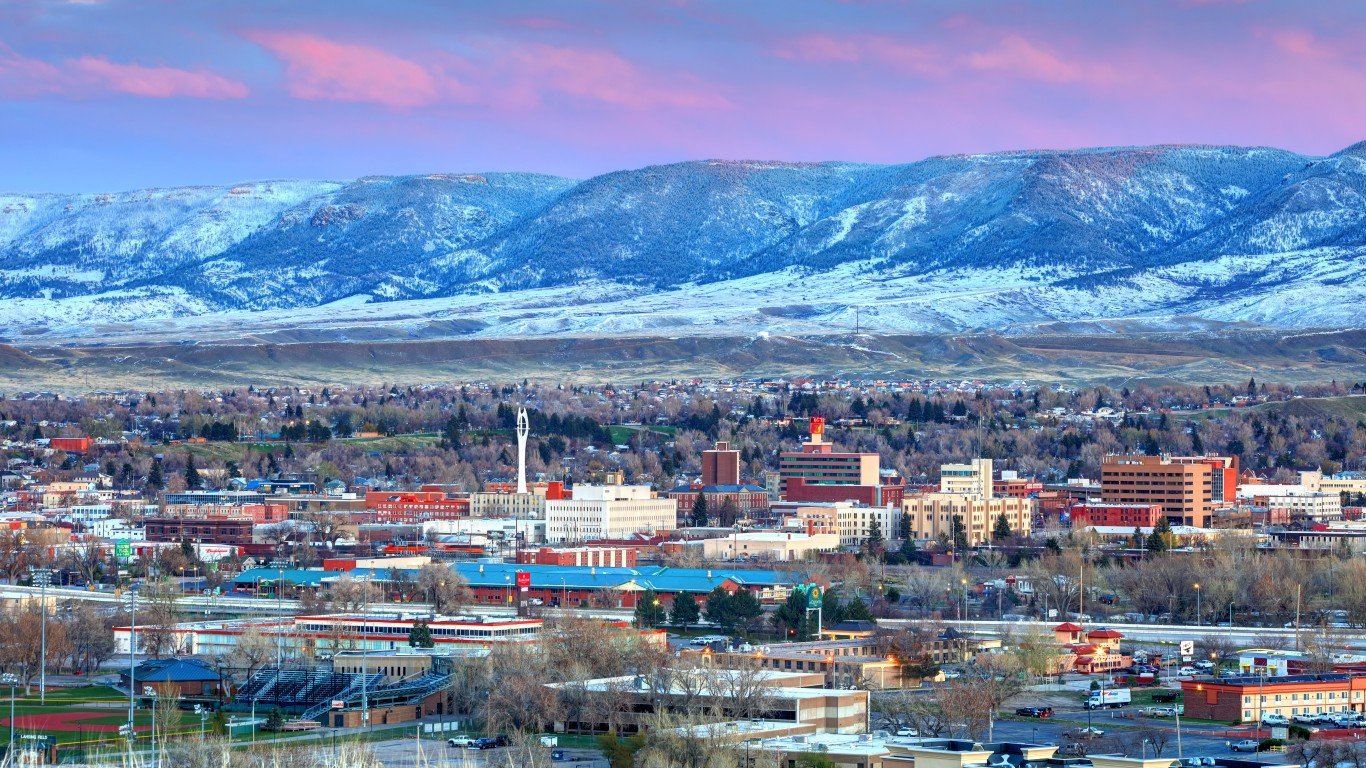
2. Wyoming
> How long typical savings last: 196.6 days
> Avg. savings per resident: $22,626 — 3rd highest
> Annual cost of living: $42,016 — 24th highest
> Median household income: $65,108 — 20th lowest

1. South Dakota
> How long typical savings last: 213.8 days
> Avg. savings per resident: $24,497 — the highest
> Annual cost of living: $41,825 — 25th highest
> Median household income: $69,787 — 20th highest
Contact [email protected] for any questions or corrections.