Disparities in school spending have been a point of contention in the American public education system for decades. Because public schools typically receive the bulk of their funding from local sources such as property taxes, wealthy districts are often better funded than poorer ones.
While studies have shown that higher per pupil spending can improve student outcomes, there are countless other factors – both inside the classroom and outside of it – that can impact a student’s likelihood of success. One of them is financial security at home.
For students from low-income families, setbacks can be more difficult to recover from due to limited supporting resources. A recent report published by the Georgetown Center on Education and the Workforce found that children from well-off families who score poorly on standardized aptitude tests in kindergarten have a 7 in 10 chance of graduating from college and landing a good entry-level job as a young adult. Meanwhile, children from low-income households who score well on the same tests have only a 3 in 10 chance. (Here is a look at the worst school district in each state.)
This study suggests that even if per-pupil spending were equal across the thousands of school districts in the United States, students in low-income areas would still have a considerable disadvantage. Using data from the U.S. Census Bureau and National Center for Education Statistics, 24/7 Wall St. identified the poorest school districts in each state. School districts are ranked by average household income in the district, and only districts with at least 100 students and income data were considered.
Among the districts on this list, average annual household income ranges from about $28,000 to $67,300. The one exception is Hawaii, where all public schools fall under a single district. In the majority of the school districts on this list, graduation rates are below 90%, and in 15, they are 75% or less.
Despite being in lower-income areas with a weaker tax base, most of these schools spend more on a per-pupil basis than the statewide average. This is due in large part to federal and state subsidies, including free lunch programs, that help equalize school funding. Additionally, many of the school districts on this list have a higher concentration of students with specialized needs. For example, in about half of the districts on this list, 20% or more of the students are English language learners or enrolled in an individualized education program. (Here is a look at how much each state spends on its public schools.)
Click here to see the poorest school district in every state.
Click here to see our detailed methodology.
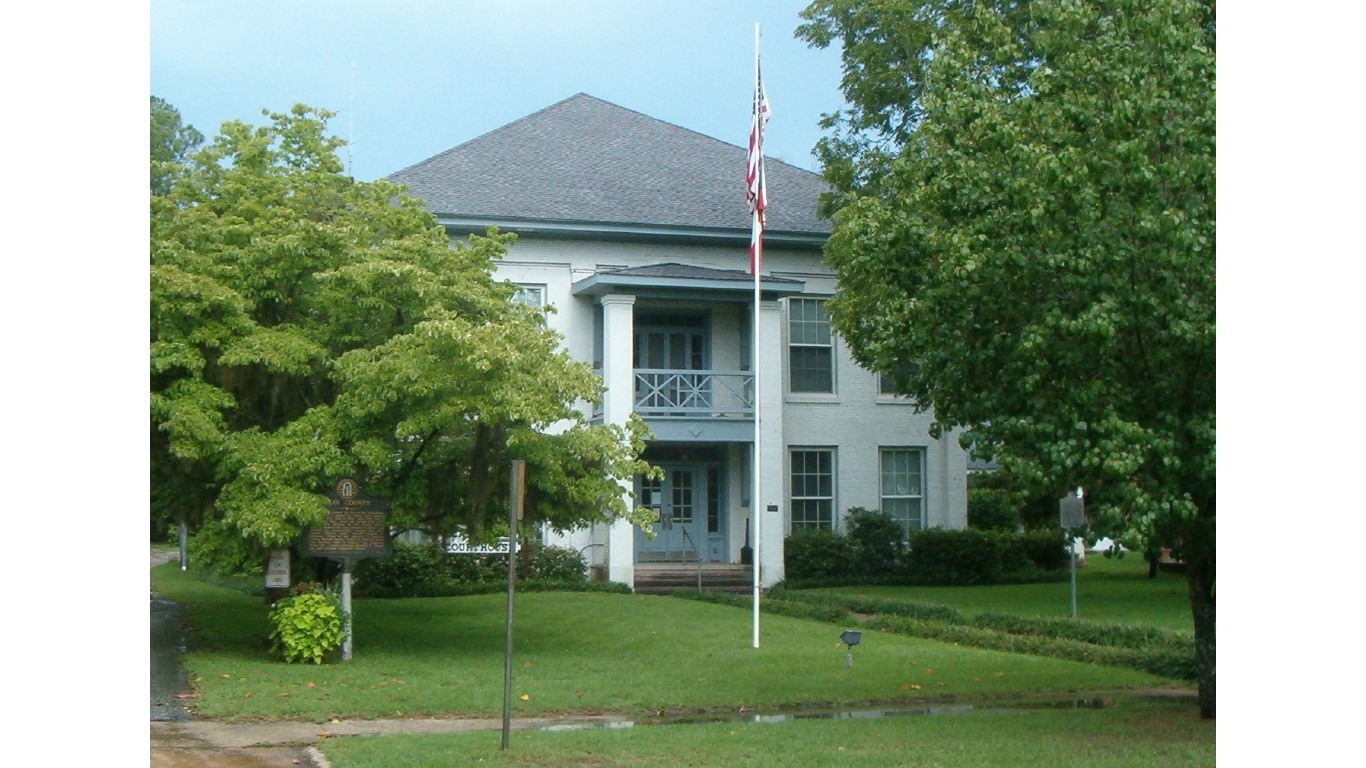
Alabama: Perry County Schools
> Avg. household income: $35,819 (Alabama: $71,964)
> District graduation rate: 95%
> Annual per pupil spending: $11,175 (Alabama: $10,107)
> Student-teacher ratio: 16:1 (Alabama: 18:1)
> District location: Perry County
> Total operational school districts in Alabama: 177
[in-text-ad]

Alaska: Iditarod Area School District
> Avg. household income: $44,607 (Alaska: $98,811)
> District graduation rate: 45%
> Annual per pupil spending: $30,320 (Alaska: $18,393)
> Student-teacher ratio: 18:1 (Alaska: 17:1)
> District location: Yukon-Koyukuk Census Area
> Total operational school districts in Alaska: 54
[recirclink id=1056702]

Arizona: Sacaton Elementary District
> Avg. household income: $27,951 (Arizona: $84,380)
> District graduation rate: N/A
> Annual per pupil spending: $18,050 (Arizona: $8,773)
> Student-teacher ratio: 14:1 (Arizona: 24:1)
> District location: Pinal County
> Total operational school districts in Arizona: 705

Arkansas: Marked Tree School District
> Avg. household income: $39,632 (Arkansas: $69,357)
> District graduation rate: 85%
> Annual per pupil spending: $9,789 (Arkansas: $10,412)
> Student-teacher ratio: 12:1 (Arkansas: 13:1)
> District location: Poinsett County
> Total operational school districts in Arkansas: 294
[in-text-ad-2]

California: Calipatria Unified School District
> Avg. household income: $39,868 (California: $111,622)
> District graduation rate: 92%
> Annual per pupil spending: $15,099 (California: $13,831)
> Student-teacher ratio: 18:1 (California: 23:1)
> District location: Imperial County
> Total operational school districts in California: 2,170
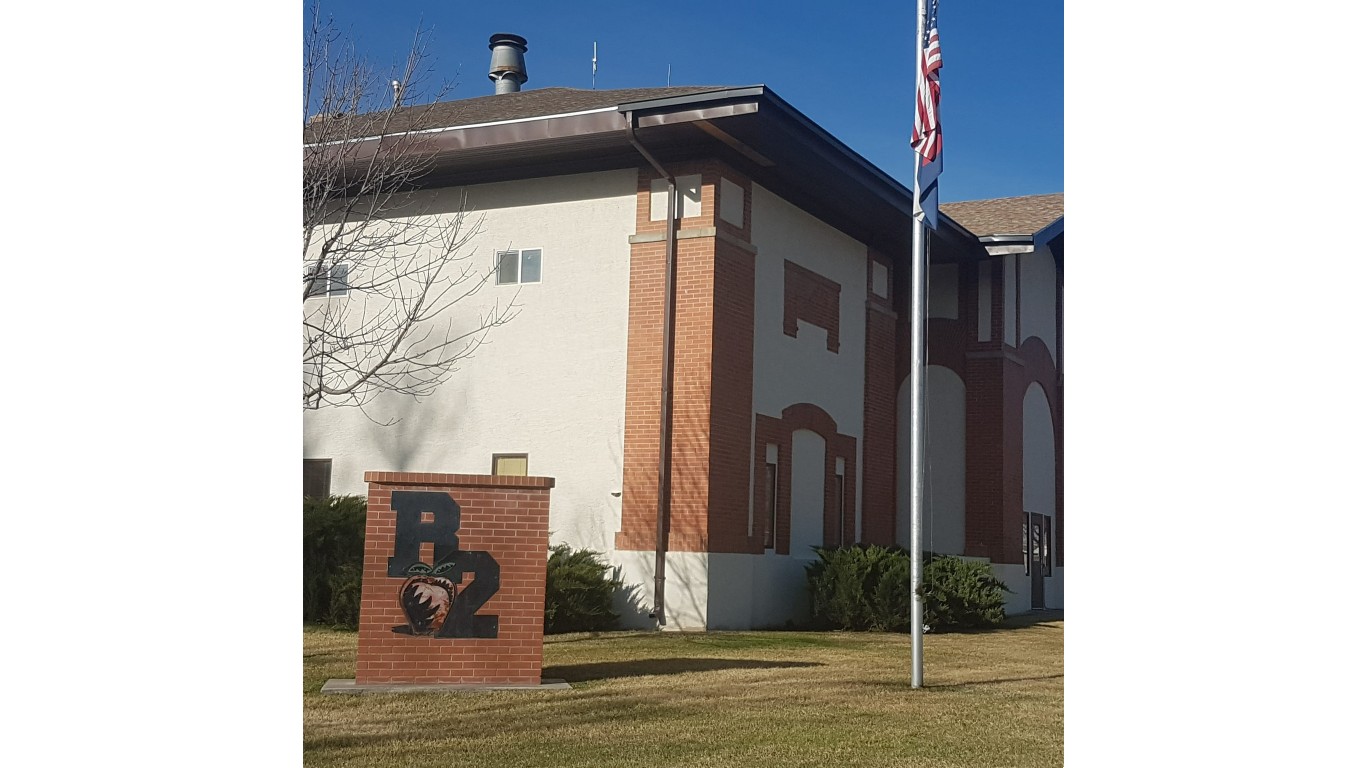
Colorado: Rocky Ford School District No. R2
> Avg. household income: $41,742 (Colorado: $100,933)
> District graduation rate: 90%
> Annual per pupil spending: $11,581 (Colorado: $11,072)
> Student-teacher ratio: 14:1 (Colorado: 17:1)
> District location: Otero County
> Total operational school districts in Colorado: 270
[in-text-ad]

Connecticut: Hartford School District
> Avg. household income: $52,689 (Connecticut: $115,337)
> District graduation rate: 73%
> Annual per pupil spending: $20,570 (Connecticut: $21,140)
> Student-teacher ratio: 14:1 (Connecticut: 12:1)
> District location: Hartford County
> Total operational school districts in Connecticut: 204
[recirclink id=1124916]
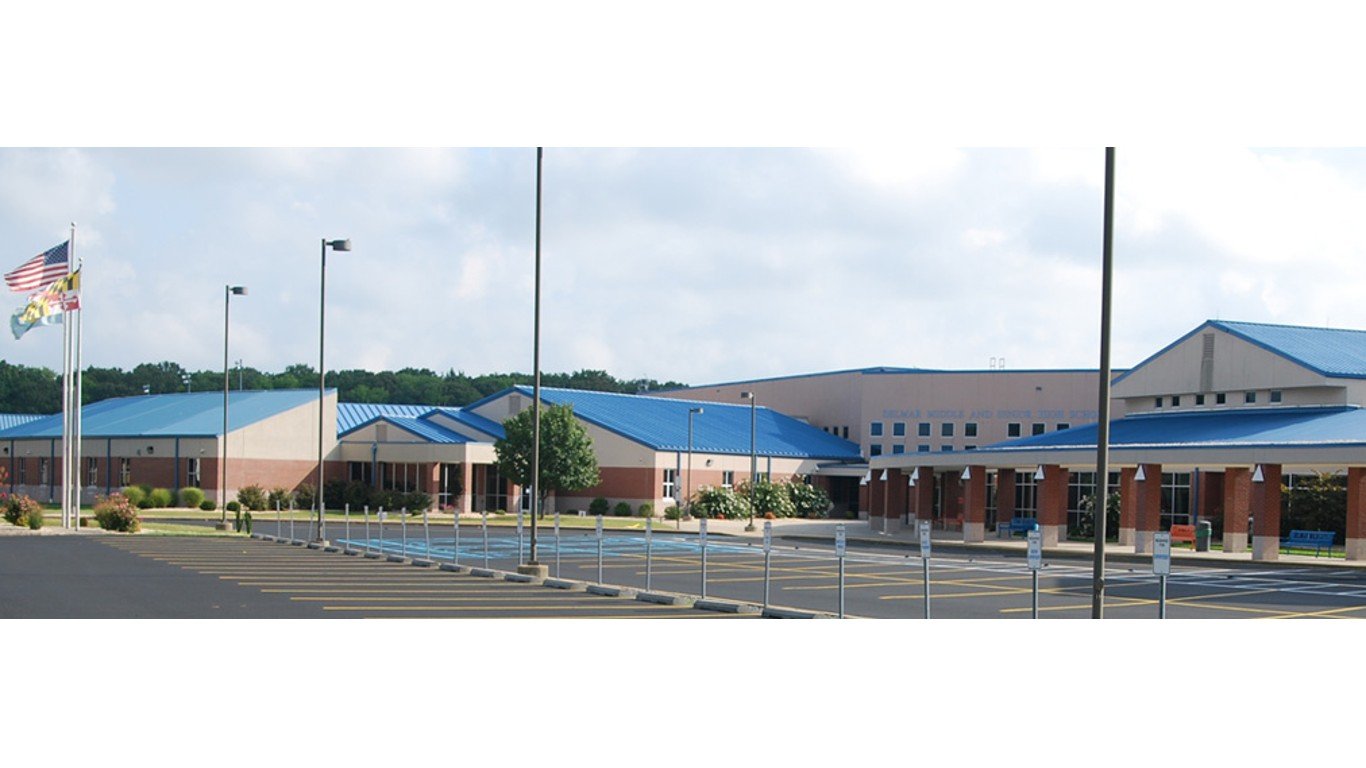
Delaware: Delmar School District
> Avg. household income: $67,304 (Delaware: $92,308)
> District graduation rate: 92%
> Annual per pupil spending: $10,726 (Delaware: $15,929)
> Student-teacher ratio: 19:1 (Delaware: 14:1)
> District location: Sussex County
> Total operational school districts in Delaware: 46

Florida: Washington County School District
> Avg. household income: $48,972 (Florida: $83,104)
> District graduation rate: 80%
> Annual per pupil spending: $10,273 (Florida: $9,986)
> Student-teacher ratio: 16:1 (Florida: 17:1)
> District location: Washington County
> Total operational school districts in Florida: 76
[in-text-ad-2]
Georgia: Clay County Schools
> Avg. household income: $37,701 (Georgia: $85,691)
> District graduation rate: N/A
> Annual per pupil spending: $19,866 (Georgia: $11,203)
> Student-teacher ratio: 10:1 (Georgia: 15:1)
> District location: Clay County
> Total operational school districts in Georgia: 232

Hawaii: Hawaii Department Of Education
> Avg. household income: $103,780 (Hawaii: $107,348)
> District graduation rate: 85%
> Annual per pupil spending: $16,132 (Hawaii: $16,132)
> Student-teacher ratio: 15:1 (Hawaii: 15:1)
> District location: Statewide
> Total operational school districts in Hawaii: 1
[in-text-ad]
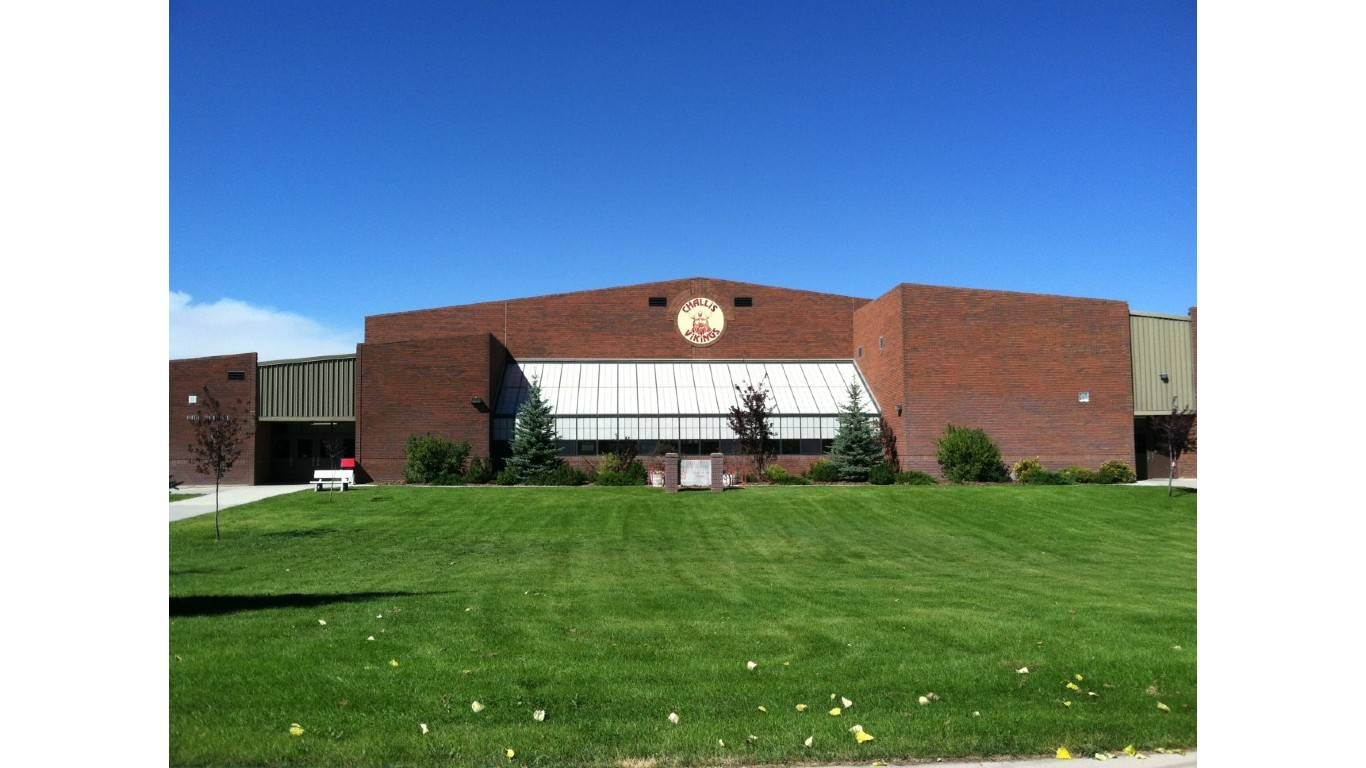
Idaho: Challis Joint District
> Avg. household income: $46,403 (Idaho: $77,399)
> District graduation rate: 75%
> Annual per pupil spending: $11,193 (Idaho: $8,043)
> Student-teacher ratio: 13:1 (Idaho: 19:1)
> District location: Custer County
> Total operational school districts in Idaho: 168
[recirclink id=1129356]

Illinois: Madison Community Unit School District No. 12
> Avg. household income: $36,708 (Illinois: $95,115)
> District graduation rate: 75%
> Annual per pupil spending: $83,114 (Illinois: $16,281)
> Student-teacher ratio: 11:1 (Illinois: 15:1)
> District location: Madison County
> Total operational school districts in Illinois: 1,056

Indiana: Cannelton City Schools
> Avg. household income: $38,746 (Indiana: $76,984)
> District graduation rate: 65%
> Annual per pupil spending: $9,502 (Indiana: $10,252)
> Student-teacher ratio: 16:1 (Indiana: 17:1)
> District location: Perry County
> Total operational school districts in Indiana: 431
[in-text-ad-2]

Iowa: Central Decatur Community School District
> Avg. household income: $52,486 (Iowa: $80,316)
> District graduation rate: 90%
> Annual per pupil spending: $12,181 (Iowa: $11,933)
> Student-teacher ratio: 15:1 (Iowa: 14:1)
> District location: Decatur County
> Total operational school districts in Iowa: 339

Kansas: Galena Unified School District
> Avg. household income: $46,701 (Kansas: $82,103)
> District graduation rate: 87%
> Annual per pupil spending: $11,960 (Kansas: $11,328)
> Student-teacher ratio: 17:1 (Kansas: 14:1)
> District location: Cherokee County
> Total operational school districts in Kansas: 311
[in-text-ad]

Kentucky: Dawson Springs Independent Schools
> Avg. household income: $34,705 (Kentucky: $72,318)
> District graduation rate: 90%
> Annual per pupil spending: $10,872 (Kentucky: $11,280)
> Student-teacher ratio: 14:1 (Kentucky: 16:1)
> District location: Hopkins County
> Total operational school districts in Kentucky: 186
[recirclink id=1036772]

Louisiana: District level income not available
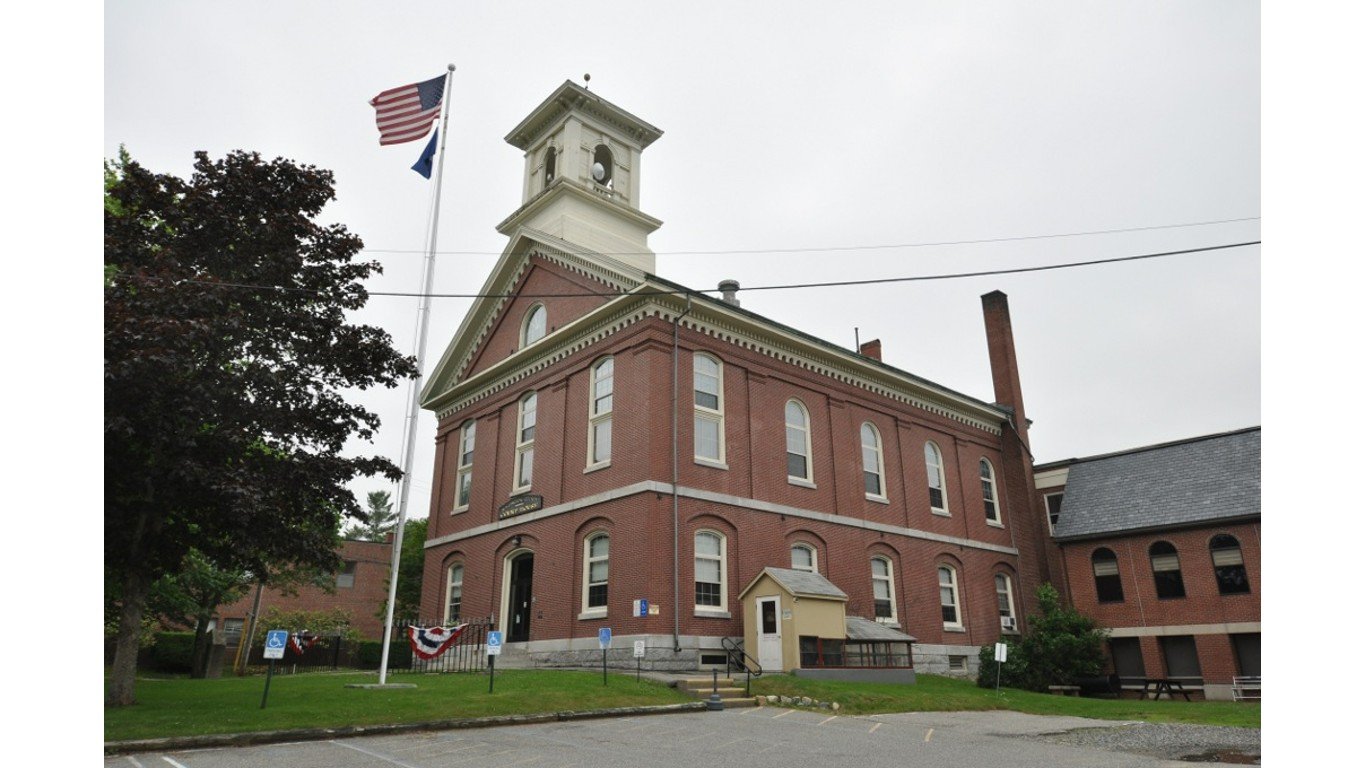
Maine: Machias Public Schools
> Avg. household income: $38,146 (Maine: $78,301)
> District graduation rate: 75%
> Annual per pupil spending: $12,689 (Maine: $15,686)
> Student-teacher ratio: 12:1 (Maine: 12:1)
> District location: Washington County
> Total operational school districts in Maine: 276
[in-text-ad-2]

Maryland: Somerset County Public Schools
> Avg. household income: $55,239 (Maryland: $114,236)
> District graduation rate: 82%
> Annual per pupil spending: $17,717 (Maryland: $15,576)
> Student-teacher ratio: 12:1 (Maryland: 15:1)
> District location: Somerset County
> Total operational school districts in Maryland: 25
Massachusetts: Springfield Public Schools
> Avg. household income: $55,658 (Massachusetts: $115,964)
> District graduation rate: 74%
> Annual per pupil spending: $19,808 (Massachusetts: $19,196)
> Student-teacher ratio: 13:1 (Massachusetts: 13:1)
> District location: Hampden County
> Total operational school districts in Massachusetts: 432
[in-text-ad]
Michigan: River Rouge Public Schools
> Avg. household income: $34,417 (Michigan: $80,803)
> District graduation rate: 80%
> Annual per pupil spending: $11,349 (Michigan: $12,052)
> Student-teacher ratio: 25:1 (Michigan: 18:1)
> District location: Wayne County
> Total operational school districts in Michigan: 895
[recirclink id=1126628]

Minnesota: Red Lake Public School District
> Avg. household income: $46,261 (Minnesota: $96,814)
> District graduation rate: 32%
> Annual per pupil spending: $22,886 (Minnesota: $13,297)
> Student-teacher ratio: 11:1 (Minnesota: 15:1)
> District location: Beltrami County
> Total operational school districts in Minnesota: 564

Mississippi: North Bolivar Cons School Dist
> Avg. household income: $33,778 (Mississippi: $65,156)
> District graduation rate: 82%
> Annual per pupil spending: $10,199 (Mississippi: $9,253)
> Student-teacher ratio: 15:1 (Mississippi: 15:1)
> District location: Bolivar County
> Total operational school districts in Mississippi: 155
[in-text-ad-2]

Missouri: Summersville R-II School District
> Avg. household income: $32,198 (Missouri: $78,194)
> District graduation rate: 90%
> Annual per pupil spending: $8,938 (Missouri: $11,349)
> Student-teacher ratio: 12:1 (Missouri: 13:1)
> District location: Texas County
> Total operational school districts in Missouri: 564

Montana: Browning Elem
> Avg. household income: $42,256 (Montana: $76,834)
> District graduation rate: N/A
> Annual per pupil spending: $16,524 (Montana: $11,984)
> Student-teacher ratio: 13:1 (Montana: 14:1)
> District location: Glacier County
> Total operational school districts in Montana: 487
[in-text-ad]

Nebraska: Omaha Nation Public Schools
> Avg. household income: $38,913 (Nebraska: $82,306)
> District graduation rate: 75%
> Annual per pupil spending: $24,505 (Nebraska: $12,746)
> Student-teacher ratio: 8:1 (Nebraska: 14:1)
> District location: Thurston County
> Total operational school districts in Nebraska: 279
[recirclink id=1056702]

Nevada: Mineral County School District
> Avg. household income: $47,501 (Nevada: $84,350)
> District graduation rate: 85%
> Annual per pupil spending: $14,960 (Nevada: $9,126)
> Student-teacher ratio: 10:1 (Nevada: 21:1)
> District location: Mineral County
> Total operational school districts in Nevada: 21

New Hampshire: Berlin School District
> Avg. household income: $51,978 (New Hampshire: $101,292)
> District graduation rate: 87%
> Annual per pupil spending: $17,739 (New Hampshire: $17,457)
> Student-teacher ratio: 13:1 (New Hampshire: 12:1)
> District location: Coos County
> Total operational school districts in New Hampshire: 308
[in-text-ad-2]

New Jersey: Camden City School District
> Avg. household income: $41,180 (New Jersey: $117,868)
> District graduation rate: 69%
> Annual per pupil spending: $28,845 (New Jersey: $21,331)
> Student-teacher ratio: 9:1 (New Jersey: 12:1)
> District location: Camden County
> Total operational school districts in New Jersey: 688
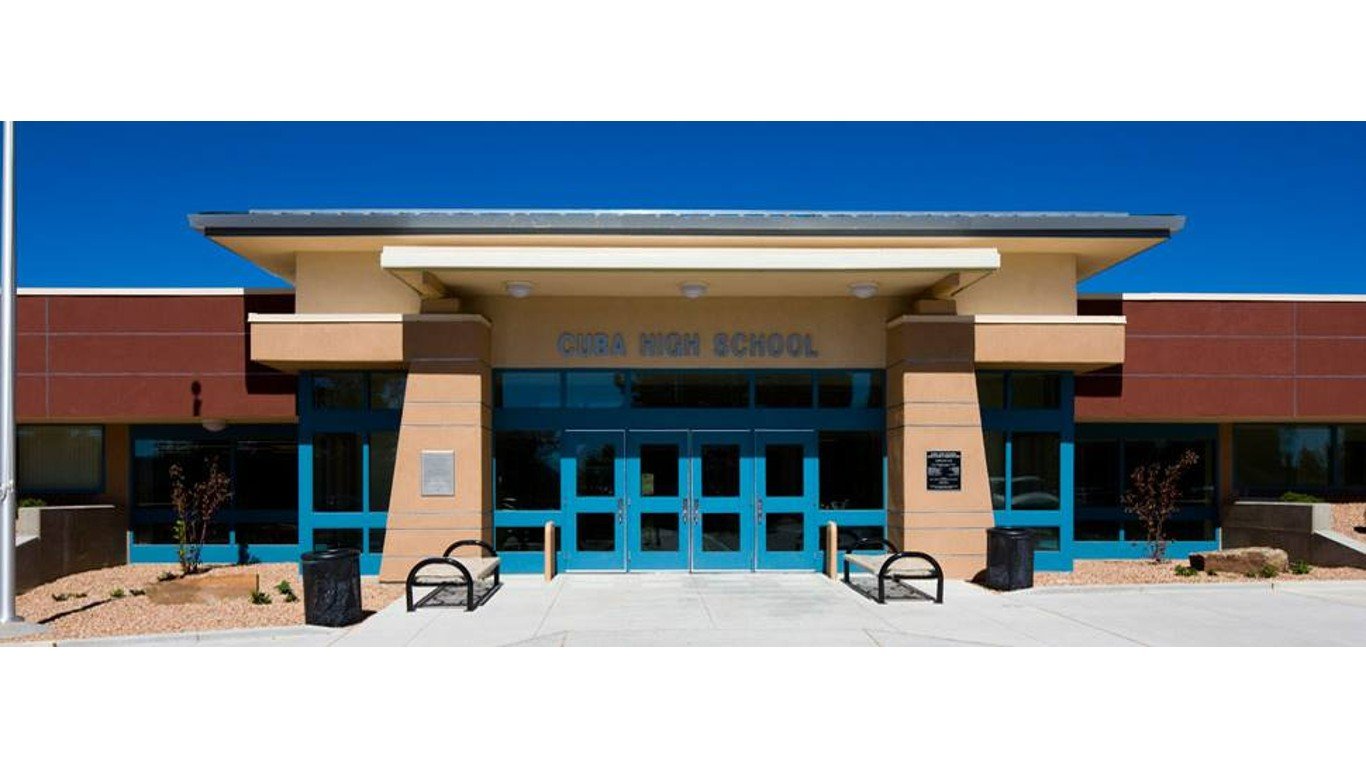
New Mexico: Cuba Independent Schools
> Avg. household income: $33,698 (New Mexico: $70,241)
> District graduation rate: 82%
> Annual per pupil spending: $18,185 (New Mexico: $10,466)
> Student-teacher ratio: 11:1 (New Mexico: 16:1)
> District location: Sandoval County
> Total operational school districts in New Mexico: 146
[in-text-ad]
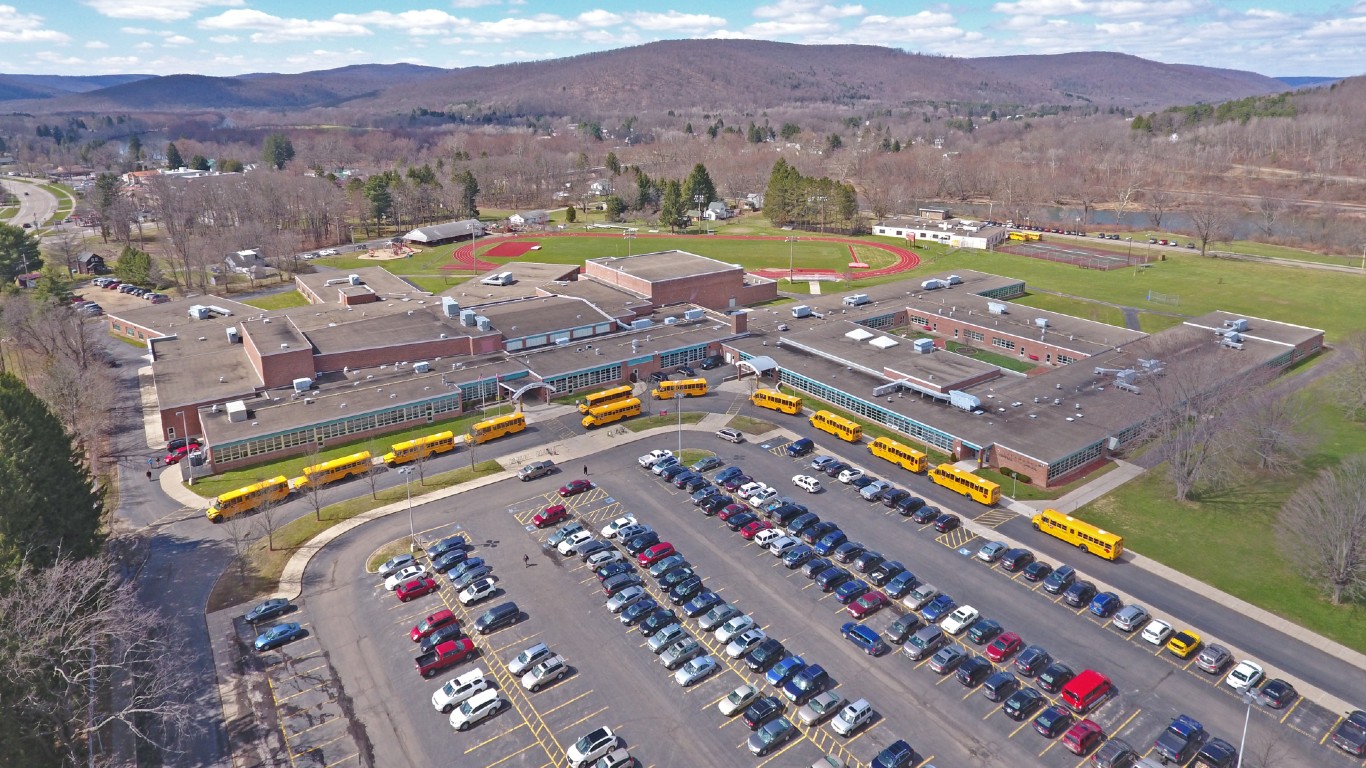
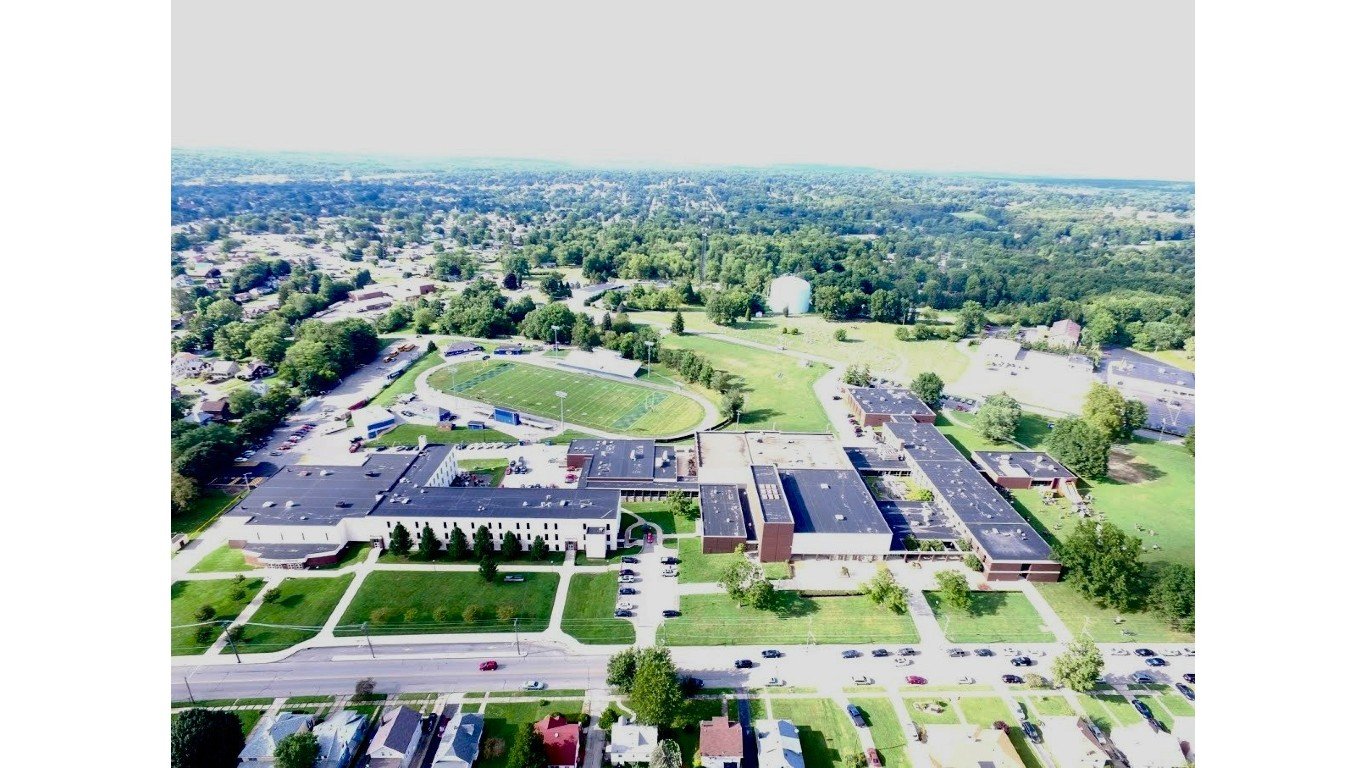
New York: Salamanca City School District
> Avg. household income: $47,627 (New York: $105,304)
> District graduation rate: 77%
> Annual per pupil spending: $24,510 (New York: $24,882)
> Student-teacher ratio: 11:1 (New York: 13:1)
> District location: Cattaraugus County
> Total operational school districts in New York: 1,057
[recirclink id=1124916]
North Carolina: Lexington City Schools
> Avg. household income: $42,105 (North Carolina: $79,620)
> District graduation rate: 87%
> Annual per pupil spending: $10,854 (North Carolina: $9,799)
> Student-teacher ratio: 14:1 (North Carolina: 15:1)
> District location: Davidson County
> Total operational school districts in North Carolina: 330

North Dakota: Ft Totten 30
> Avg. household income: $34,226 (North Dakota: $85,506)
> District graduation rate: 65%
> Annual per pupil spending: $18,574 (North Dakota: $14,033)
> Student-teacher ratio: 8:1 (North Dakota: 12:1)
> District location: Benson County
> Total operational school districts in North Dakota: 225
[in-text-ad-2]

Ohio: New Boston Local
> Avg. household income: $32,291 (Ohio: $78,797)
> District graduation rate: 90%
> Annual per pupil spending: $13,313 (Ohio: $13,433)
> Student-teacher ratio: 16:1 (Ohio: 17:1)
> District location: Scioto County
> Total operational school districts in Ohio: 1,043
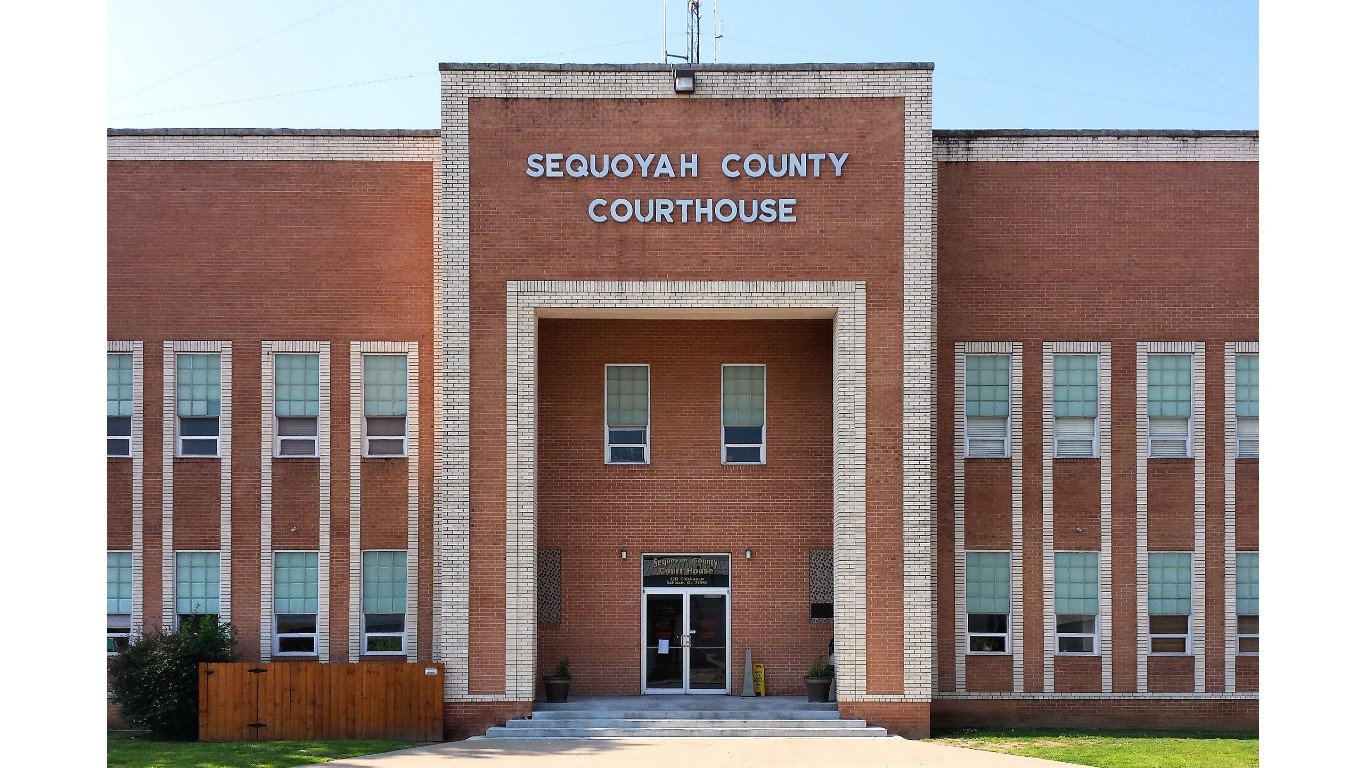
Oklahoma: Moffett Public School
> Avg. household income: $33,844 (Oklahoma: $74,195)
> District graduation rate: N/A
> Annual per pupil spending: $9,090 (Oklahoma: $9,203)
> Student-teacher ratio: 21:1 (Oklahoma: 16:1)
> District location: Sequoyah County
> Total operational school districts in Oklahoma: 597
[in-text-ad]

Oregon: Oakridge School District
> Avg. household income: $44,516 (Oregon: $88,137)
> District graduation rate: 65%
> Annual per pupil spending: $13,266 (Oregon: $12,457)
> Student-teacher ratio: 18:1 (Oregon: 20:1)
> District location: Lane County
> Total operational school districts in Oregon: 222
[recirclink id=1129356]
Pennsylvania: Farrell Area Sd
> Avg. household income: $38,373 (Pennsylvania: $87,262)
> District graduation rate: 90%
> Annual per pupil spending: $32,494 (Pennsylvania: $16,892)
> Student-teacher ratio: 11:1 (Pennsylvania: 14:1)
> District location: Mercer County
> Total operational school districts in Pennsylvania: 789

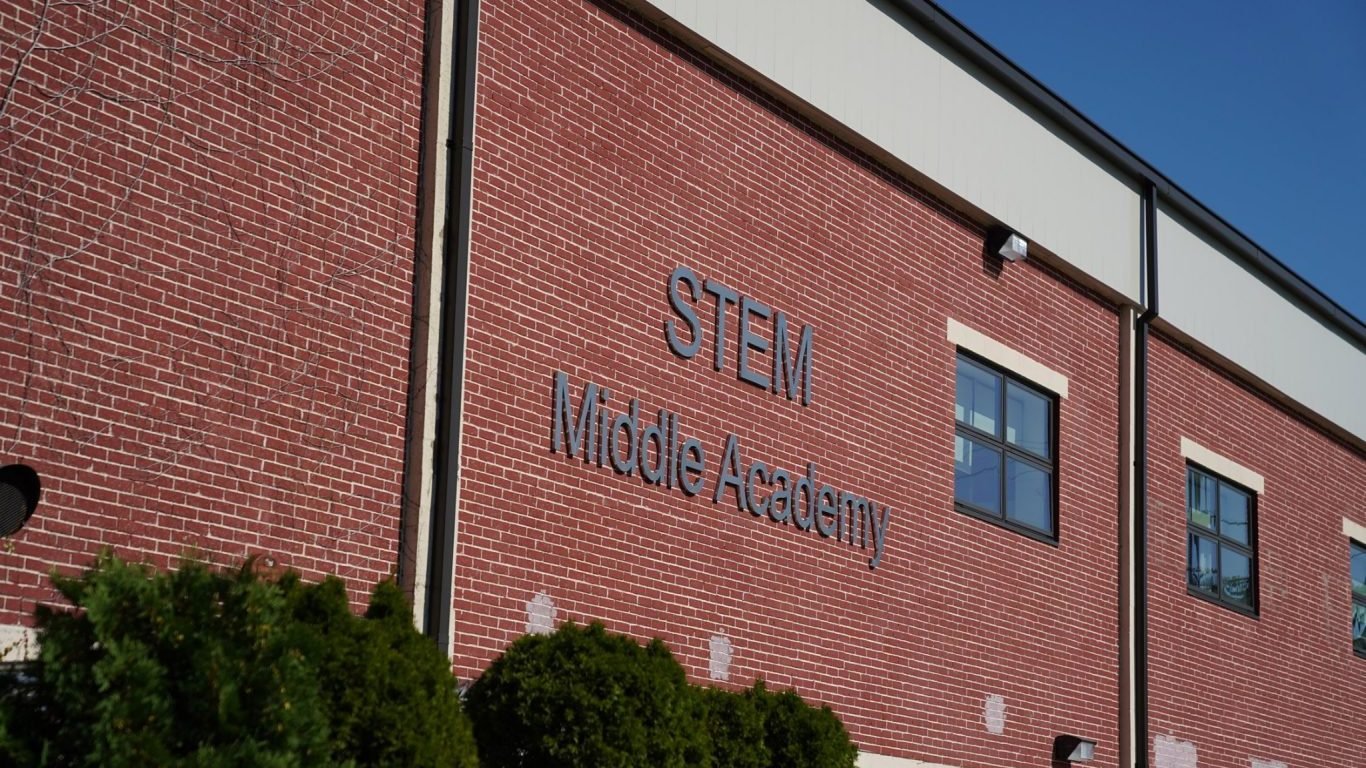
Rhode Island: Central Falls
> Avg. household income: $43,062 (Rhode Island: $92,427)
> District graduation rate: 72%
> Annual per pupil spending: $17,432 (Rhode Island: $17,539)
> Student-teacher ratio: 15:1 (Rhode Island: 13:1)
> District location: Providence County
> Total operational school districts in Rhode Island: 64
[in-text-ad-2]
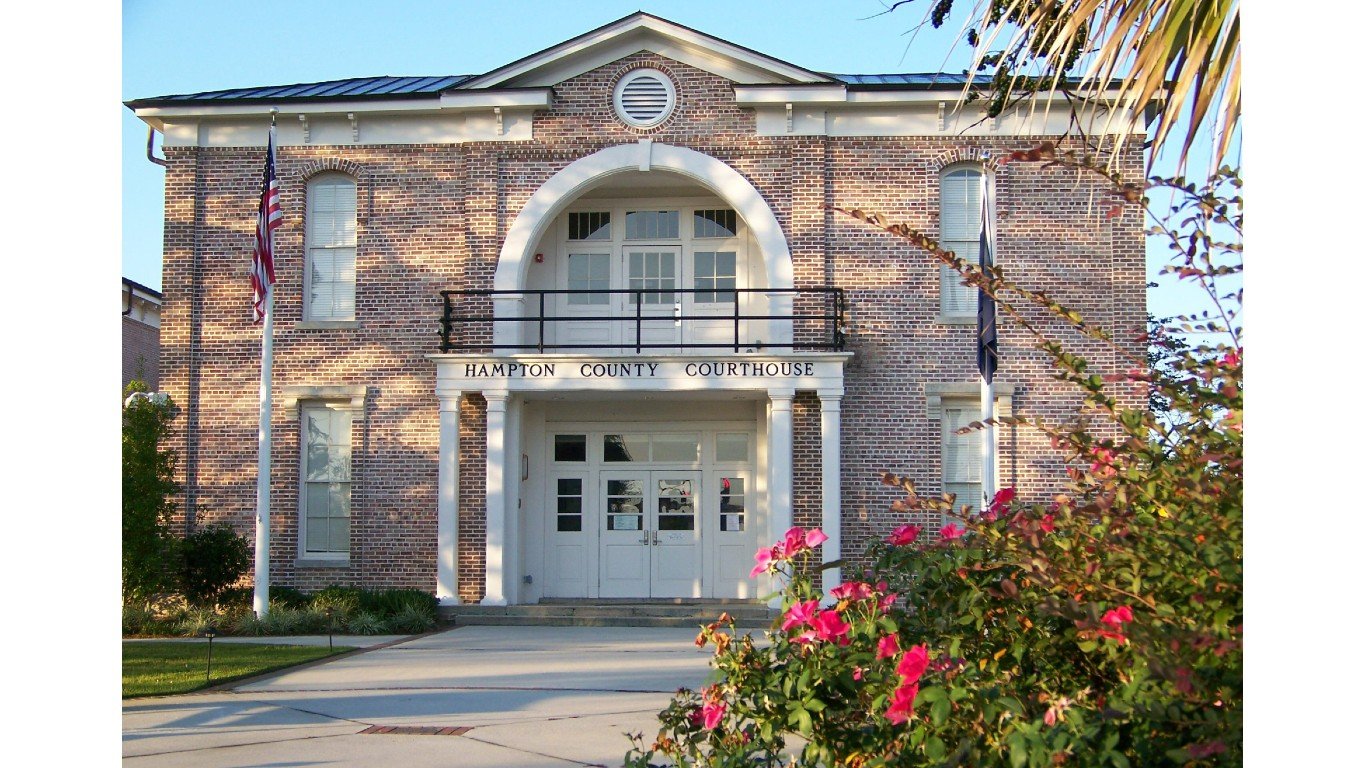
South Carolina: Hampton 02
> Avg. household income: $39,594 (South Carolina: $76,390)
> District graduation rate: 85%
> Annual per pupil spending: $16,261 (South Carolina: $10,994)
> Student-teacher ratio: 13:1 (South Carolina: 15:1)
> District location: Hampton County
> Total operational school districts in South Carolina: 102

South Dakota: Smee School District
> Avg. household income: $32,611 (South Dakota: $77,932)
> District graduation rate: N/A
> Annual per pupil spending: $23,704 (South Dakota: $10,325)
> Student-teacher ratio: 8:1 (South Dakota: 14:1)
> District location: Corson County
> Total operational school districts in South Dakota: 166
[in-text-ad]

Tennessee: Newport Grammar School
> Avg. household income: $32,160 (Tennessee: $76,937)
> District graduation rate: N/A
> Annual per pupil spending: $9,526 (Tennessee: $9,941)
> Student-teacher ratio: 15:1 (Tennessee: 16:1)
> District location: Cocke County
> Total operational school districts in Tennessee: 147
[recirclink id=1036772]
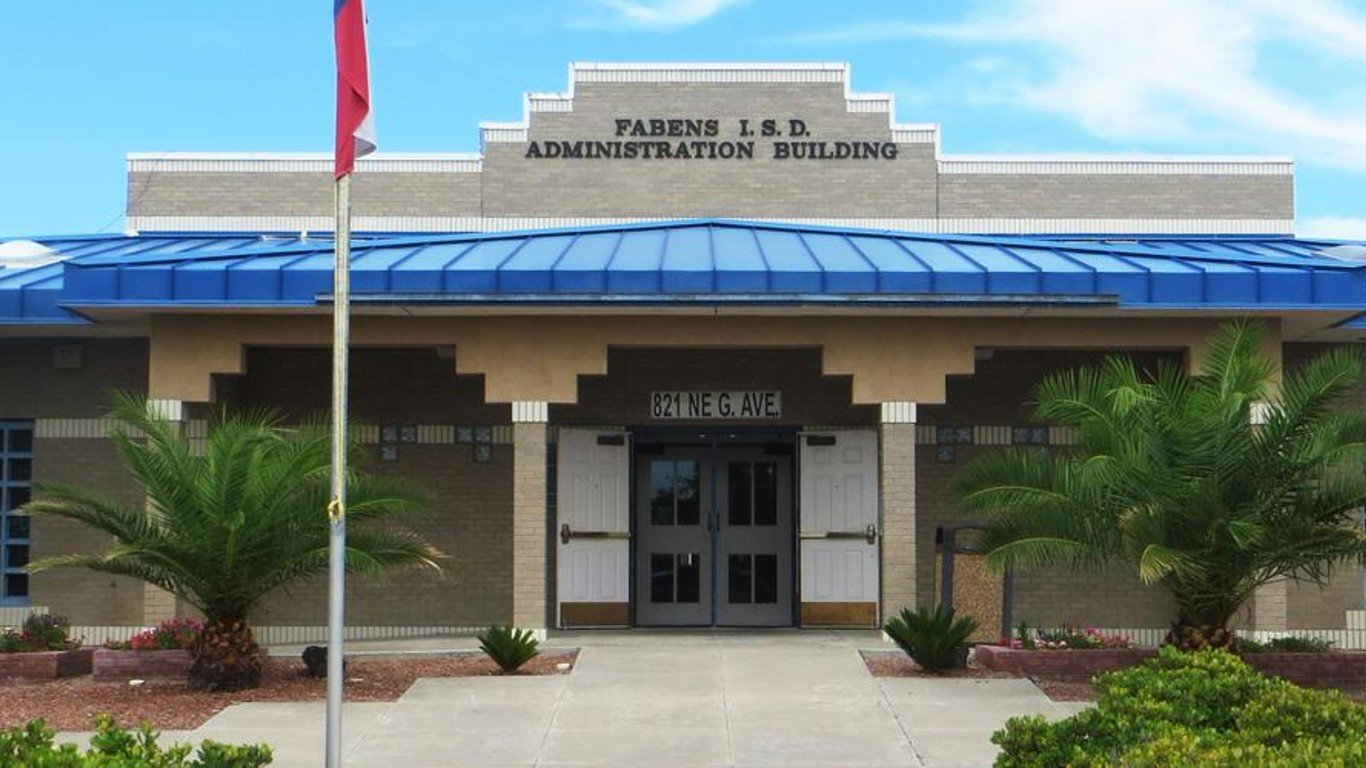
Texas: Fabens Isd
> Avg. household income: $37,856 (Texas: $89,506)
> District graduation rate: 82%
> Annual per pupil spending: $11,016 (Texas: $9,868)
> Student-teacher ratio: 14:1 (Texas: 15:1)
> District location: El Paso County
> Total operational school districts in Texas: 1,226

Utah: Logan City District
> Avg. household income: $55,405 (Utah: $94,452)
> District graduation rate: 84%
> Annual per pupil spending: $8,326 (Utah: $7,950)
> Student-teacher ratio: 23:1 (Utah: 23:1)
> District location: Cache County
> Total operational school districts in Utah: 161
[in-text-ad-2]

Vermont: Saint Johnsbury School District
> Avg. household income: $52,648 (Vermont: $83,767)
> District graduation rate: N/A
> Annual per pupil spending: $13,187 (Vermont: $21,217)
> Student-teacher ratio: 14:1 (Vermont: 11:1)
> District location: Caledonia County
> Total operational school districts in Vermont: 235

Virginia: Buchanan County Public Schools
> Avg. household income: $45,295 (Virginia: $106,023)
> District graduation rate: 87%
> Annual per pupil spending: $11,865 (Virginia: $12,642)
> Student-teacher ratio: 14:1 (Virginia: 15:1)
> District location: Buchanan County
> Total operational school districts in Virginia: 215
[in-text-ad]

Washington: Wellpinit School District
> Avg. household income: $39,478 (Washington: $103,669)
> District graduation rate: 33%
> Annual per pupil spending: $20,959 (Washington: $14,342)
> Student-teacher ratio: 14:1 (Washington: 18:1)
> District location: Stevens County
> Total operational school districts in Washington: 336
[recirclink id=1126628]

West Virginia: Mcdowell County Schools
> Avg. household income: $37,916 (West Virginia: $65,332)
> District graduation rate: 87%
> Annual per pupil spending: $13,070 (West Virginia: $12,269)
> Student-teacher ratio: 14:1 (West Virginia: 14:1)
> District location: McDowell County
> Total operational school districts in West Virginia: 57

Wisconsin: Mellen School District
> Avg. household income: $52,128 (Wisconsin: $82,757)
> District graduation rate: N/A
> Annual per pupil spending: $13,483 (Wisconsin: $12,690)
> Student-teacher ratio: 11:1 (Wisconsin: 14:1)
> District location: Ashland County
> Total operational school districts in Wisconsin: 463
[in-text-ad-2]

Wyoming: Niobrara County School District #1
> Avg. household income: $54,750 (Wyoming: $83,583)
> District graduation rate: 57%
> Annual per pupil spending: $14,656 (Wyoming: $16,228)
> Student-teacher ratio: 13:1 (Wyoming: 13:1)
> District location: Niobrara County
> Total operational school districts in Wyoming: 62
Methodology
To identify the poorest school district in every state, 24/7 Wall St. reviewed mean household income at the district level with five-year data from the U.S. Census Bureau’s 2020 American Community Survey. Only school districts with at least 100 students and data on household income were considered.
We also considered average annual per pupil spending and student-to-teacher ratios at the district and state level from the National Center for Education Statistics. Total operational school districts by state are also from NCES. All NCES data, including enrollment, is for the 2018-2019 academic year, the most recent with available district level expenditure data.
Supplemental data on average graduation rates are from Niche, a school and neighborhood data platform.
Louisiana was excluded from analysis due to a lack of income data at the school district level. Additionally, Hawaii only has one school district, and it ranks as both the richest and poorest by default.
Contact [email protected] for any questions or corrections.