Already weighed down with student debt, millennials also struggle when it comes to buying a house. In some markets, the rise in home prices over the past two decades has made homeownership considerably more unaffordable for many young people. In some markets, housing prices rose far faster than wages. (And with mortgage rate climbing, housing affordability is even harder to reach. These are the mortgage rate in America every year since 1972.)
To determine the cities where home values went up the most since 2000, 24/7 Wall St. reviewed housing values for mid-2000 (or the earliest year possible) and mid-2022, using data from real-estate marketplace company Zillow. We used the seasonally-adjusted Zillow Home Value Index for all single-family residences, condos, and co-ops.
To compare affordability in 2000 and today, we looked at personal income per capita for 2000 and 2021 in each urban area from the Bureau of Economic Analysis. These figures are not inflation adjusted. 2021 population figures also came from the BEA. We then used housing values and incomes to calculate the affordability ratio of housing value-to-income and show how it has changed over the two decades.
It is no surprise where the cities with skyrocketing housing values are found. Twelve are in California, but none of the big three of Los Angeles, San Diego, and San Francisco cracked the top 10. Instead, they ranked 11, 13, and 14, respectively. Today, the current value of a home in those cities hovers around $1 million. (Also see, states where home values increased the most during COVID.)
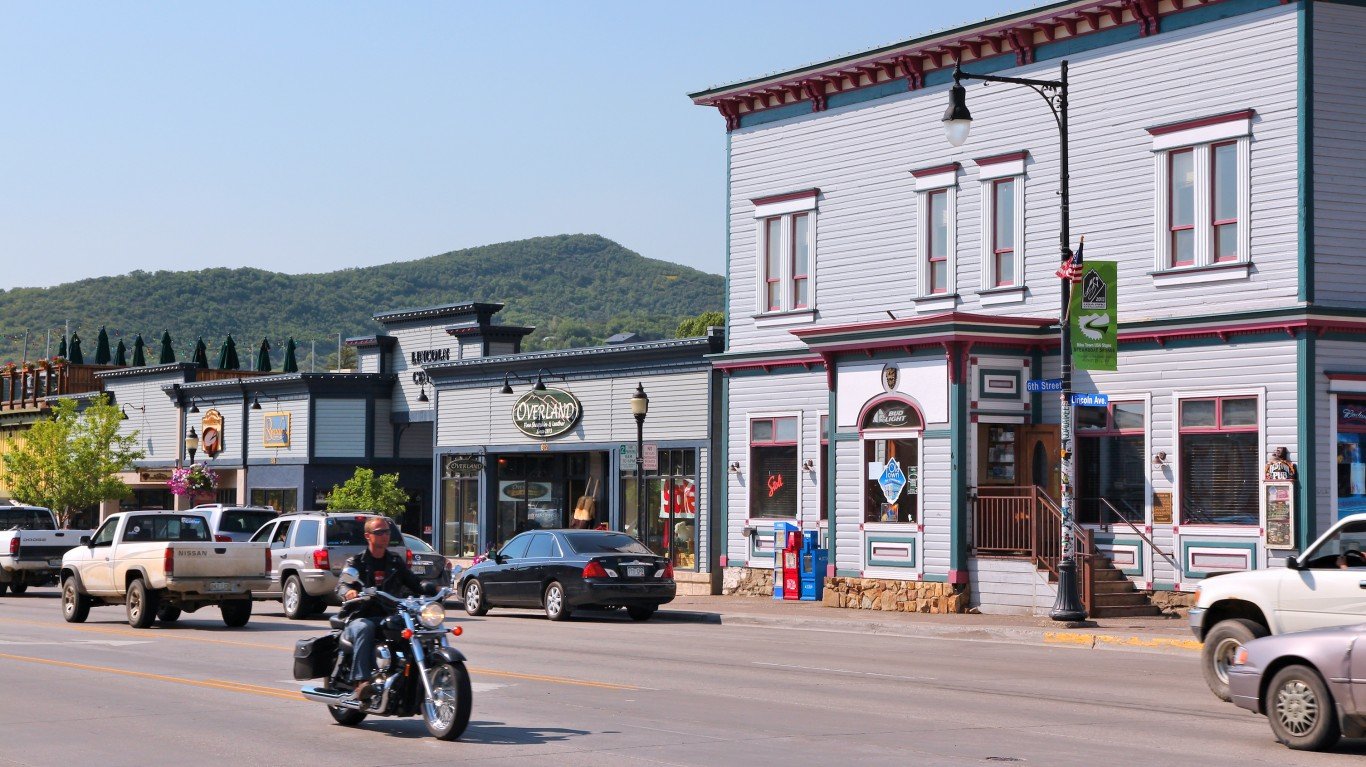
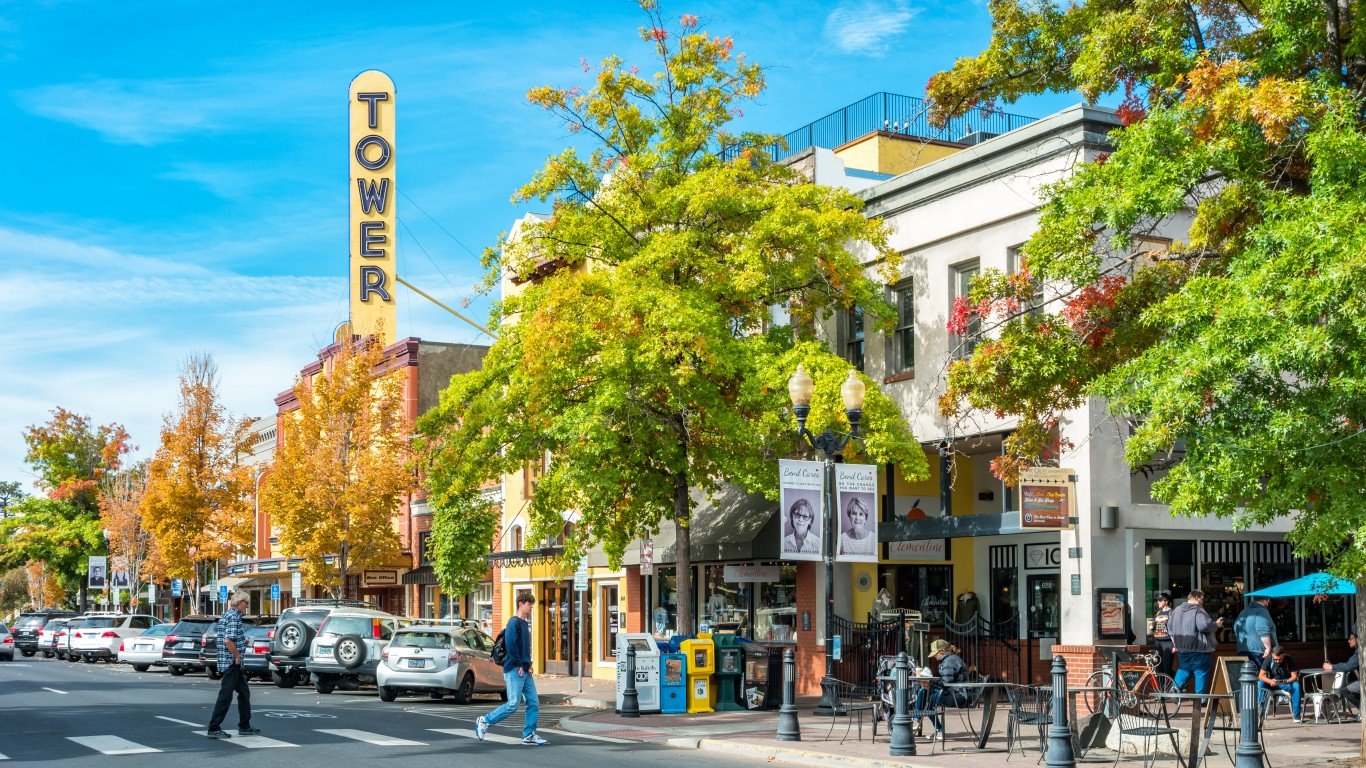
The market where home values leaped nearly the highest over the past two decades is the small, Northern California town of Redding, which came in at No 2. There, home values rose 383%, pushing housing values from $79,489 to $383,588. Meanwhile, personal income per capita edged up only 115%, from just under $26,000 to $54,972 in the past two decades. So if just over three incomes were enough to buy a typical home 20 years ago, today seven incomes would be required.
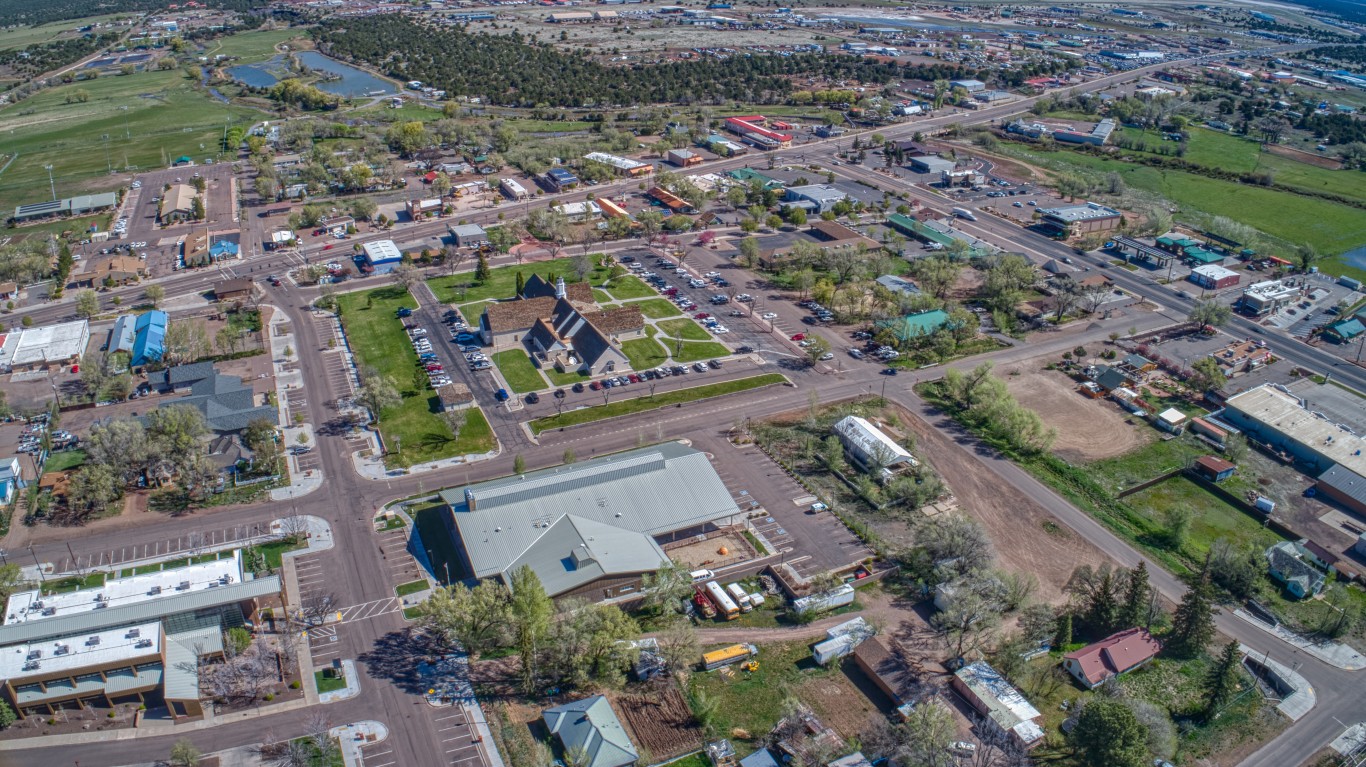
The northern Arizona town of Payson takes the top spot. Between 2000 and 2022, home values soared 400%, from $80,129 to $400,933. Yet per capita incomes rose only 149%, from $19,607 to $48,752. That calculates to a housing value-to-income ratio of 8.2.
With housing prices climbing 378% between 2000 and 2022, Kapaa, Hawaii, lands the No. 3 spot. Kapaa also had the widest gap between housing prices and per capita income increases. The value of homes in this community on the island of Kauai is $906,955. To afford the typical house, a resident would need more than 16 times the current per capita income per capita of $56,103.
To put these cities’ home values in context, Zillow estimates the value of a typical home in the U.S. was $357,589 as of October, 13.5% more than a year ago. The housing value in only three cities on this list is below that number.
Click here to see cities where home values went up the most since 2000.
50. Fresno, CA
> Two-decade housing value chg.: 232%
> Housing values 2000, 2022: $117,366, $389,543
> Personal income per capita 2000, 2021: $23,048, $51,422 – 123% (#92 highest increase)
> Housing value-to-income ratio: 2000: 5.1, 2022: 7.6
> Population, 2021: 1,013,581
[in-text-ad]
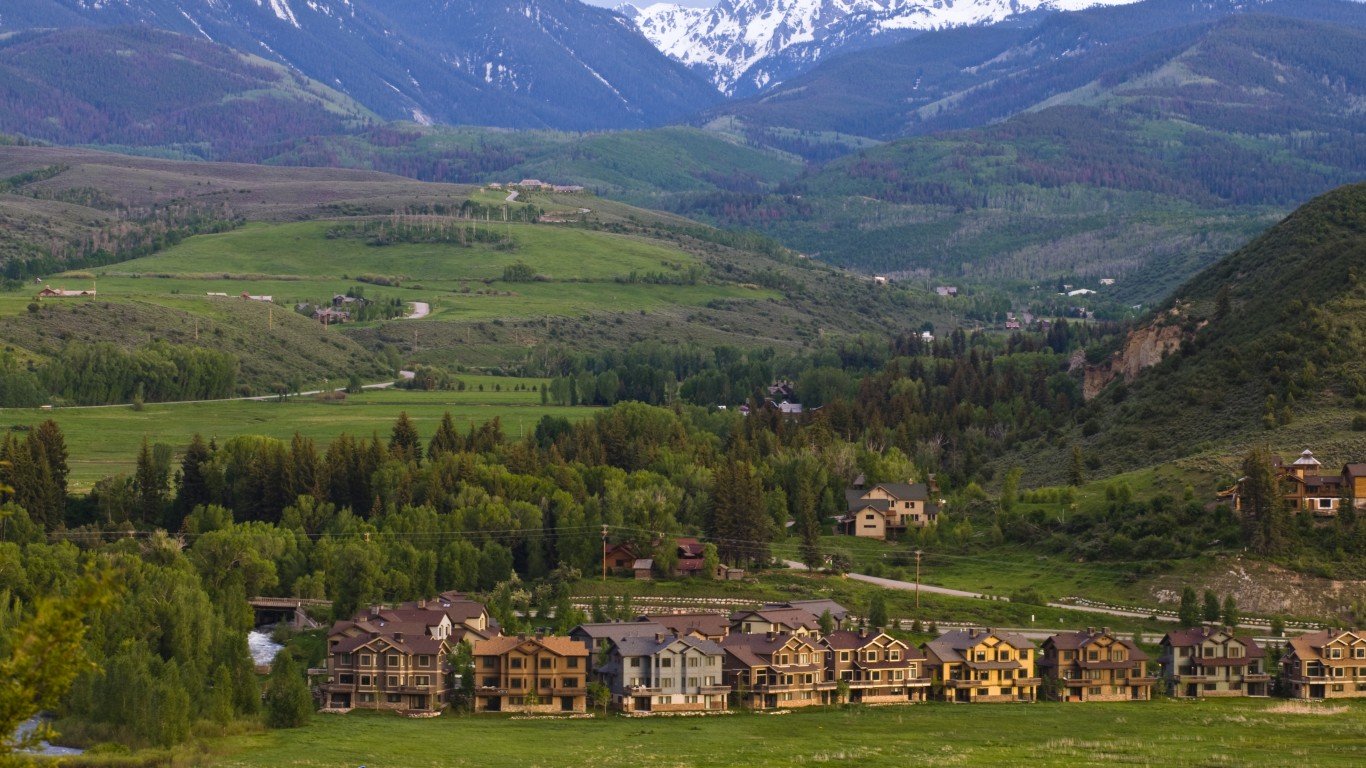
49. Edwards, CO
> Two-decade housing value chg.: 232%
> Housing values 2000, 2022: $368,661, $1,224,016
> Personal income per capita 2000, 2021: $40,102, $97,255 – 143% (#27 highest increase)
> Housing value-to-income ratio: 2000: 9.2, 2022: 12.6
> Population, 2021: 55,727
[recirclink id=1188754]
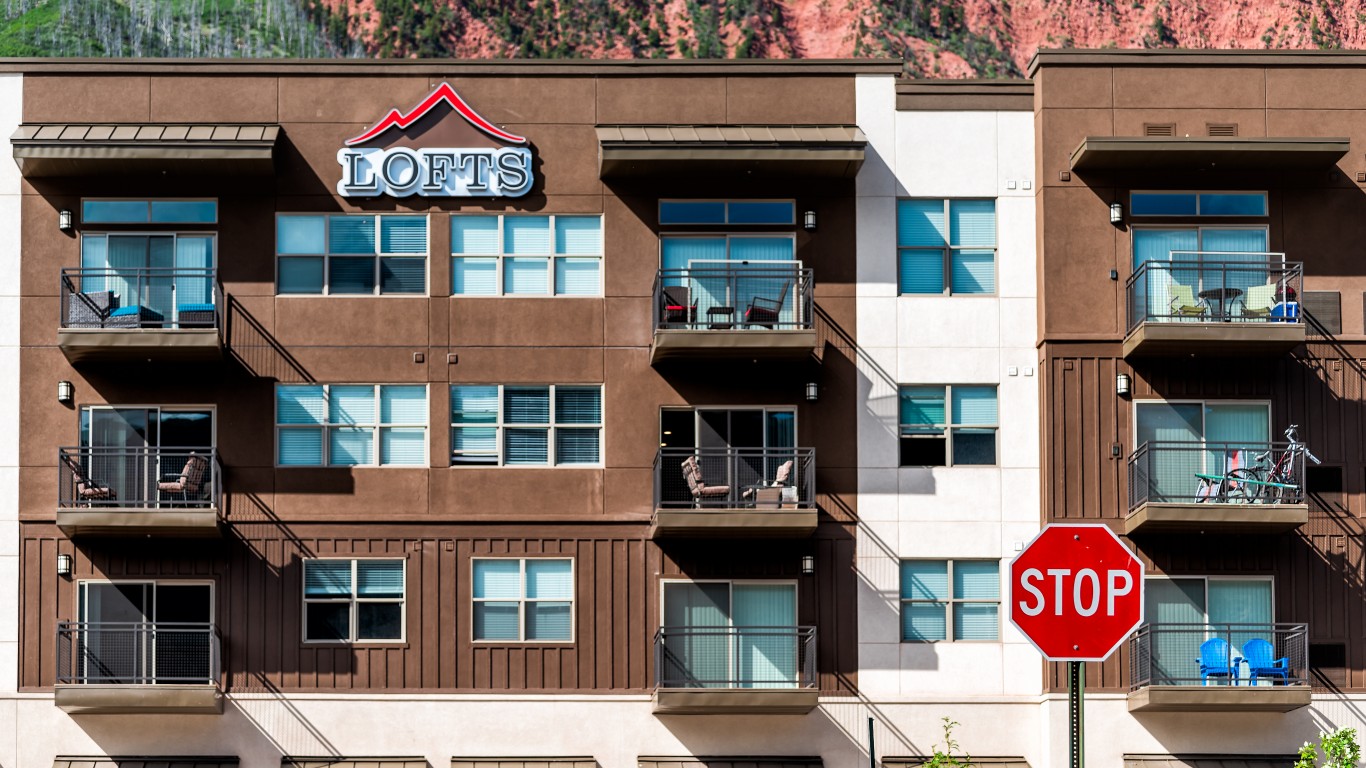
48. Glenwood Springs, CO
> Two-decade housing value chg.: 234%
> Housing values 2000, 2022: $239,649, $800,859
> Personal income per capita 2000, 2021: $43,707, $95,884 – 119% (#127 highest increase)
> Housing value-to-income ratio: 2000: 5.5, 2022: 8.4
> Population, 2021: 79,509
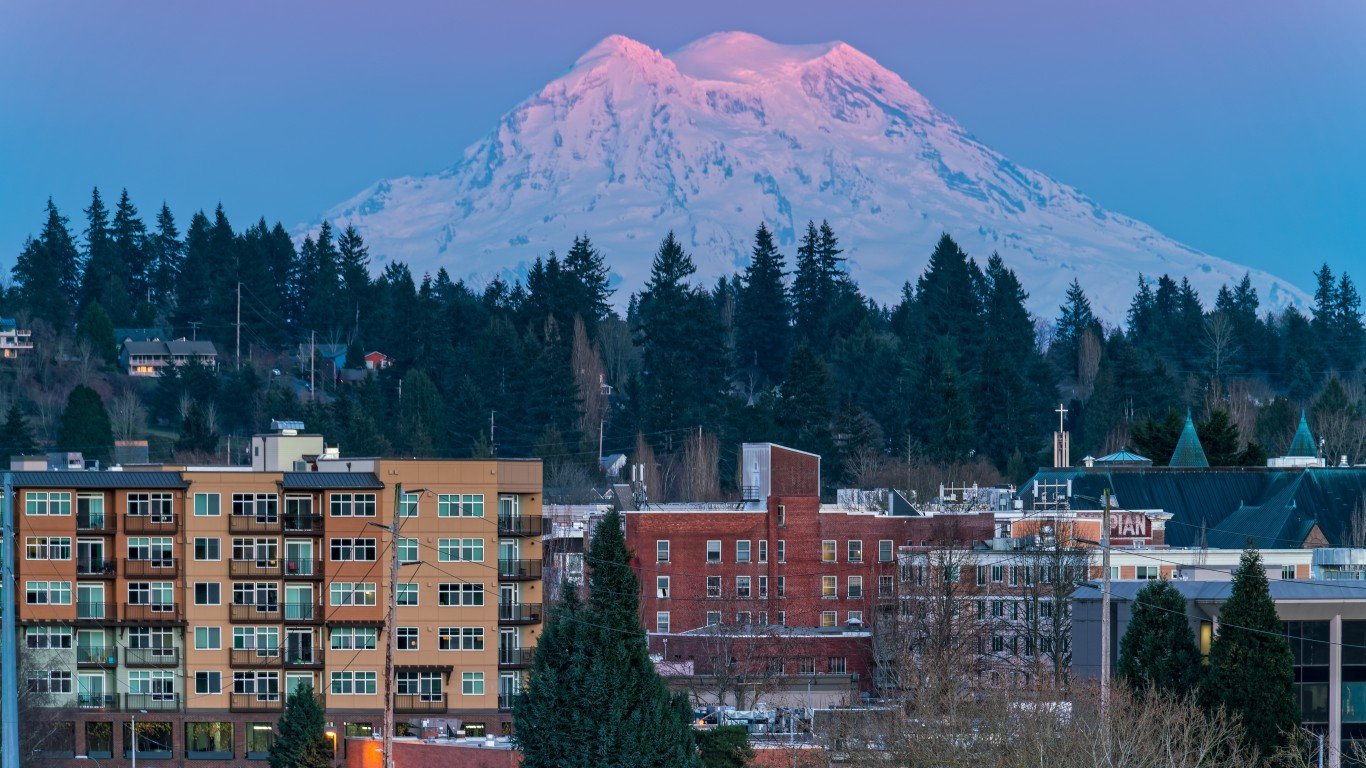
47. Olympia, WA
> Two-decade housing value chg.: 239%
> Housing values 2000, 2022: $156,406, $529,927
> Personal income per capita 2000, 2021: $30,675, $61,062 – 99% (#353 highest increase)
> Housing value-to-income ratio: 2000: 5.1, 2022: 8.7
> Population, 2021: 297,977
[in-text-ad-2]
46. Stockton, CA
> Two-decade housing value chg.: 239%
> Housing values 2000, 2022: $165,823, $562,628
> Personal income per capita 2000, 2021: $25,103, $57,783 – 130% (#52 highest increase)
> Housing value-to-income ratio: 2000: 6.6, 2022: 9.7
> Population, 2021: 789,410
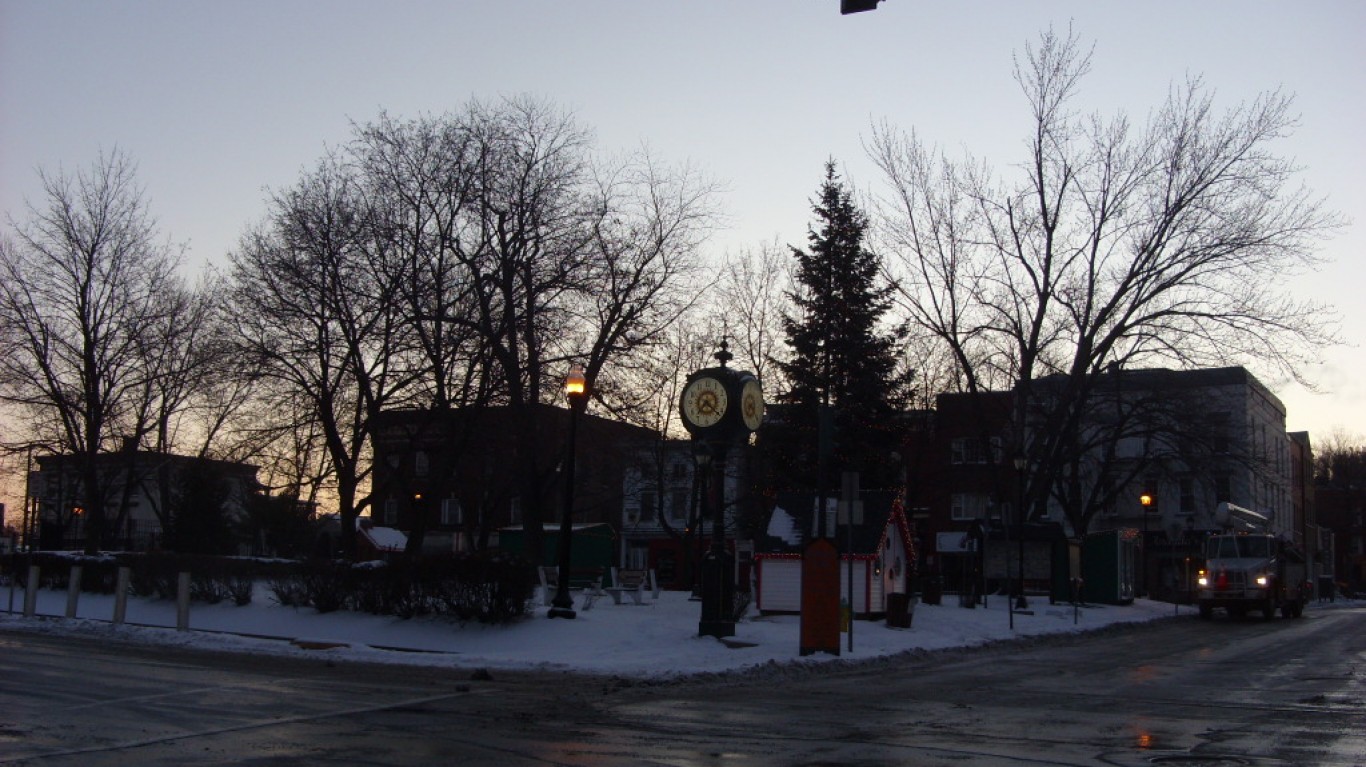
45. Hudson, NY
> Two-decade housing value chg.: 240%
> Housing values 2000, 2022: $111,705, $380,003
> Personal income per capita 2000, 2021: $29,772, $65,426 – 120% (#123 highest increase)
> Housing value-to-income ratio: 2000: 3.8, 2022: 5.8
> Population, 2021: 61,778
[in-text-ad]

44. North Port, FL
> Two-decade housing value chg.: 241%
> Housing values 2000, 2022: $144,902, $494,207
> Personal income per capita 2000, 2021: $36,288, $69,376 – 91% (#444 highest increase)
> Housing value-to-income ratio: 2000: 4.0, 2022: 7.1
> Population, 2021: 859,760
[recirclink id=1172977]
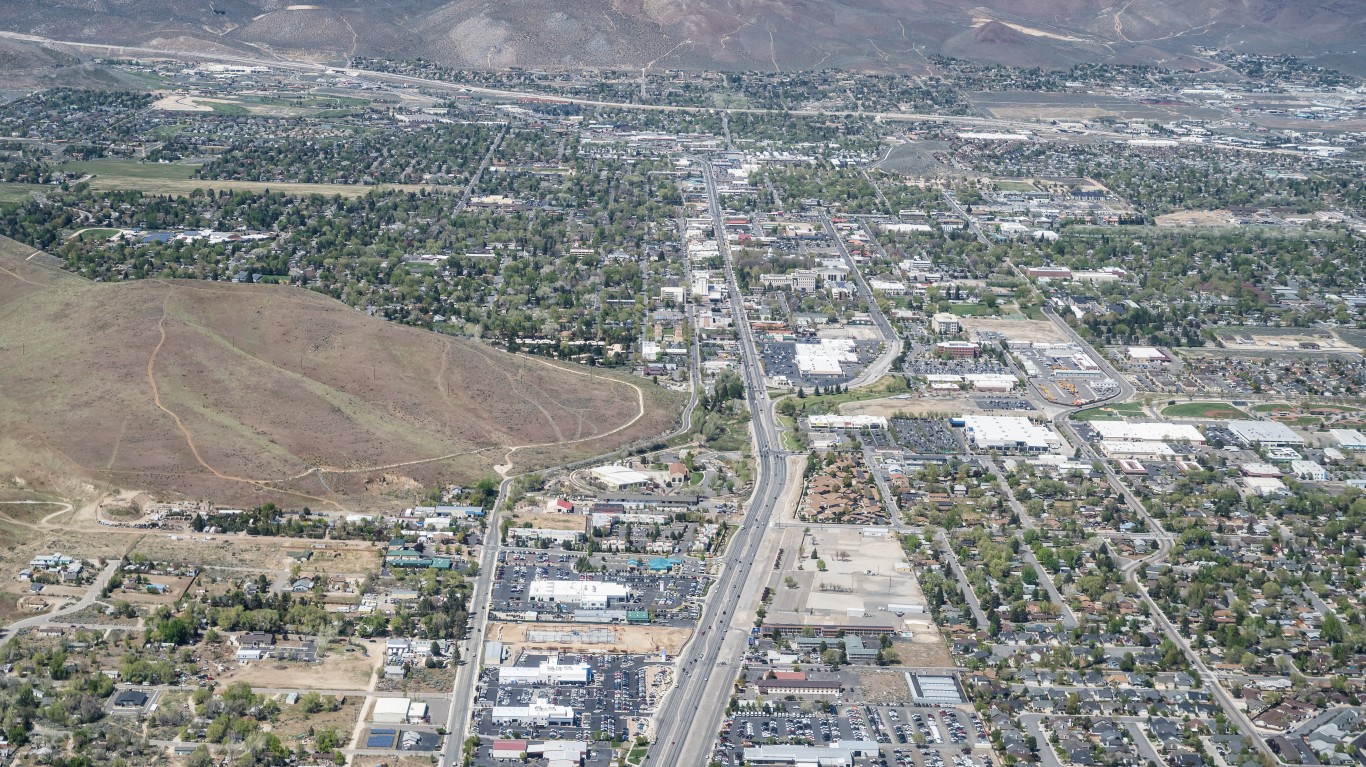
43. Carson City, NV
> Two-decade housing value chg.: 241%
> Housing values 2000, 2022: $145,493, $496,270
> Personal income per capita 2000, 2021: $33,282, $60,445 – 82% (#495 highest increase)
> Housing value-to-income ratio: 2000: 4.4, 2022: 8.2
> Population, 2021: 58,993

42. Gardnerville Ranchos, NV
> Two-decade housing value chg.: 243%
> Housing values 2000, 2022: $210,130, $720,988
> Personal income per capita 2000, 2021: $41,794, $87,214 – 109% (#239 highest increase)
> Housing value-to-income ratio: 2000: 5.0, 2022: 8.3
> Population, 2021: 49,870
[in-text-ad-2]
41. Oneonta, NY
> Two-decade housing value chg.: 246%
> Housing values 2000, 2022: $57,256, $197,875
> Personal income per capita 2000, 2021: $22,575, $53,431 – 137% (#40 highest increase)
> Housing value-to-income ratio: 2000: 2.5, 2022: 3.7
> Population, 2021: 58,123
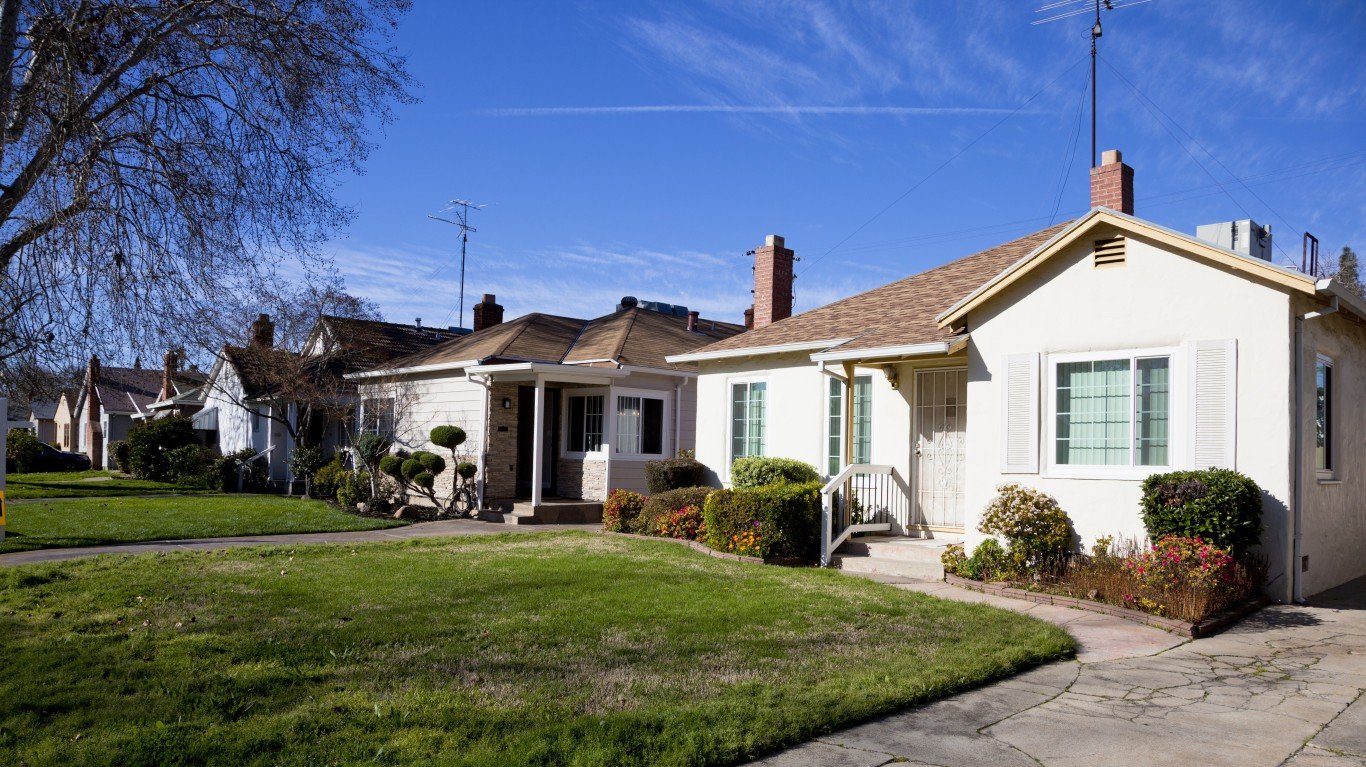
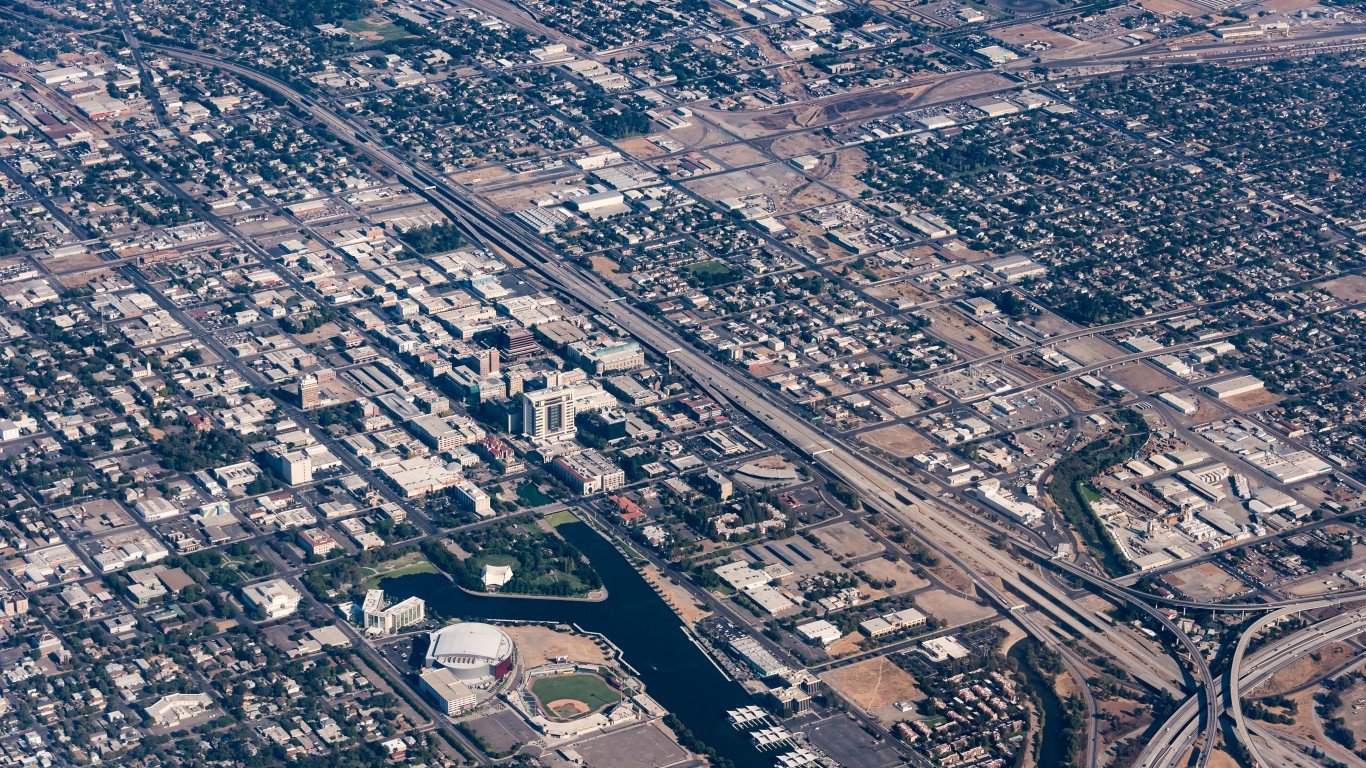
40. Sacramento, CA
> Two-decade housing value chg.: 248%
> Housing values 2000, 2022: $176,768, $614,307
> Personal income per capita 2000, 2021: $31,521, $65,972 – 109% (#232 highest increase)
> Housing value-to-income ratio: 2000: 5.6, 2022: 9.3
> Population, 2021: 2,411,428
[in-text-ad]
39. Prescott Valley, AZ
> Two-decade housing value chg.: 248%
> Housing values 2000, 2022: $146,354, $508,622
> Personal income per capita 2000, 2021: $21,867, $49,060 – 124% (#86 highest increase)
> Housing value-to-income ratio: 2000: 6.7, 2022: 10.4
> Population, 2021: 242,253
[recirclink id=1180521]
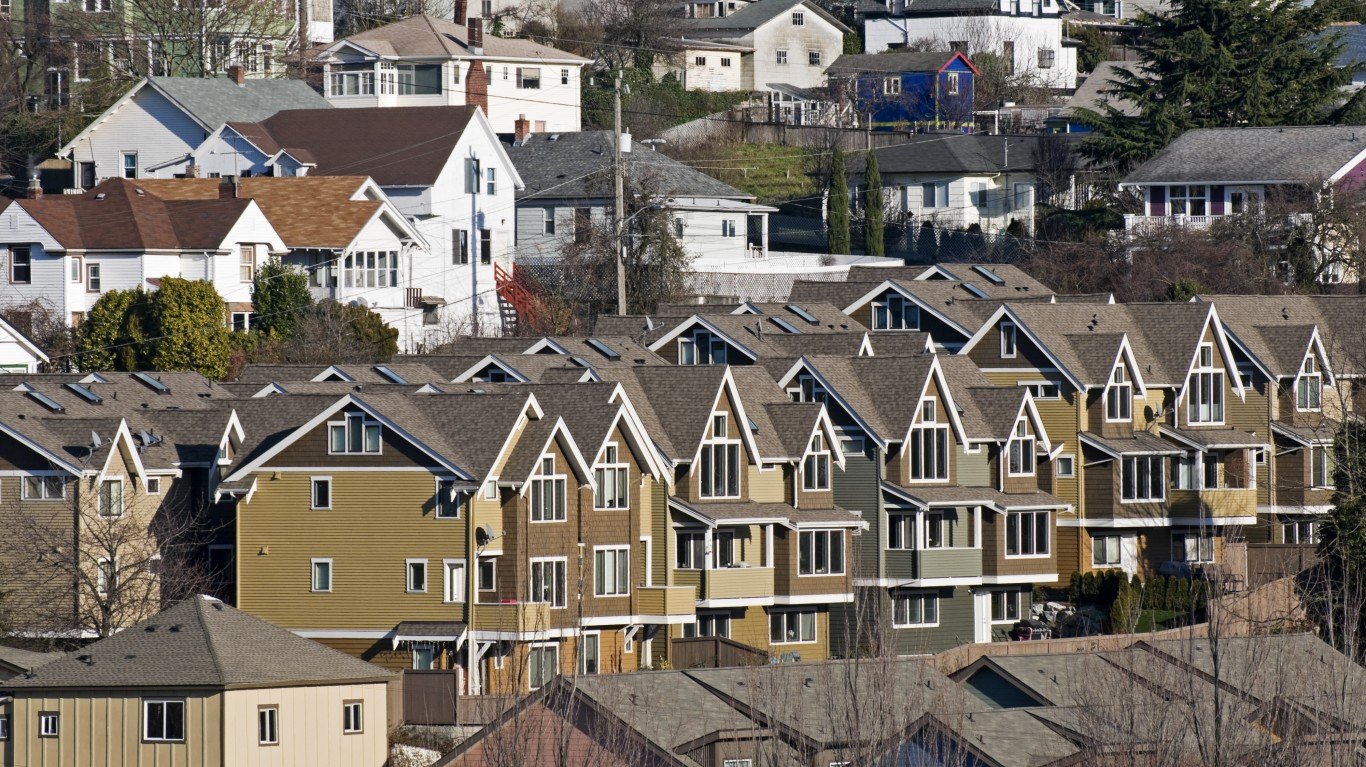
38. Seattle, WA
> Two-decade housing value chg.: 251%
> Housing values 2000, 2022: $222,342, $779,634
> Personal income per capita 2000, 2021: $38,917, $89,274 – 129% (#54 highest increase)
> Housing value-to-income ratio: 2000: 5.7, 2022: 8.7
> Population, 2021: 4,011,553

37. Spokane, WA
> Two-decade housing value chg.: 251%
> Housing values 2000, 2022: $127,408, $447,082
> Personal income per capita 2000, 2021: $26,061, $53,278 – 104% (#282 highest increase)
> Housing value-to-income ratio: 2000: 4.9, 2022: 8.4
> Population, 2021: 593,466
[in-text-ad-2]
36. Naples, FL
> Two-decade housing value chg.: 252%
> Housing values 2000, 2022: $179,435, $631,287
> Personal income per capita 2000, 2021: $42,953, $117,984 – 175% (#6 highest increase)
> Housing value-to-income ratio: 2000: 4.2, 2022: 5.4
> Population, 2021: 385,980
35. Mount Vernon, WA
> Two-decade housing value chg.: 252%
> Housing values 2000, 2022: $166,576, $586,553
> Personal income per capita 2000, 2021: $28,095, $64,093 – 128% (#60 highest increase)
> Housing value-to-income ratio: 2000: 5.9, 2022: 9.2
> Population, 2021: 130,696
[in-text-ad]

34. Lake Havasu City, AZ
> Two-decade housing value chg.: 253%
> Housing values 2000, 2022: $106,898, $377,280
> Personal income per capita 2000, 2021: $19,042, $41,331 – 117% (#153 highest increase)
> Housing value-to-income ratio: 2000: 5.6, 2022: 9.1
> Population, 2021: 217,692
[recirclink id=1081420]
33. Santa Cruz, CA
> Two-decade housing value chg.: 253%
> Housing values 2000, 2022: $367,156, $1,296,093
> Personal income per capita 2000, 2021: $39,966, $85,554 – 114% (#184 highest increase)
> Housing value-to-income ratio: 2000: 9.2, 2022: 15.1
> Population, 2021: 267,792

32. Napa, CA
> Two-decade housing value chg.: 254%
> Housing values 2000, 2022: $264,344, $934,527
> Personal income per capita 2000, 2021: $38,503, $90,608 – 135% (#44 highest increase)
> Housing value-to-income ratio: 2000: 6.9, 2022: 10.3
> Population, 2021: 136,207
[in-text-ad-2]
31. Lake City, FL
> Two-decade housing value chg.: 254%
> Housing values 2000, 2022: $64,523, $228,236
> Personal income per capita 2000, 2021: $19,327, $43,184 – 123% (#90 highest increase)
> Housing value-to-income ratio: 2000: 3.3, 2022: 5.3
> Population, 2021: 70,385

30. Walla Walla, WA
> Two-decade housing value chg.: 254%
> Housing values 2000, 2022: $115,445, $408,474
> Personal income per capita 2000, 2021: $24,006, $53,845 – 124% (#87 highest increase)
> Housing value-to-income ratio: 2000: 4.8, 2022: 7.6
> Population, 2021: 62,682
[in-text-ad]
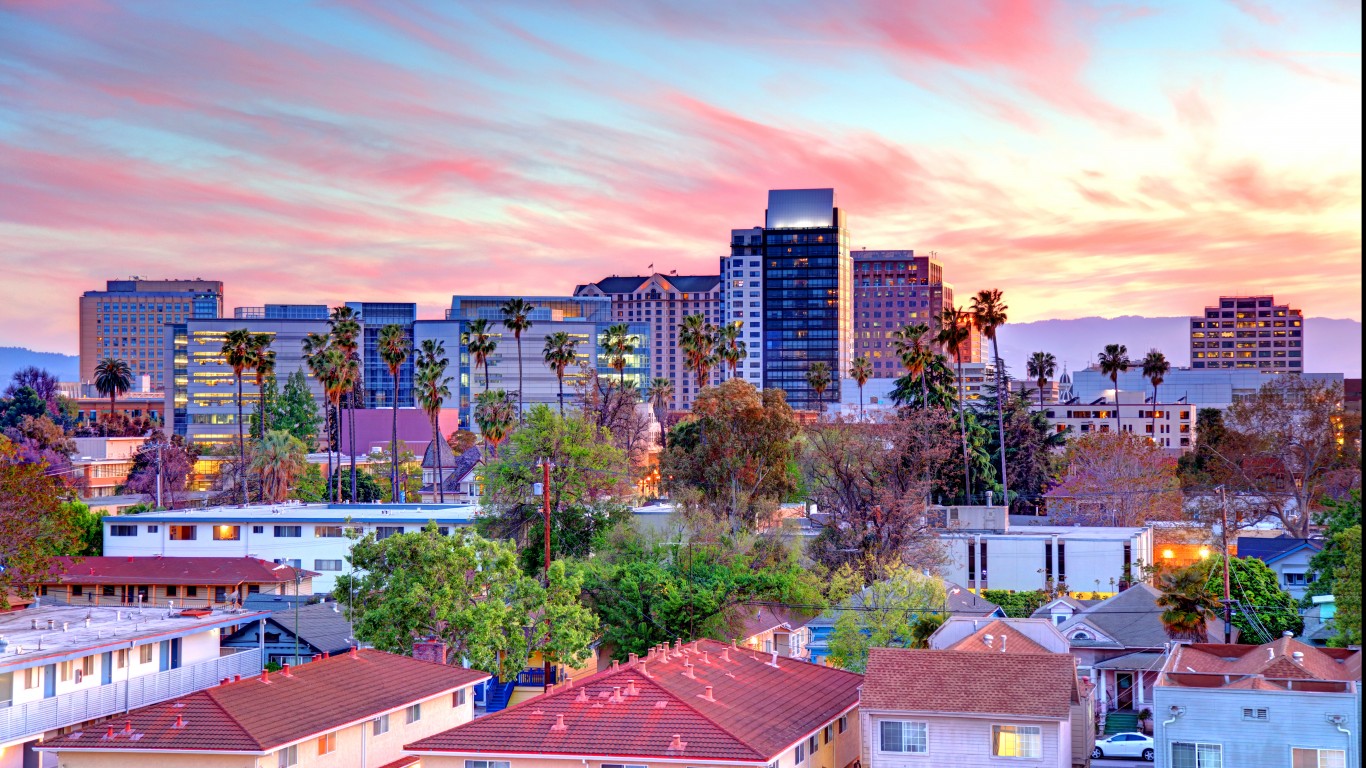
29. San Jose, CA
> Two-decade housing value chg.: 255%
> Housing values 2000, 2022: $459,303, $1,628,712
> Personal income per capita 2000, 2021: $53,949, $136,338 – 153% (#11 highest increase)
> Housing value-to-income ratio: 2000: 8.5, 2022: 11.9
> Population, 2021: 1,952,185
[recirclink id=1165876]
28. Miami, FL
> Two-decade housing value chg.: 255%
> Housing values 2000, 2022: $127,013, $450,452
> Personal income per capita 2000, 2021: $32,476, $73,522 – 126% (#70 highest increase)
> Housing value-to-income ratio: 2000: 3.9, 2022: 6.1
> Population, 2021: 6,091,747
27. San Luis Obispo, CA
> Two-decade housing value chg.: 256%
> Housing values 2000, 2022: $245,719, $873,898
> Personal income per capita 2000, 2021: $28,290, $66,617 – 135% (#43 highest increase)
> Housing value-to-income ratio: 2000: 8.9, 2022: 13.1
> Population, 2021: 283,159
[in-text-ad-2]
26. Tampa, FL
> Two-decade housing value chg.: 260%
> Housing values 2000, 2022: $106,390, $382,486
> Personal income per capita 2000, 2021: $29,233, $58,315 – 99% (#348 highest increase)
> Housing value-to-income ratio: 2000: 3.6, 2022: 6.6
> Population, 2021: 3,219,514
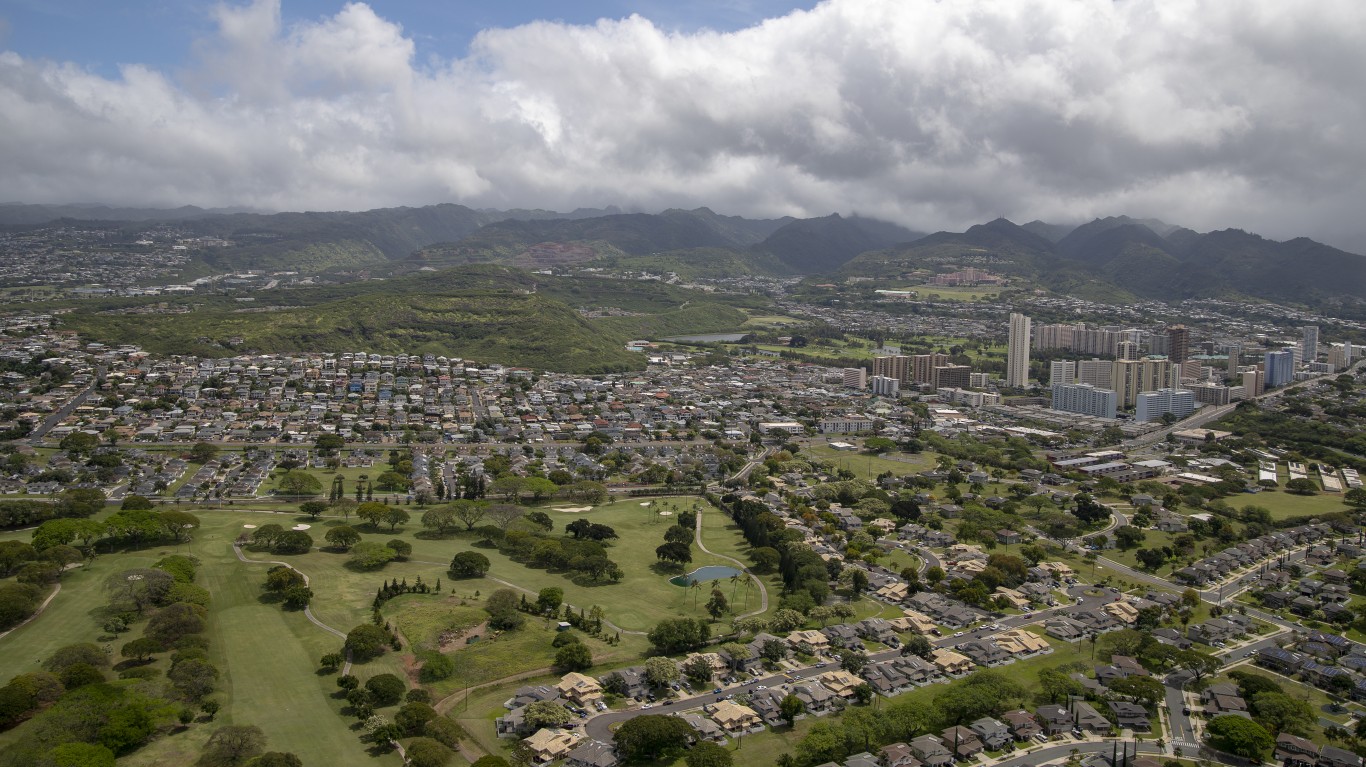
25. Urban Honolulu, HI
> Two-decade housing value chg.: 263%
> Housing values 2000, 2022: $255,125, $926,389
> Personal income per capita 2000, 2021: $31,388, $63,912 – 104% (#293 highest increase)
> Housing value-to-income ratio: 2000: 8.1, 2022: 14.5
> Population, 2021: 1,000,890
[in-text-ad]
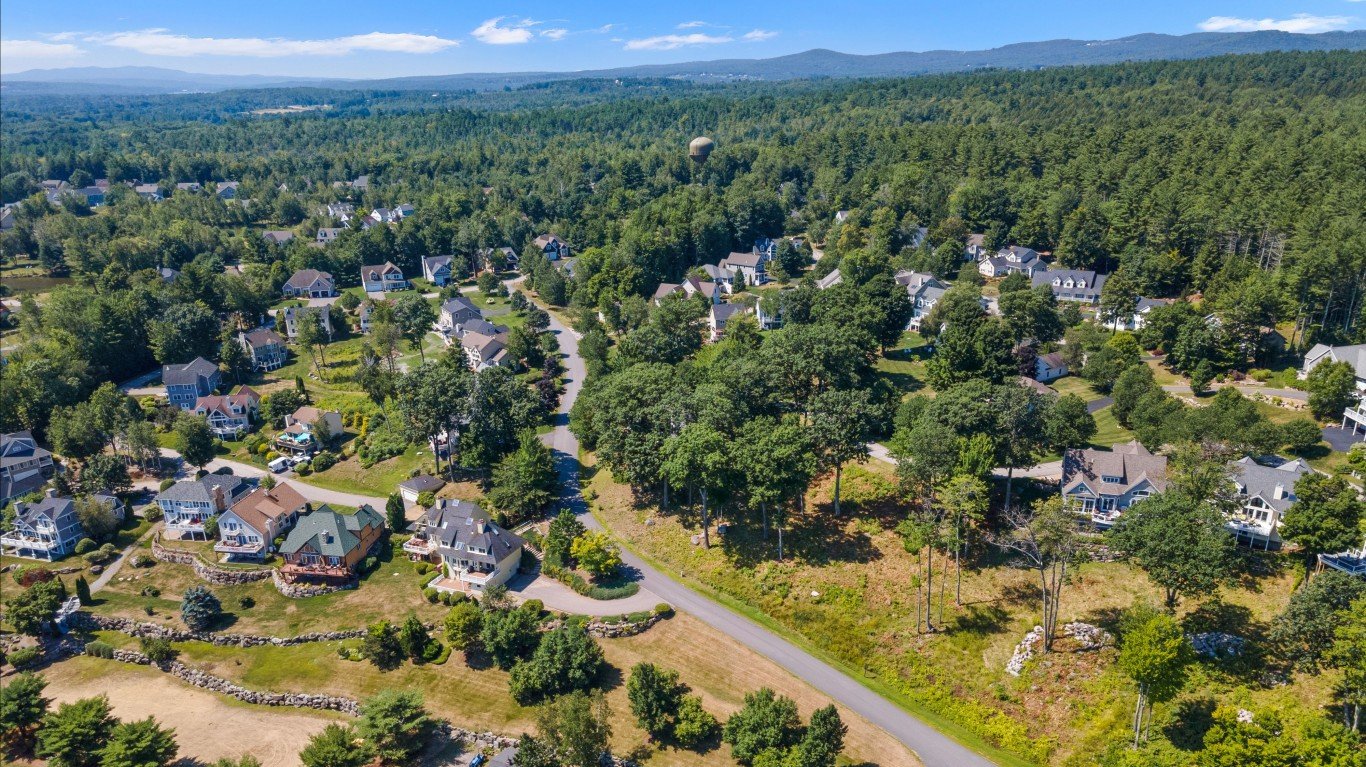
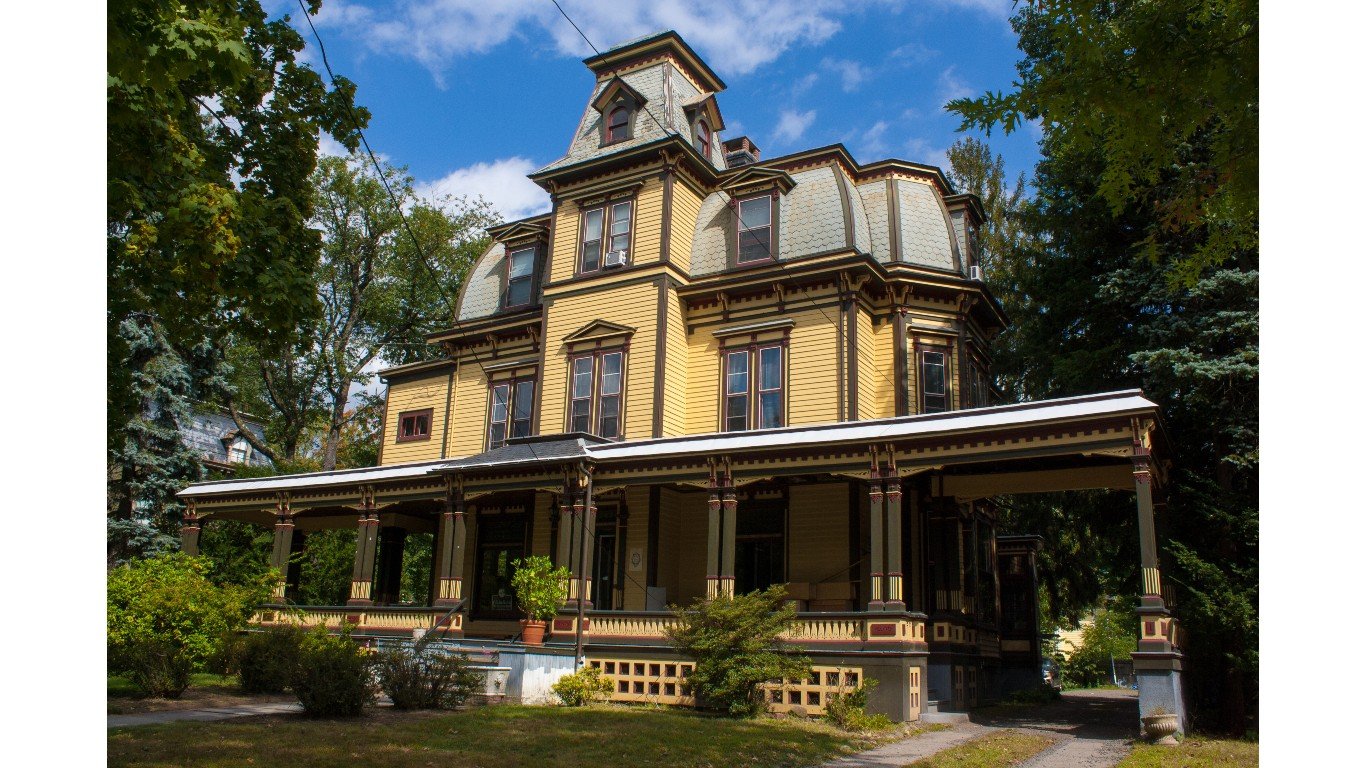
24. Laconia, NH
> Two-decade housing value chg.: 263%
> Housing values 2000, 2022: $119,373, $433,506
> Personal income per capita 2000, 2021: $31,604, $71,958 – 128% (#65 highest increase)
> Housing value-to-income ratio: 2000: 3.8, 2022: 6.0
> Population, 2021: 64,460
[recirclink id=1188754]
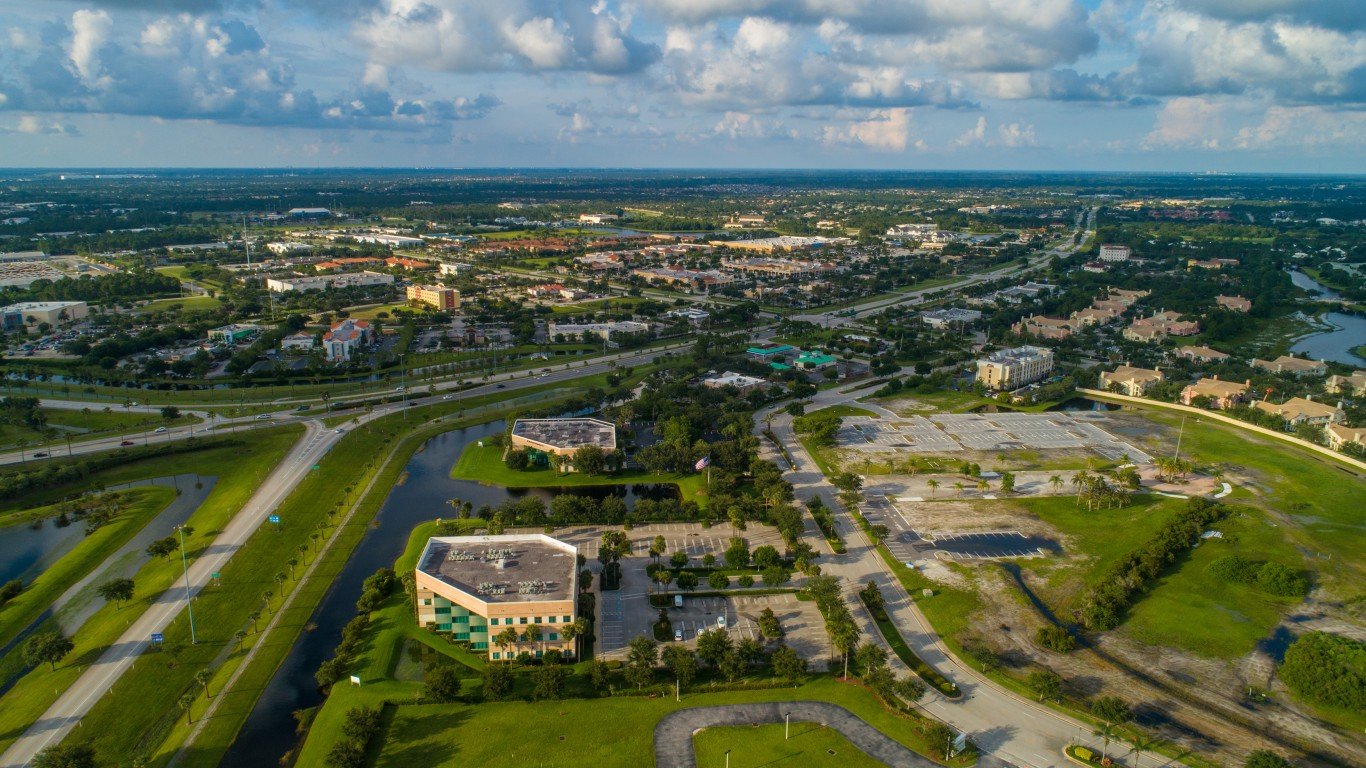
23. Port St. Lucie, FL
> Two-decade housing value chg.: 264%
> Housing values 2000, 2022: $110,579, $403,009
> Personal income per capita 2000, 2021: $31,017, $66,630 – 115% (#172 highest increase)
> Housing value-to-income ratio: 2000: 3.6, 2022: 6.0
> Population, 2021: 503,521
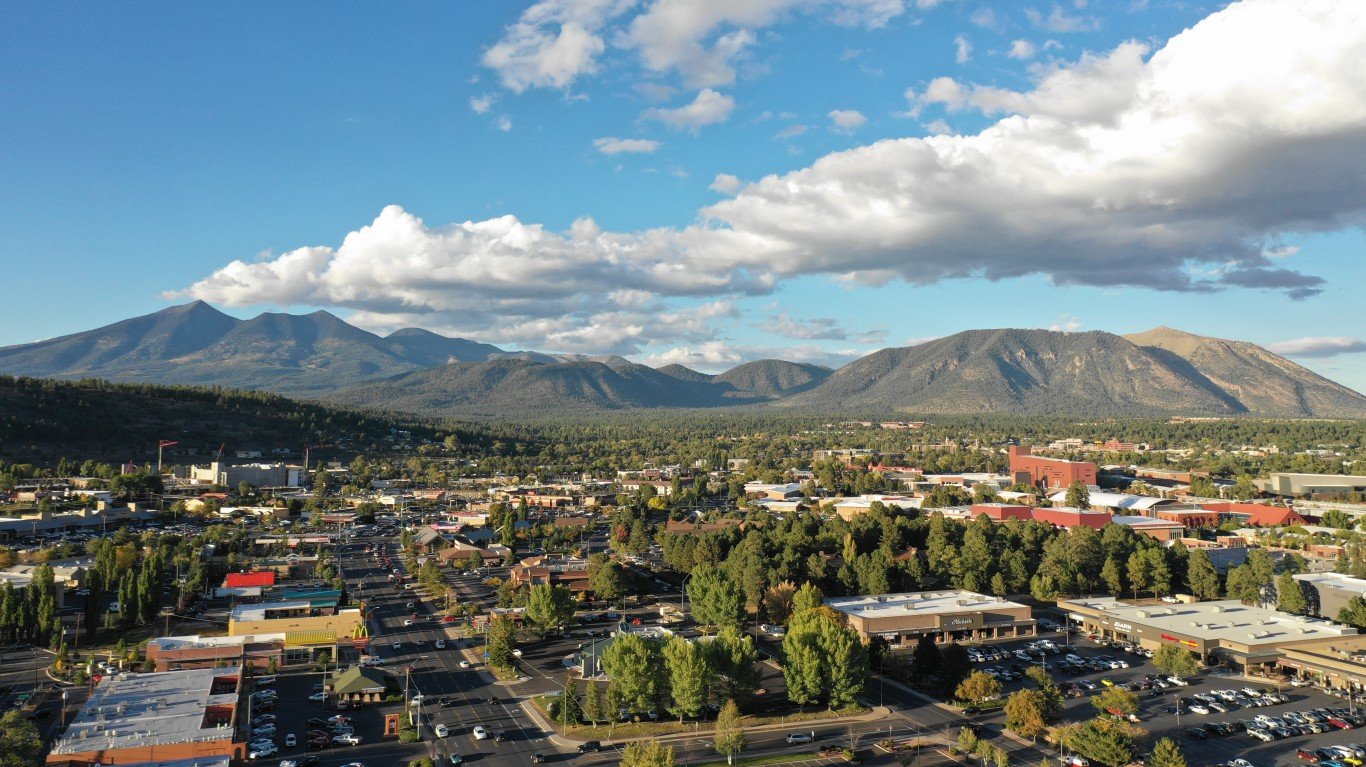
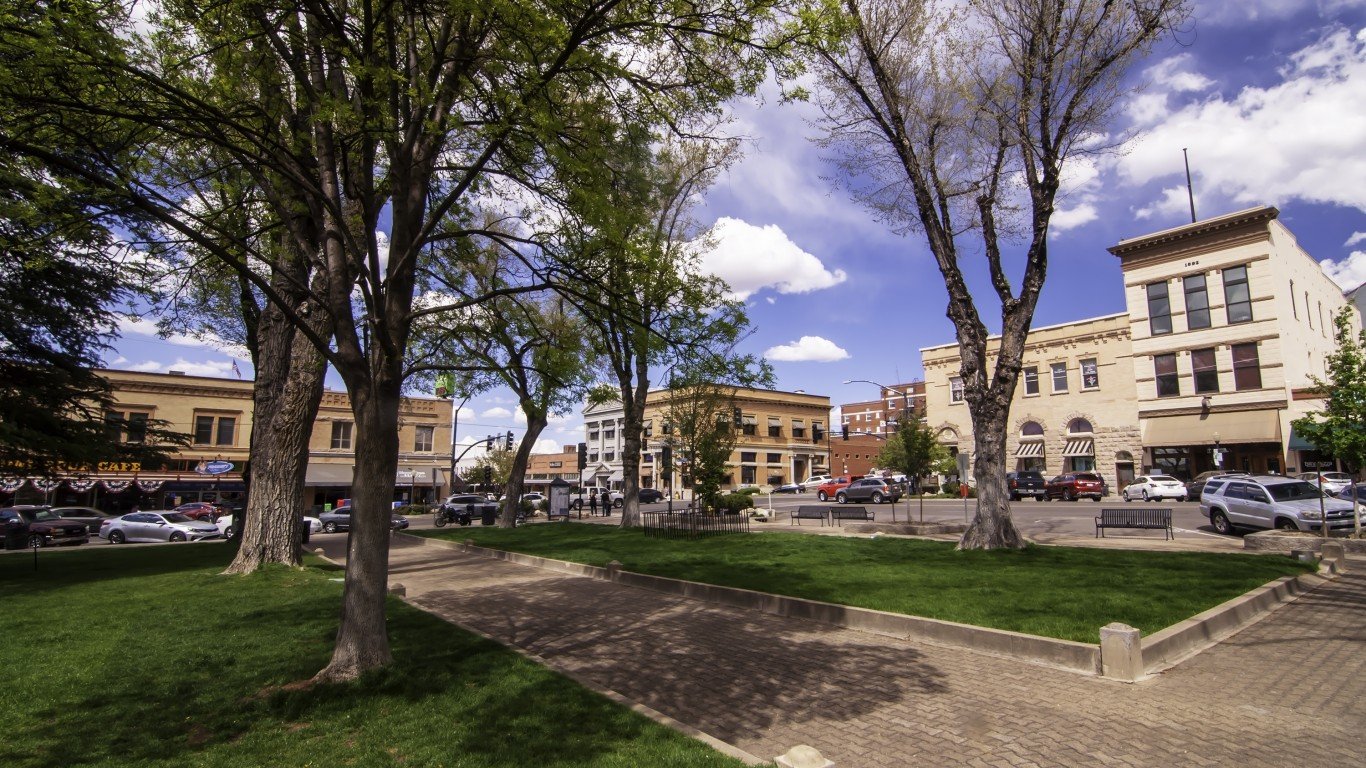
22. Flagstaff, AZ
> Two-decade housing value chg.: 265%
> Housing values 2000, 2022: $172,600, $629,288
> Personal income per capita 2000, 2021: $23,821, $56,914 – 139% (#33 highest increase)
> Housing value-to-income ratio: 2000: 7.2, 2022: 11.1
> Population, 2021: 145,052
[in-text-ad-2]

21. Hood River, OR
> Two-decade housing value chg.: 266%
> Housing values 2000, 2022: $178,692, $653,466
> Personal income per capita 2000, 2021: $22,895, $65,127 – 184% (#4 highest increase)
> Housing value-to-income ratio: 2000: 7.8, 2022: 10.0
> Population, 2021: 24,057
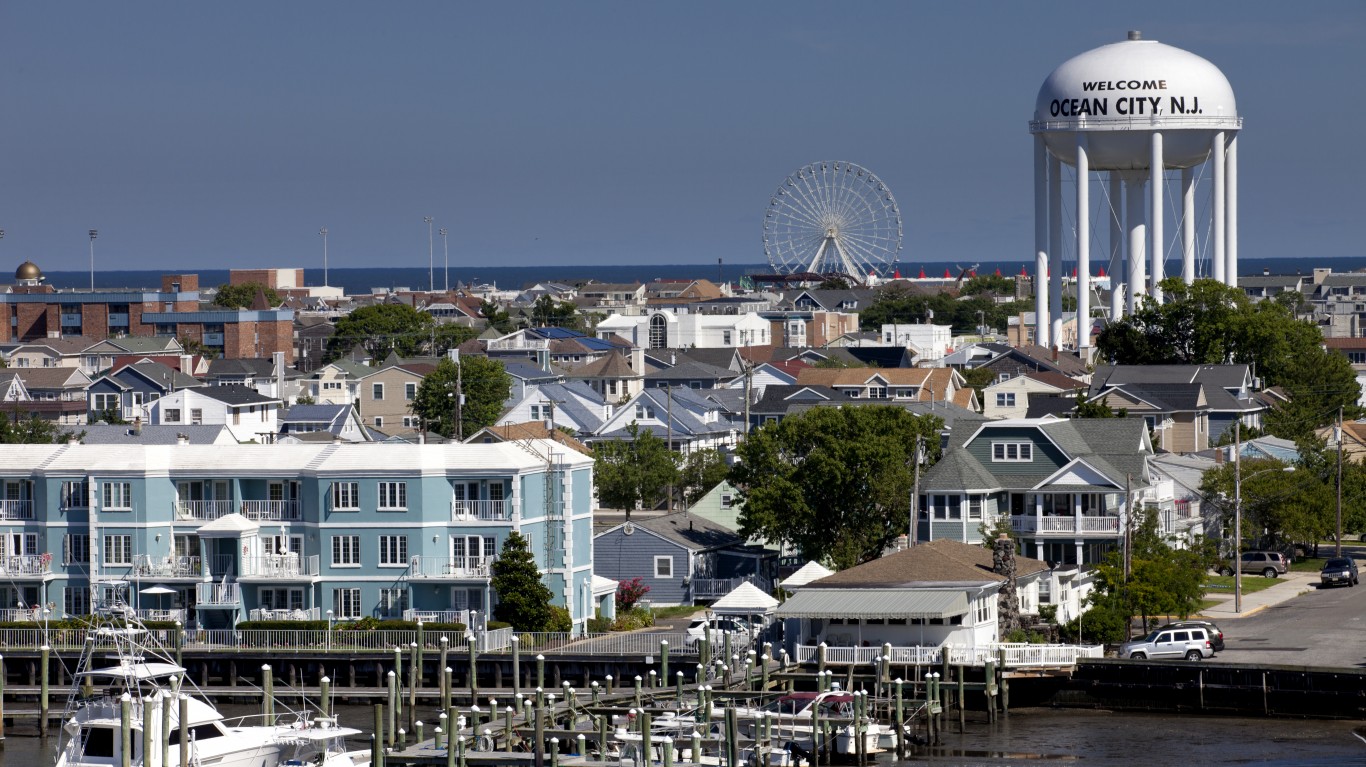
20. Ocean City, NJ
> Two-decade housing value chg.: 266%
> Housing values 2000, 2022: $171,502, $627,658
> Personal income per capita 2000, 2021: $32,929, $72,010 – 119% (#135 highest increase)
> Housing value-to-income ratio: 2000: 5.2, 2022: 8.7
> Population, 2021: 95,661
[in-text-ad]
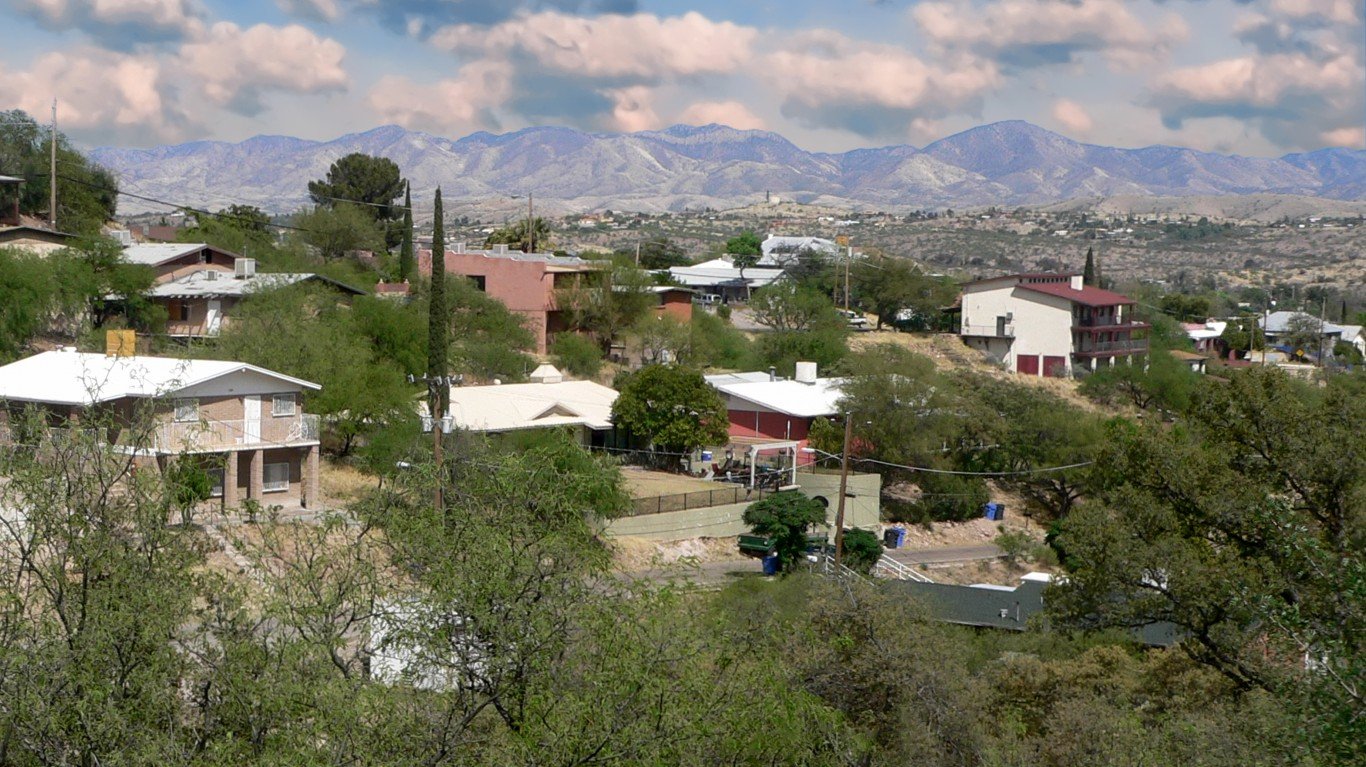
19. Nogales, AZ
> Two-decade housing value chg.: 269%
> Housing values 2000, 2022: $71,448, $263,660
> Personal income per capita 2000, 2021: $17,234, $46,828 – 172% (#7 highest increase)
> Housing value-to-income ratio: 2000: 4.1, 2022: 5.6
> Population, 2021: 47,883
[recirclink id=1172977]
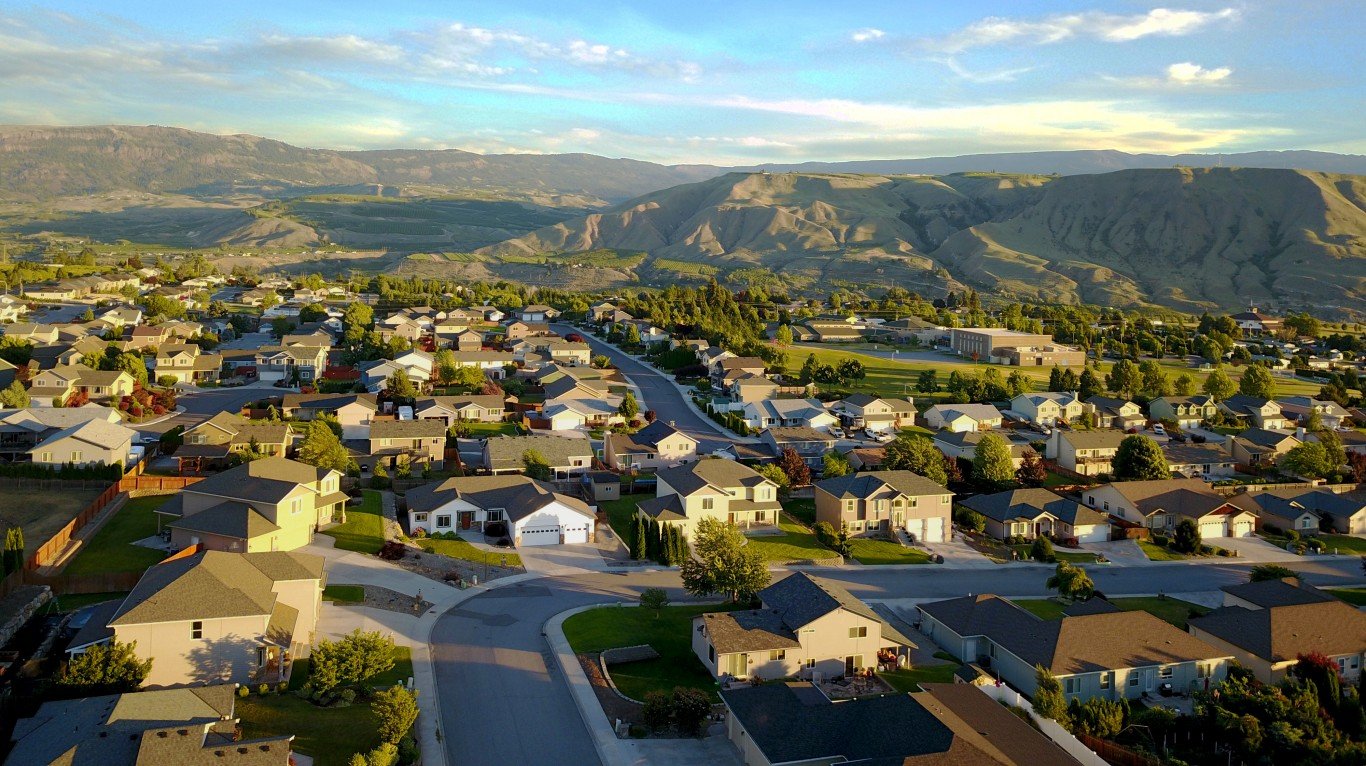
18. Wenatchee, WA
> Two-decade housing value chg.: 270%
> Housing values 2001, 2022: $, $544,726
> Personal income per capita 2000, 2021: $24,337, $58,009 – 138% (#34 highest increase)
> Housing value-to-income ratio: 2001: 6.1, 2022: 9.4
> Population, 2021: 123,342

17. Bremerton, WA
> Two-decade housing value chg.: 271%
> Housing values 2000, 2022: $157,481, $584,248
> Personal income per capita 2000, 2021: $30,338, $67,845 – 124% (#89 highest increase)
> Housing value-to-income ratio: 2000: 5.2, 2022: 8.6
> Population, 2021: 274,314
[in-text-ad-2]
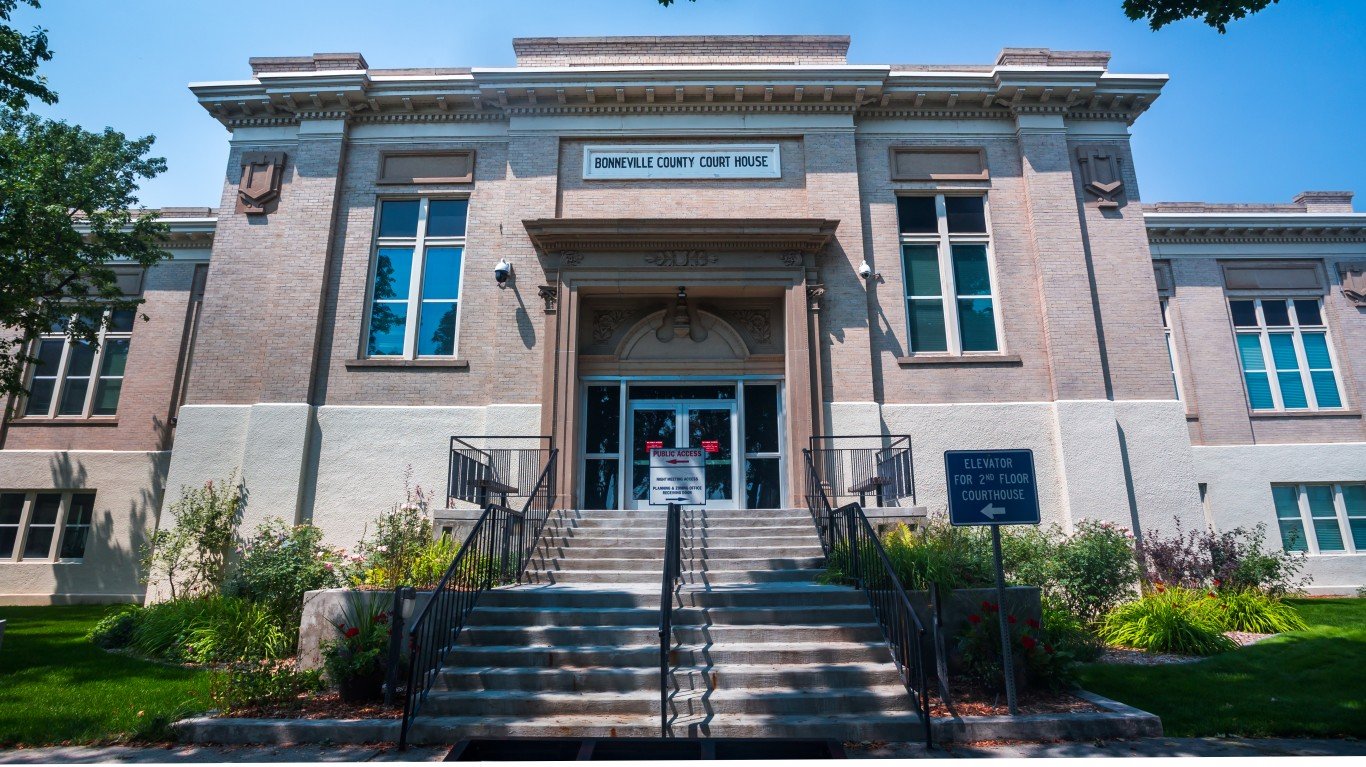
16. Idaho Falls, ID
> Two-decade housing value chg.: 278%
> Housing values 2000, 2022: $110,368, $417,129
> Personal income per capita 2000, 2021: $24,126, $55,084 – 128% (#58 highest increase)
> Housing value-to-income ratio: 2000: 4.6, 2022: 7.6
> Population, 2021: 162,786
15. Steamboat Springs, CO
> Two-decade housing value chg.: 282%
> Housing values 2000, 2022: $248,131, $947,489
> Personal income per capita 2000, 2021: $34,286, $98,371 – 187% (#3 highest increase)
> Housing value-to-income ratio: 2000: 7.2, 2022: 9.6
> Population, 2021: 25,091
[in-text-ad]
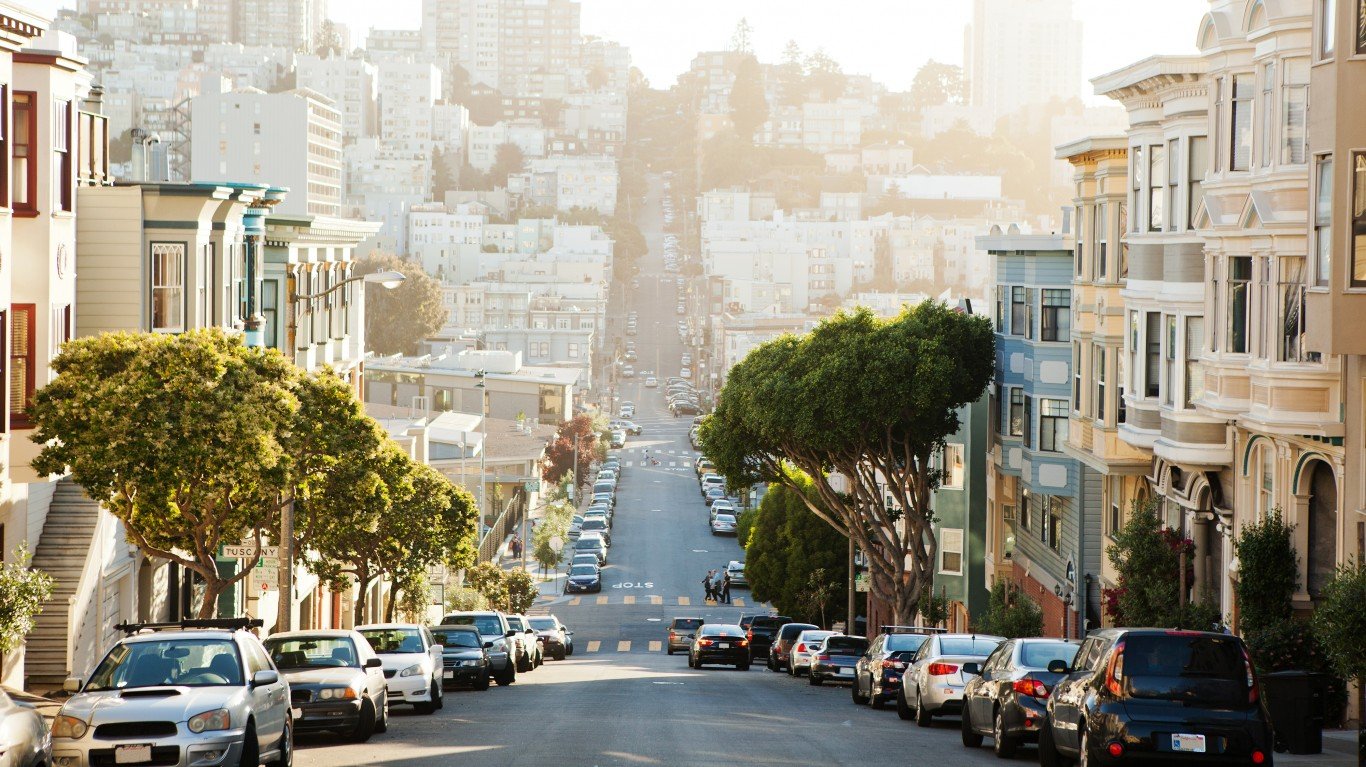
14. San Francisco, CA
> Two-decade housing value chg.: 283%
> Housing values 2000, 2022: $379,252, $1,452,619
> Personal income per capita 2000, 2021: $49,630, $123,711 – 149% (#17 highest increase)
> Housing value-to-income ratio: 2000: 7.6, 2022: 11.7
> Population, 2021: 4,623,264
[recirclink id=1180521]
13. San Diego, CA
> Two-decade housing value chg.: 287%
> Housing values 2000, 2022: $236,473, $916,285
> Personal income per capita 2000, 2021: $33,869, $72,637 – 114% (#177 highest increase)
> Housing value-to-income ratio: 2000: 7.0, 2022: 12.6
> Population, 2021: 3,286,069

12. Breckenridge, CO
> Two-decade housing value chg.: 291%
> Housing values 2003, 2022: $275,883, $1,078,850
> Personal income per capita 2000, 2021: $35,904, $86,390 – 141% (#29 highest increase)
> Housing value-to-income ratio: 2003: 7.7, 2022: 12.5
> Population, 2021: 30,941
[in-text-ad-2]
11. Los Angeles, CA
> Two-decade housing value chg.: 293%
> Housing values 2000, 2022: $238,967, $939,761
> Personal income per capita 2000, 2021: $31,952, $75,821 – 137% (#37 highest increase)
> Housing value-to-income ratio: 2000: 7.5, 2022: 12.4
> Population, 2021: 12,997,353
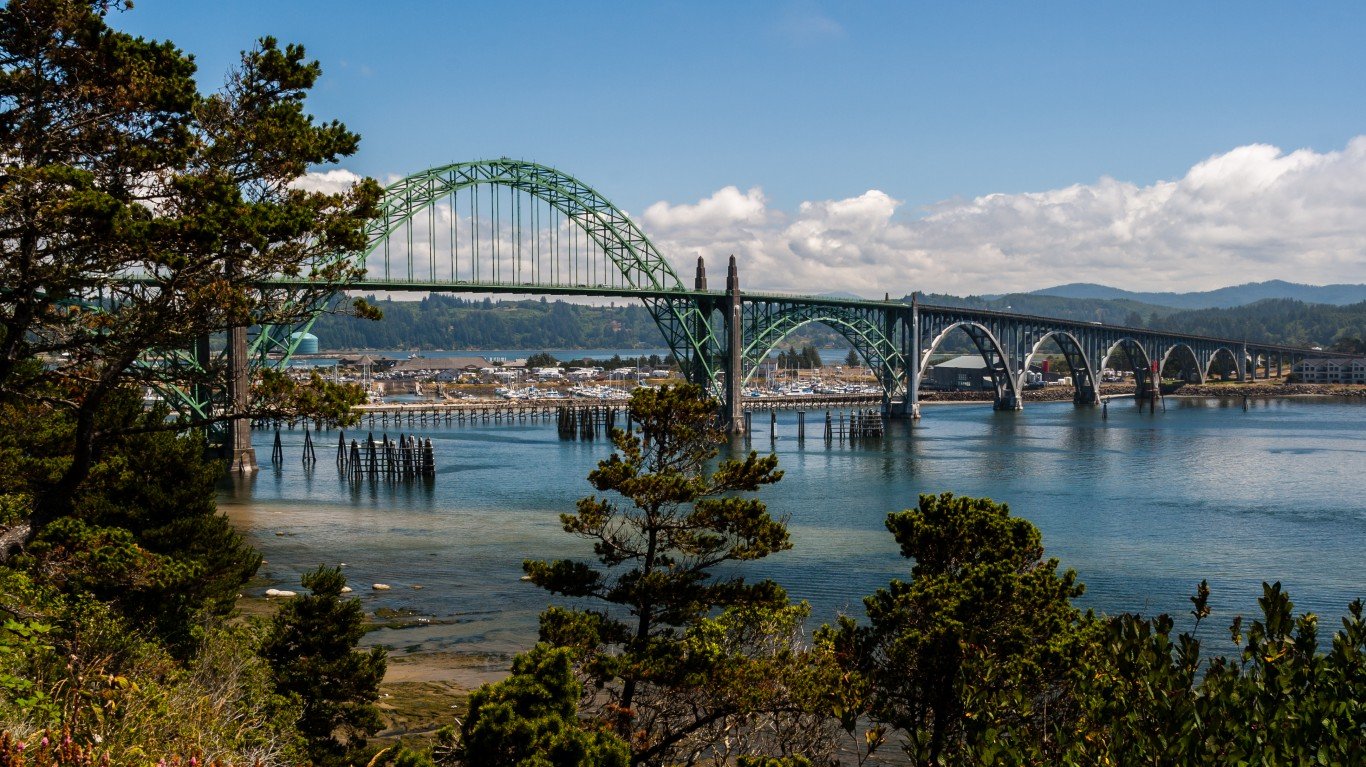
10. Newport, OR
> Two-decade housing value chg.: 295%
> Housing values 2000, 2022: $127,317, $503,526
> Personal income per capita 2000, 2021: $24,919, $52,482 – 111% (#221 highest increase)
> Housing value-to-income ratio: 2000: 5.1, 2022: 9.6
> Population, 2021: 50,862
[in-text-ad]
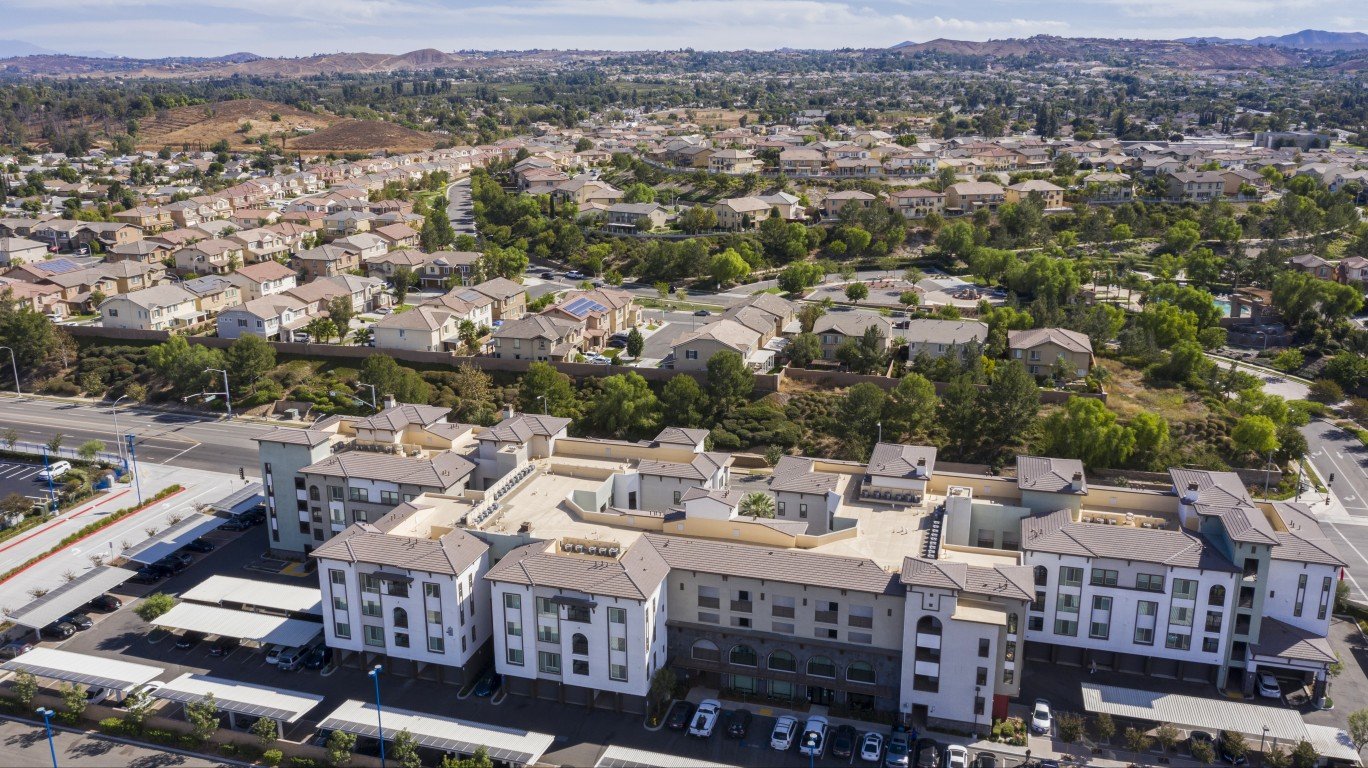
9. Riverside, CA
> Two-decade housing value chg.: 296%
> Housing values 2000, 2022: $146,911, $582,153
> Personal income per capita 2000, 2021: $23,534, $50,384 – 114% (#183 highest increase)
> Housing value-to-income ratio: 2000: 6.2, 2022: 11.6
> Population, 2021: 4,653,105
[recirclink id=1081420]
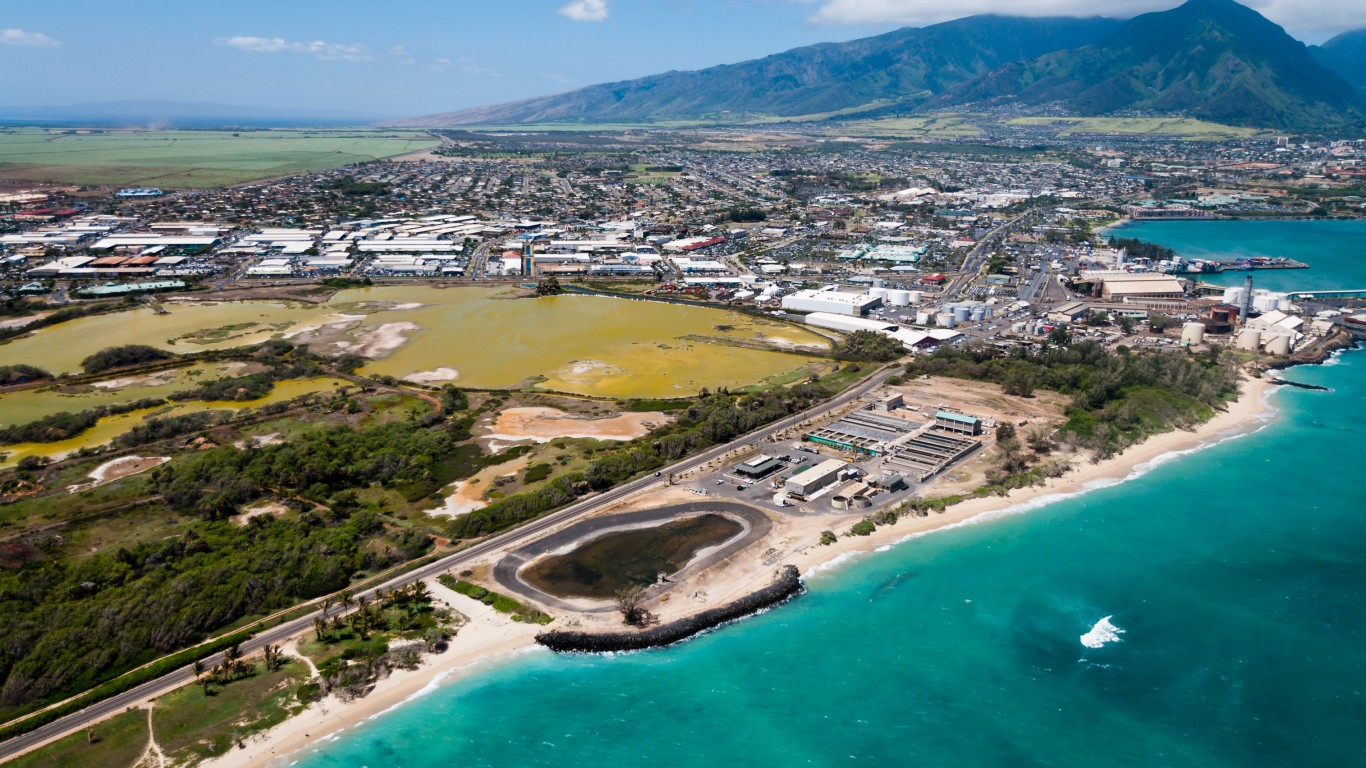
8. Kahului, HI
> Two-decade housing value chg.: 304%
> Housing values 2000, 2022: $259,219, $1,046,346
> Personal income per capita 2000, 2021: $25,552, $58,520 – 129% (#56 highest increase)
> Housing value-to-income ratio: 2000: 10.1, 2022: 17.9
> Population, 2021: 164,303
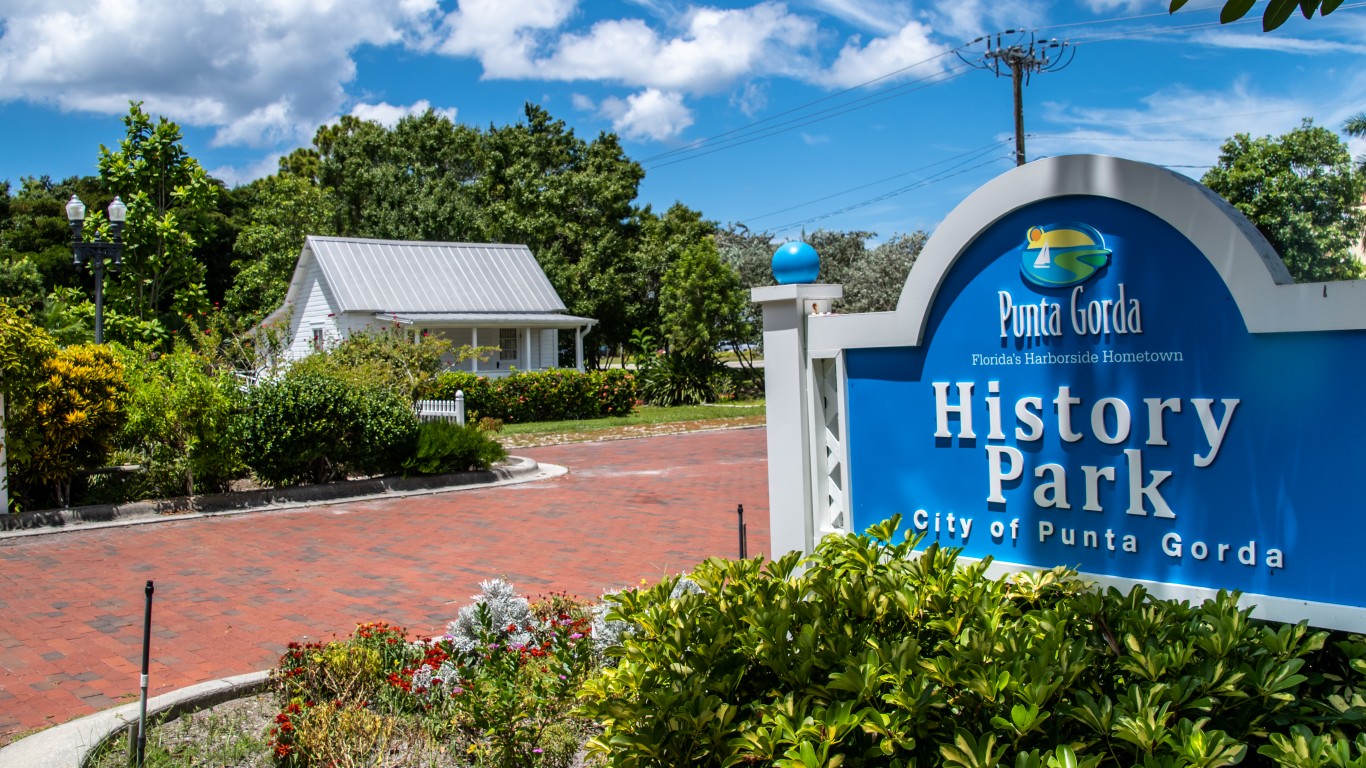
7. Punta Gorda, FL
> Two-decade housing value chg.: 307%
> Housing values 2000, 2022: $99,206, $404,262
> Personal income per capita 2000, 2021: $26,311, $51,677 – 96% (#385 highest increase)
> Housing value-to-income ratio: 2000: 3.8, 2022: 7.8
> Population, 2021: 194,843
[in-text-ad-2]
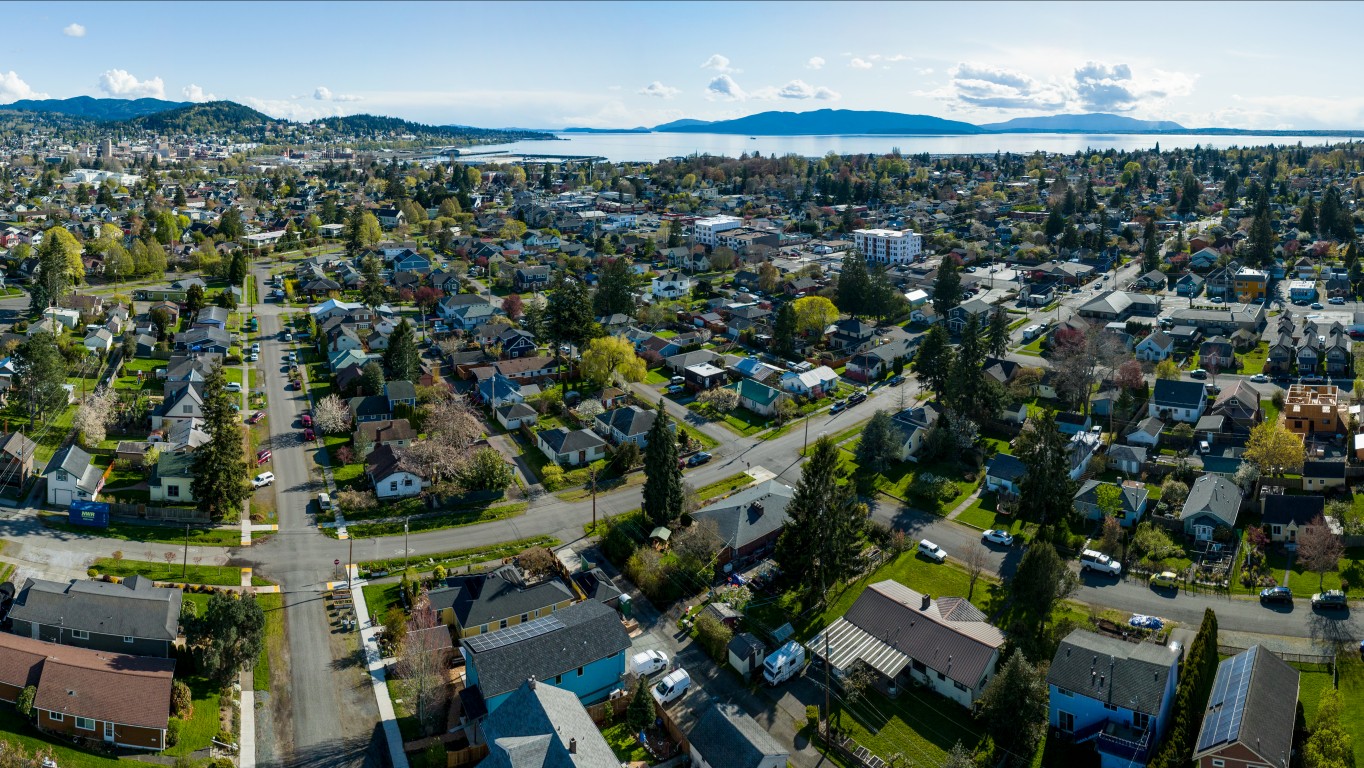
6. Bellingham, WA
> Two-decade housing value chg.: 311%
> Housing values 2001, 2022: $155,254, $638,475
> Personal income per capita 2000, 2021: $24,748, $58,137 – 135% (#47 highest increase)
> Housing value-to-income ratio: 2001: 6.3, 2022: 11.0
> Population, 2021: 228,831
5. Show Low, AZ
> Two-decade housing value chg.: 315%
> Housing values 2000, 2022: $92,435, $383,489
> Personal income per capita 2000, 2021: $15,043, $41,680 – 177% (#5 highest increase)
> Housing value-to-income ratio: 2000: 6.1, 2022: 9.2
> Population, 2021: 108,147
[in-text-ad]
4. Bend, OR
> Two-decade housing value chg.: 339%
> Housing values 2000, 2022: $159,441, $700,017
> Personal income per capita 2000, 2021: $27,645, $67,743 – 145% (#22 highest increase)
> Housing value-to-income ratio: 2000: 5.8, 2022: 10.3
> Population, 2021: 204,801
[recirclink id=1165876]

3. Kapaa, HI
> Two-decade housing value chg.: 378%
> Housing values 2000, 2022: $189,868, $906,955
> Personal income per capita 2000, 2021: $24,951, $56,103 – 125% (#79 highest increase)
> Housing value-to-income ratio: 2000: 7.6, 2022: 16.2
> Population, 2021: 73,454

2. Redding, CA
> Two-decade housing value chg.: 383%
> Housing values 2000, 2022: $79,489, $383,588
> Personal income per capita 2000, 2021: $25,580, $54,972 – 115% (#170 highest increase)
> Housing value-to-income ratio: 2000: 3.1, 2022: 7.0
> Population, 2021: 182,139
[in-text-ad-2]

1. Payson, AZ
> Two-decade housing value chg.: 400%
> Housing values 2000, 2022: $80,129, $400,933
> Personal income per capita 2000, 2021: $19,607, $48,752 – 149% (#19 highest increase)
> Housing value-to-income ratio: 2000: 4.1, 2022: 8.2
> Population, 2021: 53,589