U.S. home sales skyrocketed during the COVID-19 pandemic – hitting a 15-year high of 6.1 million in 2021. The spike in demand, coupled with declining inventory, have put upward pressure on housing prices. Renters have not been spared, as housing has become one of the key drivers of surging U.S. inflation.
According to the Economic Policy Institute, a nonprofit think tank, a single adult can expect to pay an estimated $11,026 on housing in 2022. This amount varies across the country, however, and in many major metropolitan areas, housing costs are well below the national average.
Using data from the EPI’s Family Budget Calculator, 24/7 Wall St. identified the 50 metro areas with the lowest housing costs. Metro areas are ranked on 2022 estimates of housing and utility costs for a modest studio apartment.
Among the metro areas on this list, housing costs for a single adult range from about $5,400 to $6,600. The largest share of metro areas on this list are in the Midwest, including six in Ohio alone. Lower housing costs in these places are often a reflection of what residents can afford. Nearly every metro area on this list has a lower median household income than the national median of $64,994. Here is a look at the income needed to be middle class in each state.
Home values also tend to be lower in areas with low housing costs, making homeownership more affordable for larger shares of the population. This may help explain why homeownership rates are higher than the 64.4% national rate in the majority of the metro areas on this list. Here is a look at the mortgage rate in America every year since 1972.
Click here to see the metro areas with the lowest housing costs
Click here to read our detailed methodology

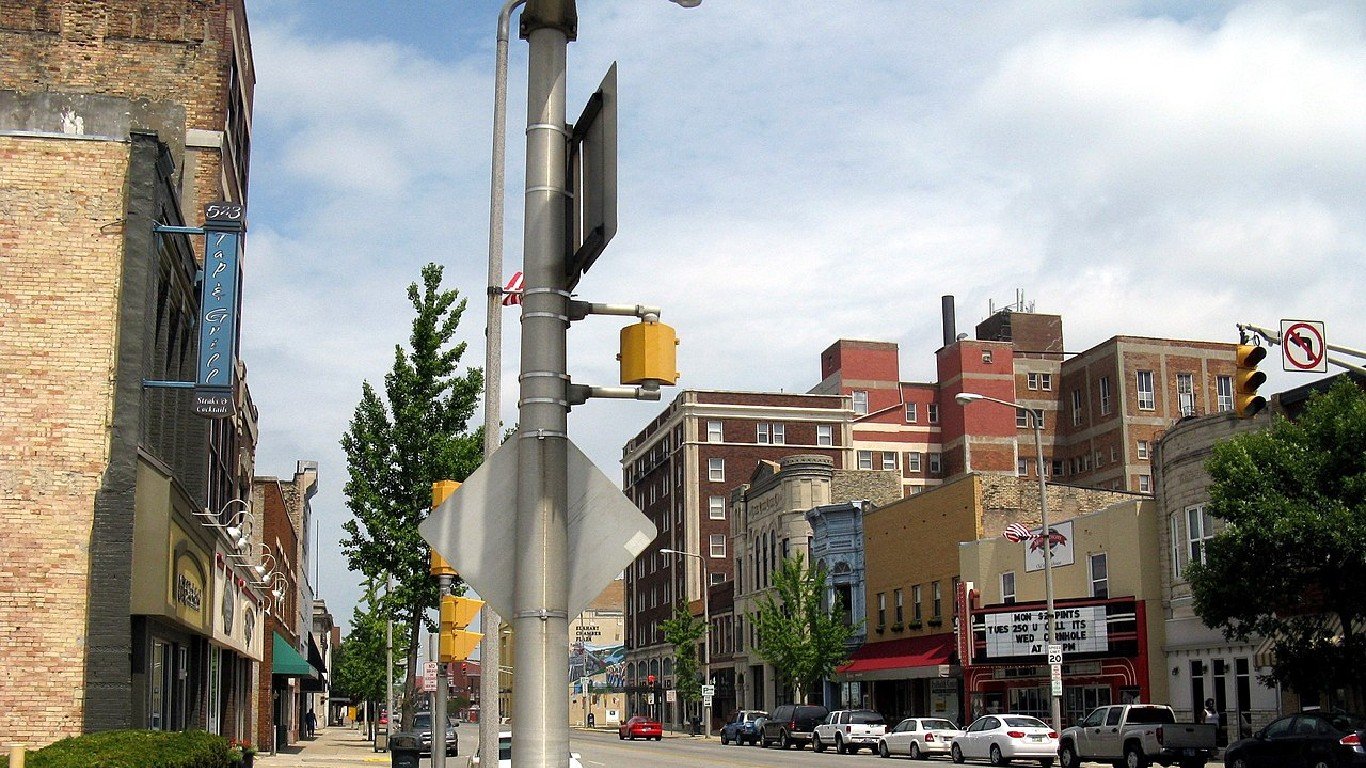
50. Battle Creek, MI
> Est. annual housing costs: $6,624
> Median household income: $50,219 — 60th lowest of 376 metros
> Homeownership rate: 69.5% — 102nd highest of 376 metros
> Median home value: $115,500 — 21st lowest of 376 metros
[in-text-ad]

49. Fort Smith, AR-OK
> Est. annual housing costs: $6,612
> Median household income: $46,424 — 18th lowest of 376 metros
> Homeownership rate: 66.2% — 177th lowest of 376 metros
> Median home value: $119,500 — 24th lowest of 376 metros (tied)
[recirclink id=1052847]

48. Wheeling, WV-OH
> Est. annual housing costs: $6,600
> Median household income: $49,928 — 55th lowest of 376 metros
> Homeownership rate: 74.5% — 26th highest of 376 metros
> Median home value: $115,200 — 19th lowest of 376 metros

47. Sioux City, IA-NE-SD
> Est. annual housing costs: $6,588
> Median household income: $61,399 — 151st highest of 376 metros
> Homeownership rate: 67.7% — 157th highest of 376 metros
> Median home value: $137,300 — 60th lowest of 376 metros (tied)
[in-text-ad-2]
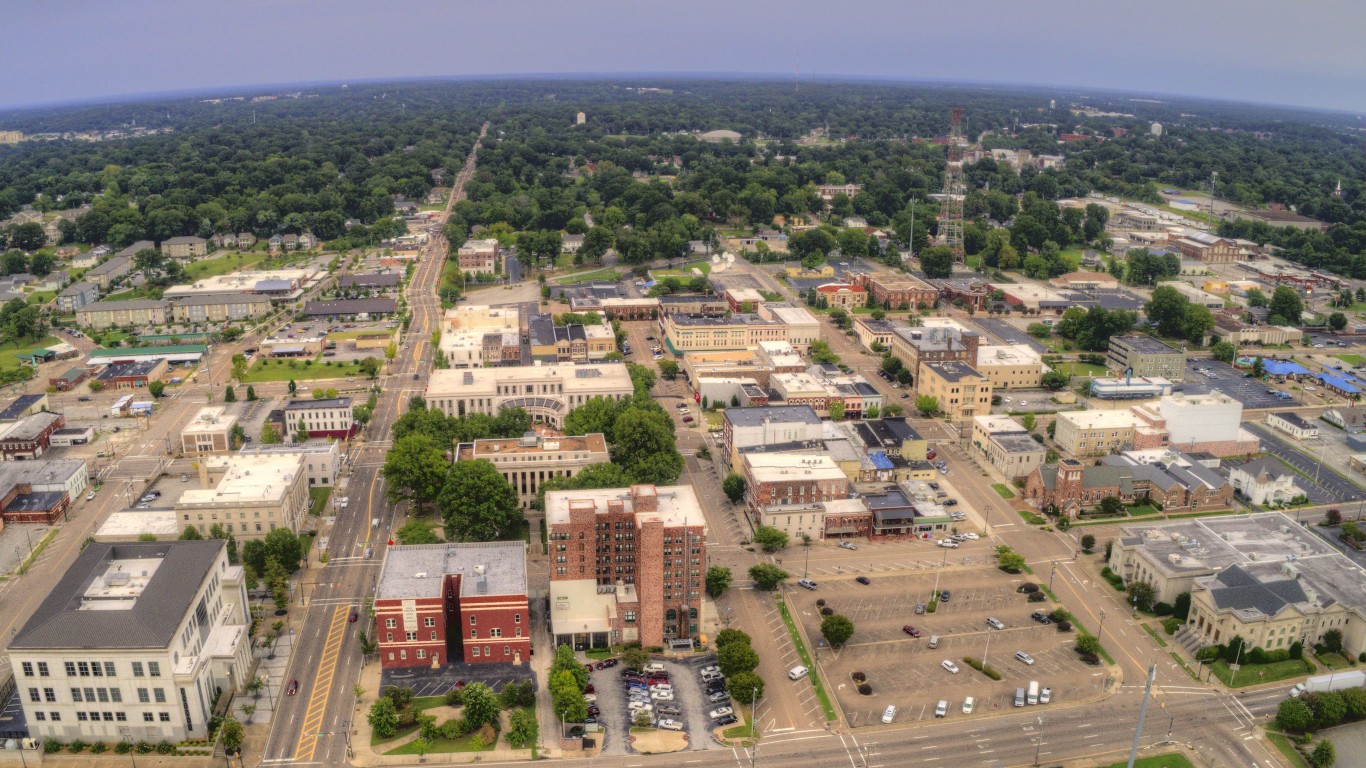
46. Jackson, TN
> Est. annual housing costs: $6,588
> Median household income: $48,146 — 36th lowest of 376 metros
> Homeownership rate: 65.1% — 144th lowest of 376 metros
> Median home value: $123,300 — 34th lowest of 376 metros

45. El Paso, TX
> Est. annual housing costs: $6,576
> Median household income: $48,193 — 38th lowest of 376 metros
> Homeownership rate: 62.3% — 84th lowest of 376 metros
> Median home value: $126,200 — 41st lowest of 376 metros (tied)
[in-text-ad]

44. Saginaw, MI
> Est. annual housing costs: $6,552
> Median household income: $49,565 — 53rd lowest of 376 metros
> Homeownership rate: 71.5% — 57th highest of 376 metros
> Median home value: $106,200 — 10th lowest of 376 metros
[recirclink id=1065785]

43. Terre Haute, IN
> Est. annual housing costs: $6,552
> Median household income: $50,418 — 65th lowest of 376 metros
> Homeownership rate: 69.2% — 115th highest of 376 metros
> Median home value: $99,700 — 8th lowest of 376 metros
42. Elkhart-Goshen, IN
> Est. annual housing costs: $6,540
> Median household income: $58,509 — 181st lowest of 376 metros
> Homeownership rate: 70.4% — 80th highest of 376 metros
> Median home value: $149,300 — 102nd lowest of 376 metros
[in-text-ad-2]

41. Midland, MI
> Est. annual housing costs: $6,540
> Median household income: $64,078 — 111th highest of 376 metros
> Homeownership rate: 77.3% — 9th highest of 376 metros
> Median home value: $145,900 — 89th lowest of 376 metros

40. Dothan, AL
> Est. annual housing costs: $6,516
> Median household income: $47,608 — 27th lowest of 376 metros
> Homeownership rate: 69.7% — 99th highest of 376 metros
> Median home value: $131,600 — 49th lowest of 376 metros
[in-text-ad]

39. Pine Bluff, AR
> Est. annual housing costs: $6,504
> Median household income: $41,856 — 3rd lowest of 376 metros
> Homeownership rate: 65.2% — 145th lowest of 376 metros
> Median home value: $85,700 — 2nd lowest of 376 metros
[recirclink id=1069876]

38. Alexandria, LA
> Est. annual housing costs: $6,480
> Median household income: $48,294 — 42nd lowest of 376 metros
> Homeownership rate: 65.7% — 158th lowest of 376 metros
> Median home value: $144,500 — 85th lowest of 376 metros

37. St. Joseph, MO-KS
> Est. annual housing costs: $6,468
> Median household income: $53,298 — 101st lowest of 376 metros
> Homeownership rate: 66.0% — 166th lowest of 376 metros
> Median home value: $126,500 — 44th lowest of 376 metros
[in-text-ad-2]

36. Idaho Falls, ID
> Est. annual housing costs: $6,456
> Median household income: $61,877 — 142nd highest of 376 metros
> Homeownership rate: 71.9% — 51st highest of 376 metros
> Median home value: $204,800 — 148th highest of 376 metros

35. Lima, OH
> Est. annual housing costs: $6,456
> Median household income: $51,892 — 83rd lowest of 376 metros
> Homeownership rate: 66.7% — 188th lowest of 376 metros
> Median home value: $120,300 — 28th lowest of 376 metros
[in-text-ad]
34. Cape Girardeau, MO-IL
> Est. annual housing costs: $6,444
> Median household income: $51,428 — 75th lowest of 376 metros
> Homeownership rate: 68.5% — 135th highest of 376 metros
> Median home value: $152,300 — 108th lowest of 376 metros (tied)
[recirclink id=1076225]

33. Cleveland, TN
> Est. annual housing costs: $6,432
> Median household income: $51,015 — 71st lowest of 376 metros
> Homeownership rate: 68.0% — 149th highest of 376 metros
> Median home value: $161,600 — 143rd lowest of 376 metros

32. Wausau-Weston, WI
> Est. annual housing costs: $6,432
> Median household income: $62,237 — 133rd highest of 376 metros
> Homeownership rate: 72.3% — 45th highest of 376 metros
> Median home value: $158,200 — 134th lowest of 376 metros
[in-text-ad-2]

31. Toledo, OH
> Est. annual housing costs: $6,420
> Median household income: $53,600 — 108th lowest of 376 metros
> Homeownership rate: 63.5% — 106th lowest of 376 metros
> Median home value: $134,900 — 54th lowest of 376 metros

30. Jonesboro, AR
> Est. annual housing costs: $6,420
> Median household income: $47,610 — 28th lowest of 376 metros
> Homeownership rate: 58.1% — 35th lowest of 376 metros
> Median home value: $136,000 — 57th lowest of 376 metros
[in-text-ad]

29. Sheboygan, WI
> Est. annual housing costs: $6,420
> Median household income: $62,101 — 136th highest of 376 metros
> Homeownership rate: 70.3% — 86th highest of 376 metros
> Median home value: $165,400 — 156th lowest of 376 metros
[recirclink id=1076750]

28. Charleston, WV
> Est. annual housing costs: $6,408
> Median household income: $46,099 — 15th lowest of 376 metros
> Homeownership rate: 72.5% — 44th highest of 376 metros
> Median home value: $110,100 — 14th lowest of 376 metros

27. Dubuque, IA
> Est. annual housing costs: $6,384
> Median household income: $64,493 — 107th highest of 376 metros
> Homeownership rate: 73.4% — 34th highest of 376 metros
> Median home value: $175,300 — 175th lowest of 376 metros (tied)
[in-text-ad-2]

26. Dalton, GA
> Est. annual housing costs: $6,372
> Median household income: $50,322 — 64th lowest of 376 metros
> Homeownership rate: 67.2% — 172nd highest of 376 metros
> Median home value: $136,800 — 58th lowest of 376 metros
25. Oshkosh-Neenah, WI
> Est. annual housing costs: $6,348
> Median household income: $59,947 — 171st highest of 376 metros
> Homeownership rate: 65.7% — 157th lowest of 376 metros
> Median home value: $158,400 — 135th lowest of 376 metros
[in-text-ad]

24. Rockford, IL
> Est. annual housing costs: $6,324
> Median household income: $56,899 — 159th lowest of 376 metros
> Homeownership rate: 67.9% — 152nd highest of 376 metros
> Median home value: $126,700 — 45th lowest of 376 metros
[recirclink id=1052847]

23. Fort Wayne, IN
> Est. annual housing costs: $6,312
> Median household income: $57,693 — 173rd lowest of 376 metros
> Homeownership rate: 69.7% — 97th highest of 376 metros
> Median home value: $138,200 — 65th lowest of 376 metros (tied)
22. Florence-Muscle Shoals, AL
> Est. annual housing costs: $6,300
> Median household income: $48,244 — 40th lowest of 376 metros
> Homeownership rate: 69.3% — 110th highest of 376 metros
> Median home value: $140,000 — 74th lowest of 376 metros
[in-text-ad-2]

21. Cedar Rapids, IA
> Est. annual housing costs: $6,288
> Median household income: $66,620 — 90th highest of 376 metros
> Homeownership rate: 75.3% — 19th highest of 376 metros
> Median home value: $159,800 — 138th lowest of 376 metros (tied)

20. Danville, IL
> Est. annual housing costs: $6,288
> Median household income: $46,842 — 24th lowest of 376 metros
> Homeownership rate: 70.8% — 71st highest of 376 metros
> Median home value: $80,900 — the lowest of 376 metros
[in-text-ad]

19. Johnstown, PA
> Est. annual housing costs: $6,288
> Median household income: $47,644 — 30th lowest of 376 metros
> Homeownership rate: 74.7% — 24th highest of 376 metros
> Median home value: $94,900 — 5th lowest of 376 metros
[recirclink id=1065785]
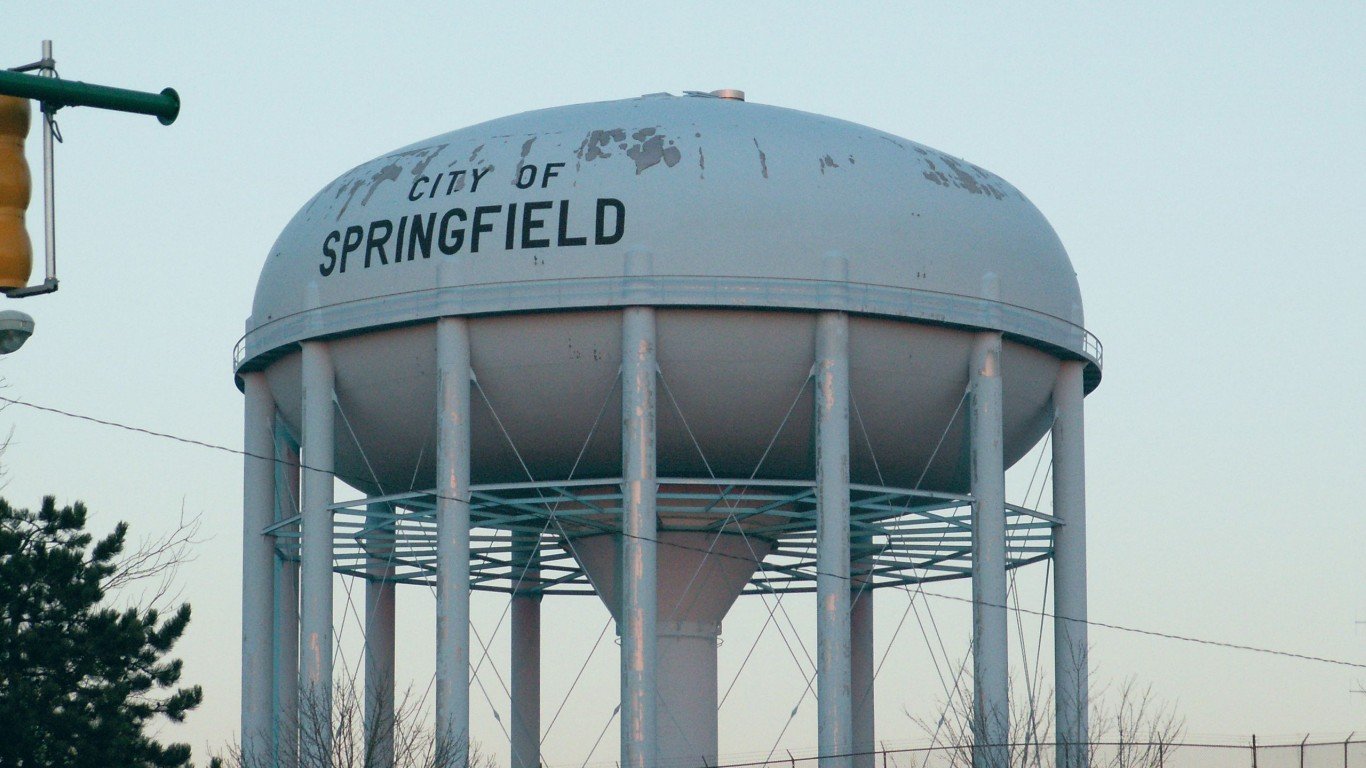
18. Springfield, OH
> Est. annual housing costs: $6,276
> Median household income: $51,504 — 76th lowest of 376 metros
> Homeownership rate: 67.1% — 174th highest of 376 metros
> Median home value: $120,500 — 29th lowest of 376 metros (tied)

17. Macon-Bibb County, GA
> Est. annual housing costs: $6,264
> Median household income: $46,083 — 14th lowest of 376 metros
> Homeownership rate: 61.4% — 72nd lowest of 376 metros
> Median home value: $132,700 — 50th lowest of 376 metros
[in-text-ad-2]

16. Davenport-Moline-Rock Island, IA-IL
> Est. annual housing costs: $6,204
> Median household income: $59,876 — 172nd highest of 376 metros
> Homeownership rate: 70.7% — 73rd highest of 376 metros
> Median home value: $141,600 — 78th lowest of 376 metros

15. Logan, UT-ID
> Est. annual housing costs: $6,192
> Median household income: $60,466 — 164th highest of 376 metros
> Homeownership rate: 64.7% — 132nd lowest of 376 metros
> Median home value: $252,800 — 87th highest of 376 metros
[in-text-ad]

14. Flint, MI
> Est. annual housing costs: $6,192
> Median household income: $50,269 — 62nd lowest of 376 metros
> Homeownership rate: 70.0% — 92nd highest of 376 metros
> Median home value: $119,500 — 24th lowest of 376 metros (tied)
[recirclink id=1069876]

13. Pocatello, ID
> Est. annual housing costs: $6,192
> Median household income: $51,914 — 84th lowest of 376 metros
> Homeownership rate: 68.3% — 140th highest of 376 metros
> Median home value: $165,800 — 157th lowest of 376 metros (tied)

12. Kingsport-Bristol, TN-VA
> Est. annual housing costs: $6,156
> Median household income: $46,685 — 22nd lowest of 376 metros
> Homeownership rate: 73.5% — 32nd highest of 376 metros
> Median home value: $140,800 — 76th lowest of 376 metros
[in-text-ad-2]

11. Bay City, MI
> Est. annual housing costs: $6,144
> Median household income: $48,290 — 41st lowest of 376 metros
> Homeownership rate: 76.1% — 16th highest of 376 metros
> Median home value: $106,400 — 11th lowest of 376 metros

10. Youngstown-Warren-Boardman, OH-PA
> Est. annual housing costs: $6,132
> Median household income: $48,020 — 34th lowest of 376 metros
> Homeownership rate: 70.3% — 83rd highest of 376 metros
> Median home value: $110,300 — 15th lowest of 376 metros
[in-text-ad]

9. Weirton-Steubenville, WV-OH
> Est. annual housing costs: $6,132
> Median household income: $47,525 — 26th lowest of 376 metros
> Homeownership rate: 71.0% — 67th highest of 376 metros
> Median home value: $95,400 — 6th lowest of 376 metros
[recirclink id=1076225]

8. Decatur, IL
> Est. annual housing costs: $6,108
> Median household income: $53,725 — 111th lowest of 376 metros
> Homeownership rate: 69.1% — 120th highest of 376 metros
> Median home value: $103,100 — 9th lowest of 376 metros
7. Decatur, AL
> Est. annual housing costs: $6,108
> Median household income: $51,842 — 82nd lowest of 376 metros
> Homeownership rate: 73.5% — 31st highest of 376 metros
> Median home value: $137,600 — 62nd lowest of 376 metros (tied)
[in-text-ad-2]
6. Michigan City-La Porte, IN
> Est. annual housing costs: $6,060
> Median household income: $57,010 — 161st lowest of 376 metros
> Homeownership rate: 73.3% — 37th highest of 376 metros
> Median home value: $139,900 — 73rd lowest of 376 metros

5. Cumberland, MD-WV
> Est. annual housing costs: $5,988
> Median household income: $50,188 — 59th lowest of 376 metros
> Homeownership rate: 71.7% — 54th highest of 376 metros
> Median home value: $131,300 — 48th lowest of 376 metros
[in-text-ad]

4. Canton-Massillon, OH
> Est. annual housing costs: $5,940
> Median household income: $54,854 — 125th lowest of 376 metros
> Homeownership rate: 68.8% — 128th highest of 376 metros
> Median home value: $138,300 — 67th lowest of 376 metros
[recirclink id=1076750]

3. Mansfield, OH
> Est. annual housing costs: $5,940
> Median household income: $49,186 — 47th lowest of 376 metros
> Homeownership rate: 66.9% — 185th highest of 376 metros
> Median home value: $115,100 — 18th lowest of 376 metros

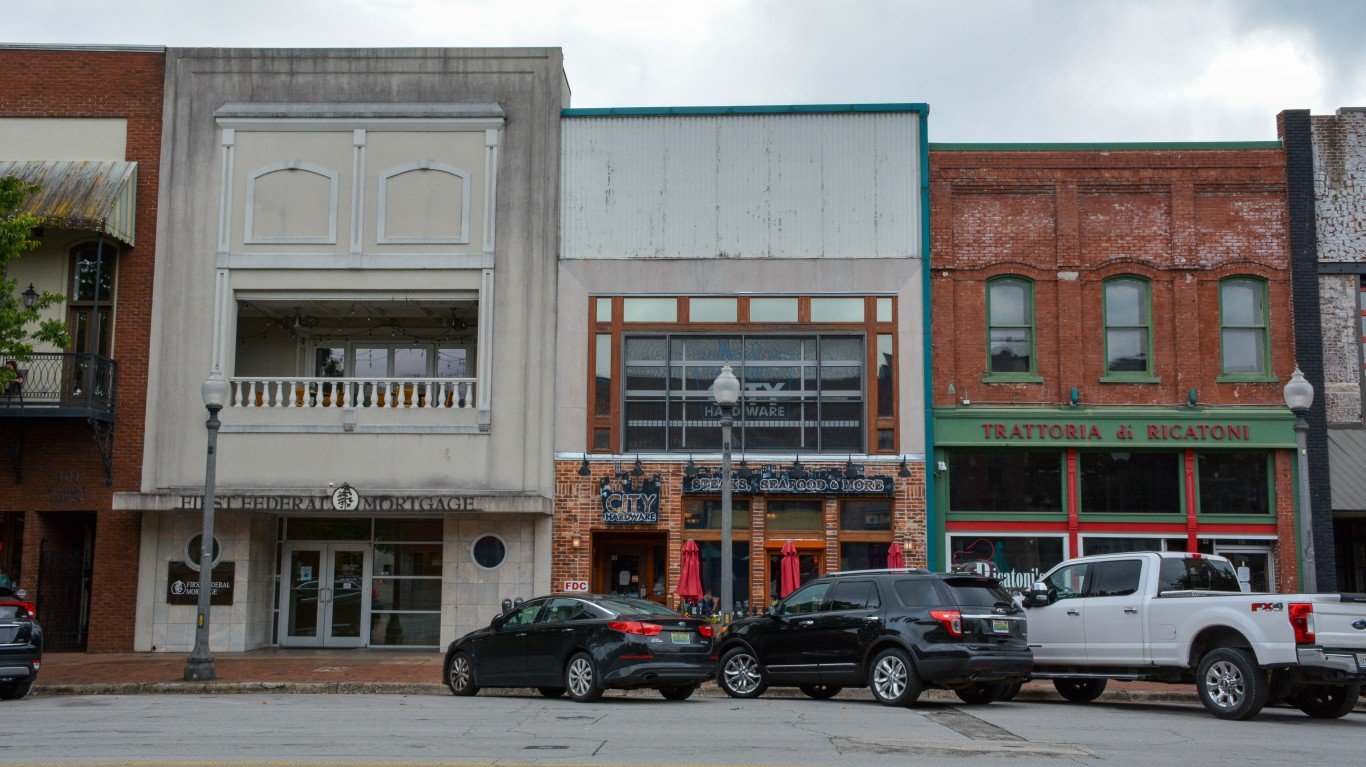
2. Anniston-Oxford, AL
> Est. annual housing costs: $5,784
> Median household income: $50,128 — 57th lowest of 376 metros
> Homeownership rate: 70.4% — 82nd highest of 376 metros
> Median home value: $121,600 — 33rd lowest of 376 metros
[in-text-ad-2]

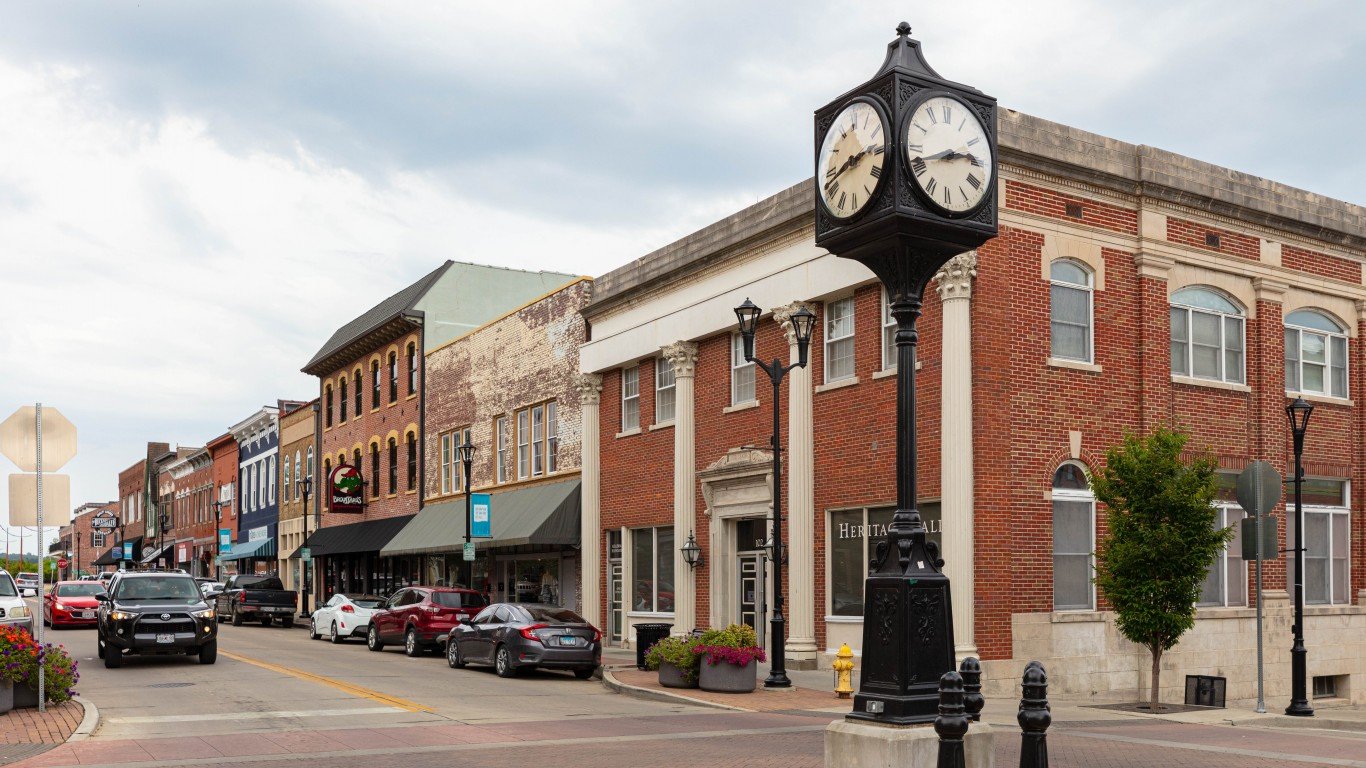
1. Jefferson City, MO
> Est. annual housing costs: $5,364
> Median household income: $60,586 — 162nd highest of 376 metros
> Homeownership rate: 71.7% — 55th highest of 376 metros
> Median home value: $162,100 — 145th lowest of 376 metros
Methodology
To determine the metro areas where single people pay the least for housing, 24/7 Wall St. reviewed data on housing costs from the Economic Policy Institute’s 2022 Family Budget Calculator.
In the Family Budget Calculator, the EPI estimates the housing costs for families to maintain a modest yet adequate standard of living. The budgets are created for 10 family types for U.S. counties and metro areas. We used estimates for a single person with no children. For this family type, the EPI assumes the single person is employed and files federal income taxes as the head of household.
We used the 384 metropolitan statistical areas as delineated by the United States Office of Management and Budget and used by the Census Bureau as our definition of metros.
Metros were ranked based on the EPI’s annual housing cost estimates. Ties were broken using five-year estimates of median gross rent from the U.S. Census Bureau’s 2020 American Community Survey.
Additional information on median household income, homeownership rate, and median home value are from the U.S. Census Bureau’s 2020 American Community Survey. Because the Census Bureau did not release one-year estimates for 2020 due to data collection issues caused by the COVID-19 pandemic, all ACS data are five-year estimates.
Contact [email protected] for any questions or corrections.