

Despite the ongoing national debate about immigration policy, the United States remains one of the world’s biggest magnets for immigrants. Foreign nationals enter the country via numerous ways, but the general motives are the same: they come to the U.S. seeking better opportunities for themselves and their children.
Immigrants who come to the U.S. have many cities to choose from where to lay their roots. Some choose to live in areas where previous immigrants from their home country have already established a community. But these may not always be the best options.
To identify the 25 best U.S. cities for immigrants, 24/7 Wall St. reviewed the report “Immigrants and Opportunity in America’s Cities” from The George W. Bush Institute-SMU Economic Growth Initiative at The George W. Bush Institute.
The report ranks the 100 most populous U.S. metro areas using an index of 12 different measures, including median income of households headed by foreign-born people, the share of foreign born residents with a bachelor’s degree, homeownership rates among foreign-born populations, and immigration rates. Most data used in the report are from the U.S. Census Bureau’s 2020 American Community Survey. A full methodology and documentation of courses is available on pages 72 and 73 of the report.
Metropolitan areas with the largest share of immigrants, like Miami, Los Angeles, or New York City, are not on this list thanks largely to their high cost of living and high cost of housing. (Not just large cities are meccas for immigrants. Here are small cities attracting the most immigrants.)
An exception to this is the San Francisco and San Jose metropolitan areas of Northern California, which have among the highest share of foreign-born residents. One reason for this is the tech industry, which depends on skilled immigrant workers. The San Jose metro area, which includes Sunnyvale and Santa Clara, is one of eight cities on this list where foreign-born residents tend to have higher median household incomes than the median for all residents.
Generally speaking, foreign-born residents tend to have lower incomes compared to the total metro area population, but there are some exceptions, including eight of the metro areas listed. For example, foreign-born people in Jackson, Mississippi, have an average median household income of $70,000 compared to $53,639 for the total metro area population. (Also see, the states where the most people are immigrants.)
Foreign-born residents in these 25 cities also are more likely to have at least a bachelor’s degree than the metro area’s population. There are some exceptions, and in five of 25 cities, the bachelor’s degree attainment rate of foreign-born adult residents is lower than the overall rate. Four of these 25 metropolitan areas have foreign-born populations greater than 20%: San Jose, San Francisco, Bridgeport, and Washington D.C.
Here are the best cities for immigrants.
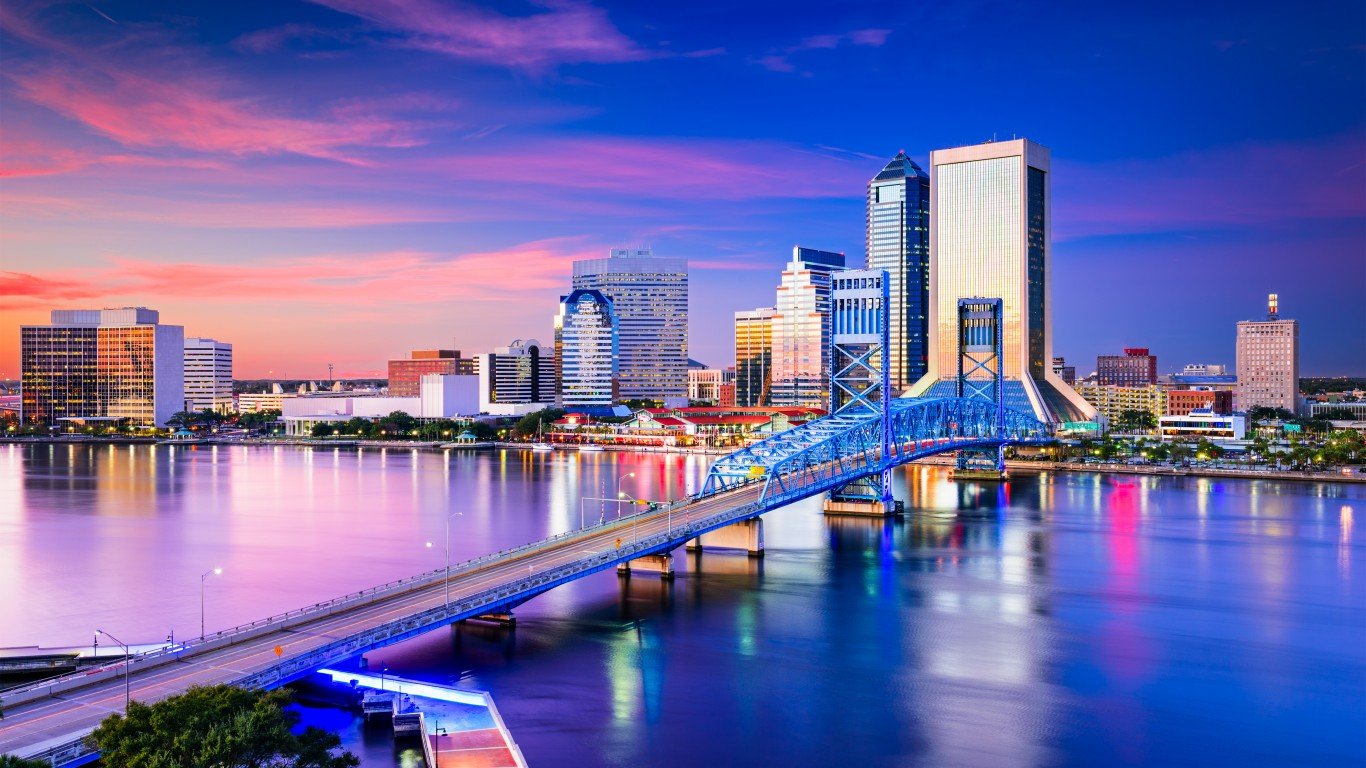
25. Jacksonville, FL
> Composite score: 0.28
> Foreign-born population: 9.4% of total – 50th highest of 100 largest metro areas (149,986 total)
> Net immigration, 2010-2021: +39,834 people (contributed 3.0% to net-pop. growth)
> Adults with a bachelor’s degree: 36.8% of foreign-born pop.; 32.1% of total pop.
> Median household income: $64,190 foreign-born households; $63,064 all households
> Home ownership rate: 62.4% among foreign-born pop.; 65.3% among total pop.
> Foreign-born adults proficient in English: 79.4% – 33rd highest of 100 largest metro areas
[in-text-ad]

24. Virginia Beach-Norfolk-Newport News, VA-NC
> Composite score: 0.32
> Foreign-born population: 6.7% of total – 74th highest of 100 largest metro areas (119,156 total)
> Net immigration, 2010-2021: +44,596 people (contributed 2.6% to net-pop. growth)
> Adults with a bachelor’s degree: 37.0% of foreign-born pop.; 32.9% of total pop.
> Median household income: $64,516 foreign-born households; $68,454 all households
> Home ownership rate: 59.6% among foreign-born pop.; 62.3% among total pop.
> Foreign-born adults proficient in English: 84.5% – 6th highest of 100 largest metro areas
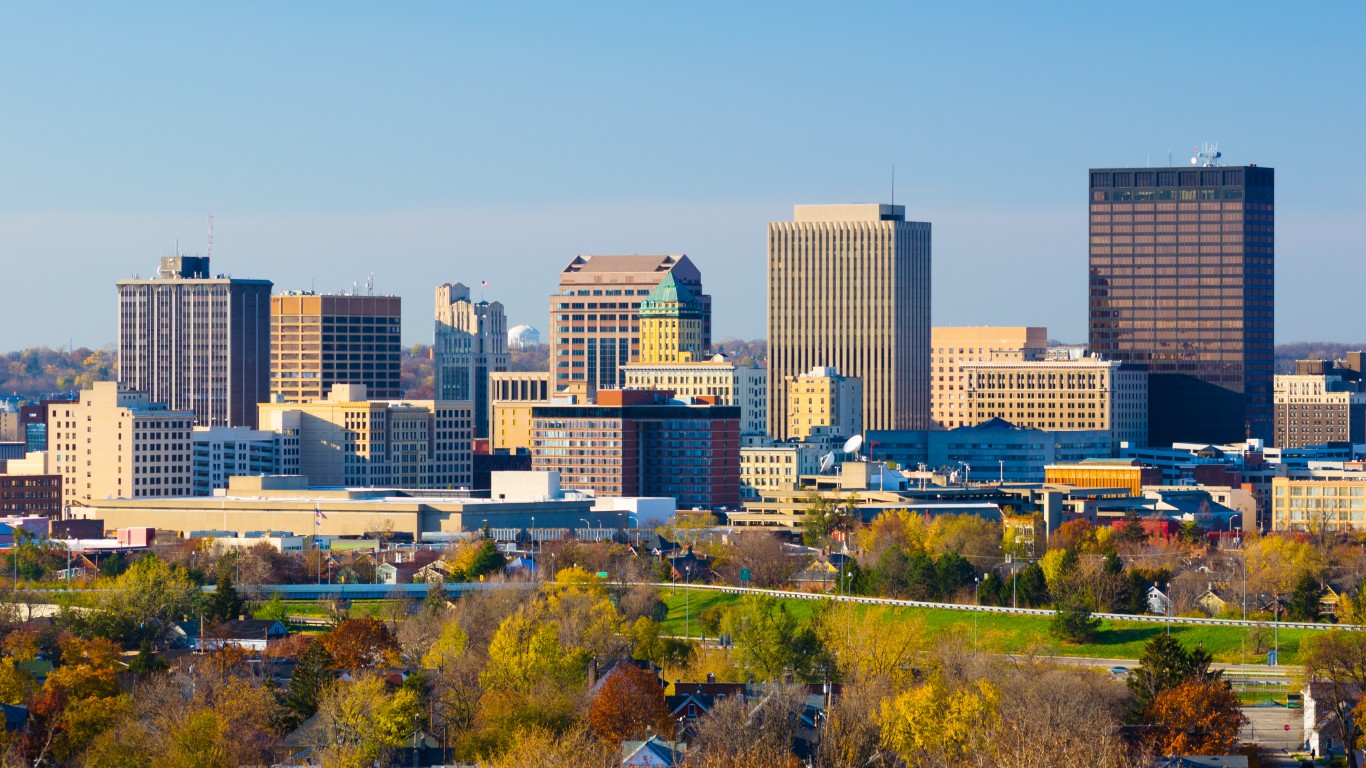
23. Dayton-Kettering, OH
> Composite score: 0.33
> Foreign-born population: 4.5% of total – 92nd highest of 100 largest metro areas (36,689 total)
> Net immigration, 2010-2021: +16,580 people (contributed 2.1% to net-pop. growth)
> Adults with a bachelor’s degree: 43.4% of foreign-born pop.; 29.9% of total pop.
> Median household income: $61,216 foreign-born households; $57,631 all households
> Home ownership rate: 52.9% among foreign-born pop.; 63.6% among total pop.
> Foreign-born adults proficient in English: 77.8% – 47th highest of 100 largest metro areas
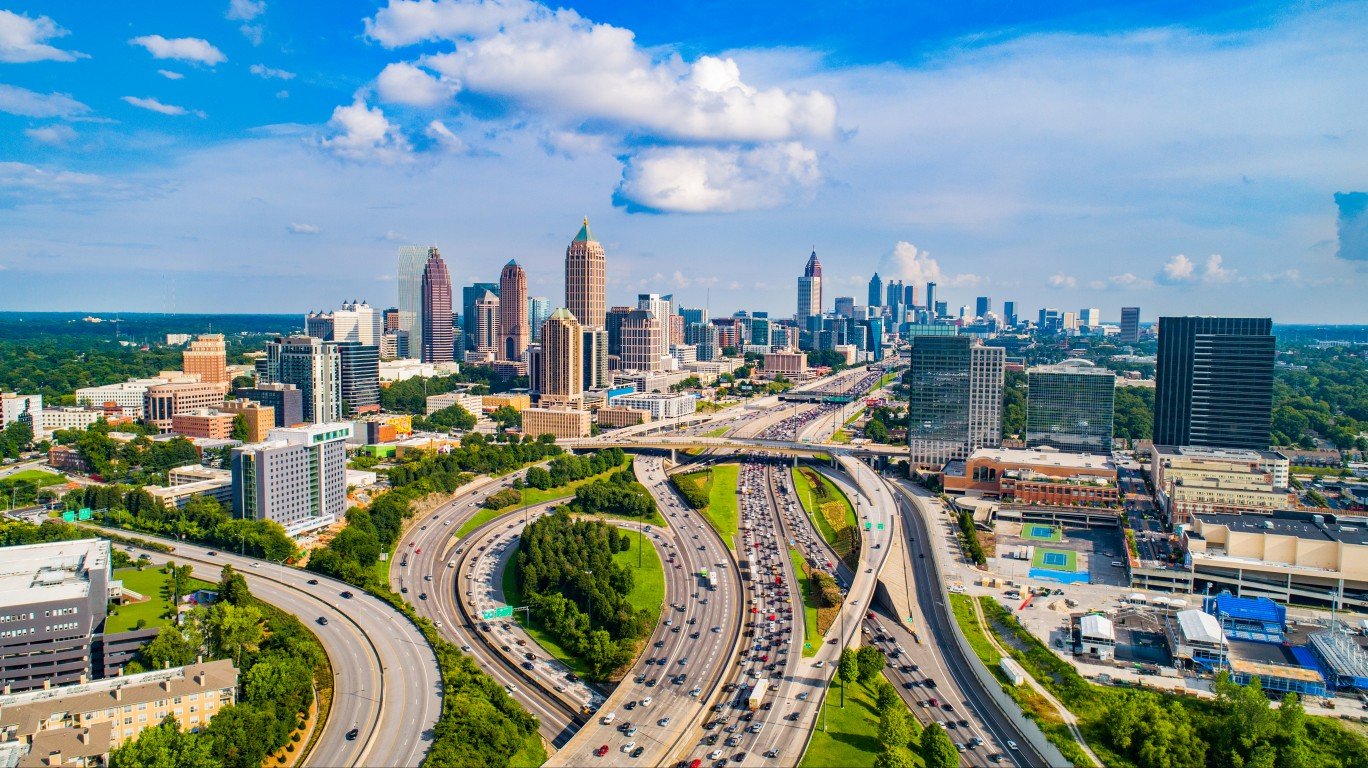
22. Atlanta-Sandy Springs-Alpharetta, GA
> Composite score: 0.35
> Foreign-born population: 13.9% of total – 29th highest of 100 largest metro areas (843,540 total)
> Net immigration, 2010-2021: +166,732 people (contributed 3.1% to net-pop. growth)
> Adults with a bachelor’s degree: 39.6% of foreign-born pop.; 39.5% of total pop.
> Median household income: $68,636 foreign-born households; $71,193 all households
> Home ownership rate: 61.2% among foreign-born pop.; 64.2% among total pop.
> Foreign-born adults proficient in English: 79.8% – 25th highest of 100 largest metro areas
[in-text-ad-2]

21. Colorado Springs, CO
> Composite score: 0.40
> Foreign-born population: 6.8% of total – 72nd highest of 100 largest metro areas (51,226 total)
> Net immigration, 2010-2021: +11,960 people (contributed 1.8% to net-pop. growth)
> Adults with a bachelor’s degree: 31.2% of foreign-born pop.; 38.6% of total pop.
> Median household income: $67,229 foreign-born households; $71,171 all households
> Home ownership rate: 61.9% among foreign-born pop.; 65.8% among total pop.
> Foreign-born adults proficient in English: 84.5% – 5th highest of 100 largest metro areas

20. Richmond, VA
> Composite score: 0.48
> Foreign-born population: 8.0% of total – 59th highest of 100 largest metro areas (104,308 total)
> Net immigration, 2010-2021: +34,200 people (contributed 2.9% to net-pop. growth)
> Adults with a bachelor’s degree: 41.1% of foreign-born pop.; 38.0% of total pop.
> Median household income: $65,710 foreign-born households; $71,223 all households
> Home ownership rate: 57.0% among foreign-born pop.; 66.6% among total pop.
> Foreign-born adults proficient in English: 78.2% – 44th highest of 100 largest metro areas
[in-text-ad]

19. Harrisburg-Carlisle, PA
> Composite score: 0.50
> Foreign-born population: 6.8% of total – 73rd highest of 100 largest metro areas (39,466 total)
> Net immigration, 2010-2021: +16,050 people (contributed 2.9% to net-pop. growth)
> Adults with a bachelor’s degree: 40.5% of foreign-born pop.; 33.4% of total pop.
> Median household income: $68,855 foreign-born households; $67,219 all households
> Home ownership rate: 52.4% among foreign-born pop.; 67.5% among total pop.
> Foreign-born adults proficient in English: 77.5% – 54th highest of 100 largest metro areas

18. Boston-Cambridge-Newton, MA-NH
> Composite score: 0.51
> Foreign-born population: 18.9% of total – 20th highest of 100 largest metro areas (922,623 total)
> Net immigration, 2010-2021: +320,383 people (contributed 7.0% to net-pop. growth)
> Adults with a bachelor’s degree: 42.3% of foreign-born pop.; 48.9% of total pop.
> Median household income: $77,142 foreign-born households; $93,537 all households
> Home ownership rate: 46.6% among foreign-born pop.; 61.7% among total pop.
> Foreign-born adults proficient in English: 75.0% – 71st highest of 100 largest metro areas

17. Bridgeport-Stamford-Norwalk, CT
> Composite score: 0.51
> Foreign-born population: 21.9% of total – 13th highest of 100 largest metro areas (206,480 total)
> Net immigration, 2010-2021: +51,164 people (contributed 5.6% to net-pop. growth)
> Adults with a bachelor’s degree: 36.8% of foreign-born pop.; 48.9% of total pop.
> Median household income: $76,108 foreign-born households; $97,539 all households
> Home ownership rate: 55.0% among foreign-born pop.; 66.7% among total pop.
> Foreign-born adults proficient in English: 77.4% – 56th highest of 100 largest metro areas
[in-text-ad-2]

16. Philadelphia-Camden-Wilmington, PA-NJ-DE-MD
> Composite score: 0.52
> Foreign-born population: 11.1% of total – 43rd highest of 100 largest metro areas (677,791 total)
> Net immigration, 2010-2021: +172,006 people (contributed 2.9% to net-pop. growth)
> Adults with a bachelor’s degree: 41.5% of foreign-born pop.; 38.7% of total pop.
> Median household income: $68,532 foreign-born households; $74,825 all households
> Home ownership rate: 59.4% among foreign-born pop.; 67.2% among total pop.
> Foreign-born adults proficient in English: 77.5% – 52nd highest of 100 largest metro areas
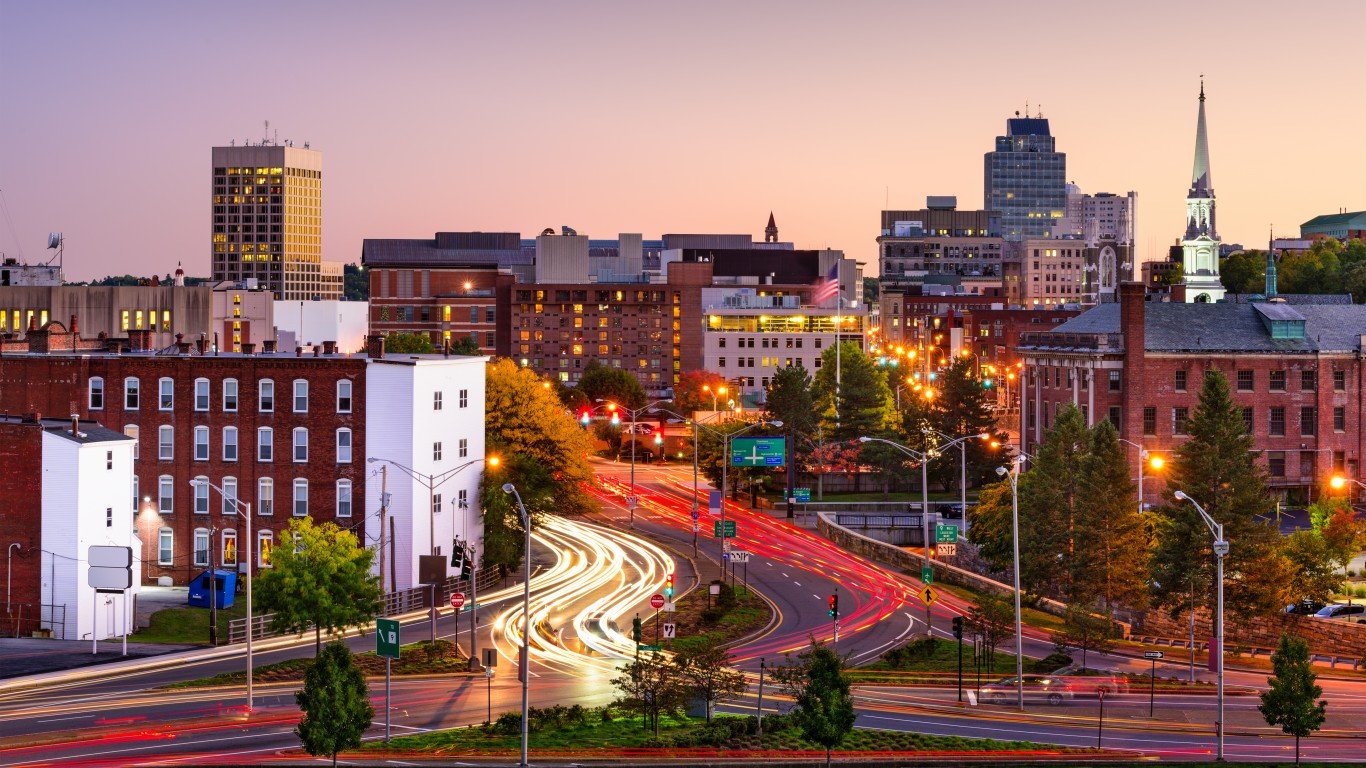
15. Worcester, MA-CT
> Composite score: 0.56
> Foreign-born population: 11.4% of total – 42nd highest of 100 largest metro areas (107,958 total)
> Net immigration, 2010-2021: +39,538 people (contributed 4.3% to net-pop. growth)
> Adults with a bachelor’s degree: 39.0% of foreign-born pop.; 35.4% of total pop.
> Median household income: $71,506 foreign-born households; $75,705 all households
> Home ownership rate: 54.4% among foreign-born pop.; 66.0% among total pop.
> Foreign-born adults proficient in English: 77.7% – 48th highest of 100 largest metro areas
[in-text-ad]
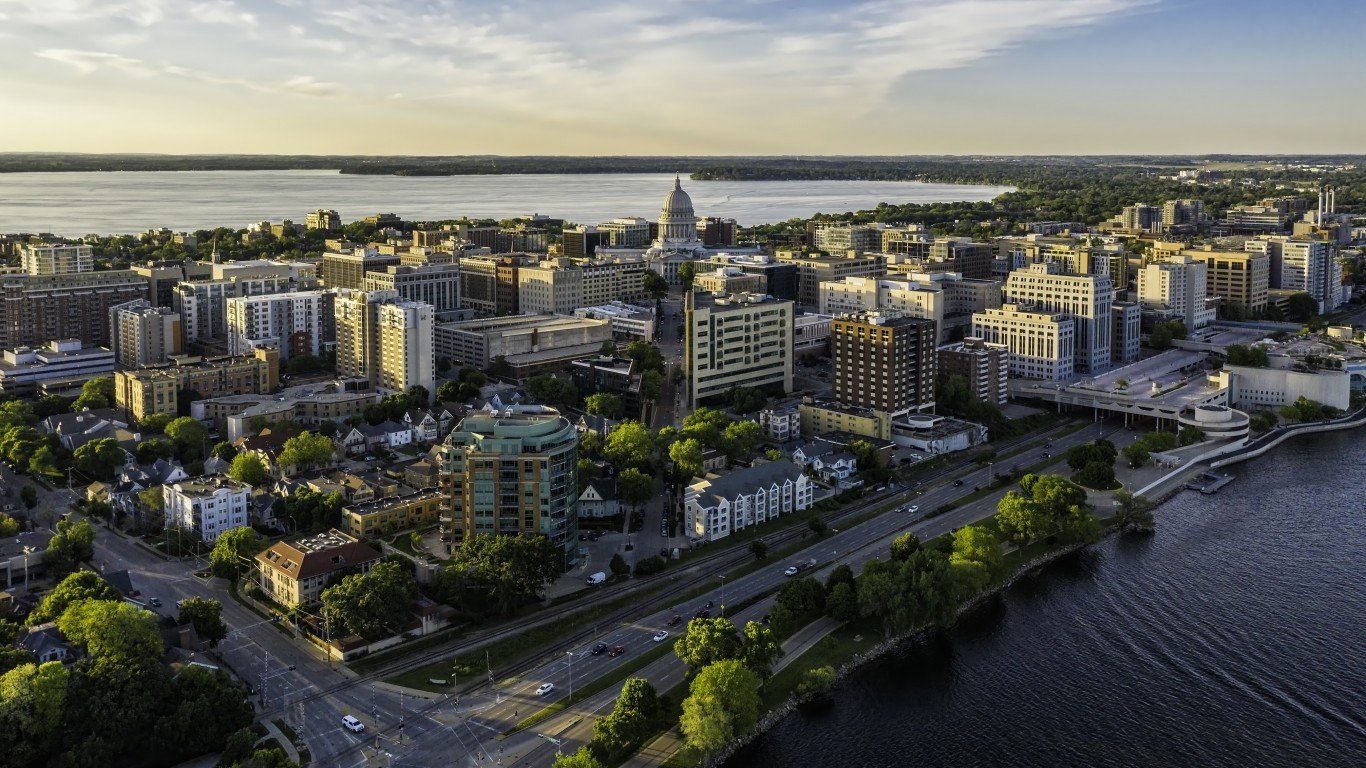
14. Madison, WI
> Composite score: 0.56
> Foreign-born population: 7.4% of total – 65th highest of 100 largest metro areas (49,802 total)
> Net immigration, 2010-2021: +18,537 people (contributed 3.1% to net-pop. growth)
> Adults with a bachelor’s degree: 54.0% of foreign-born pop.; 47.1% of total pop.
> Median household income: $66,204 foreign-born households; $73,807 all households
> Home ownership rate: 43.2% among foreign-born pop.; 61.8% among total pop.
> Foreign-born adults proficient in English: 80.1% – 23rd highest of 100 largest metro areas
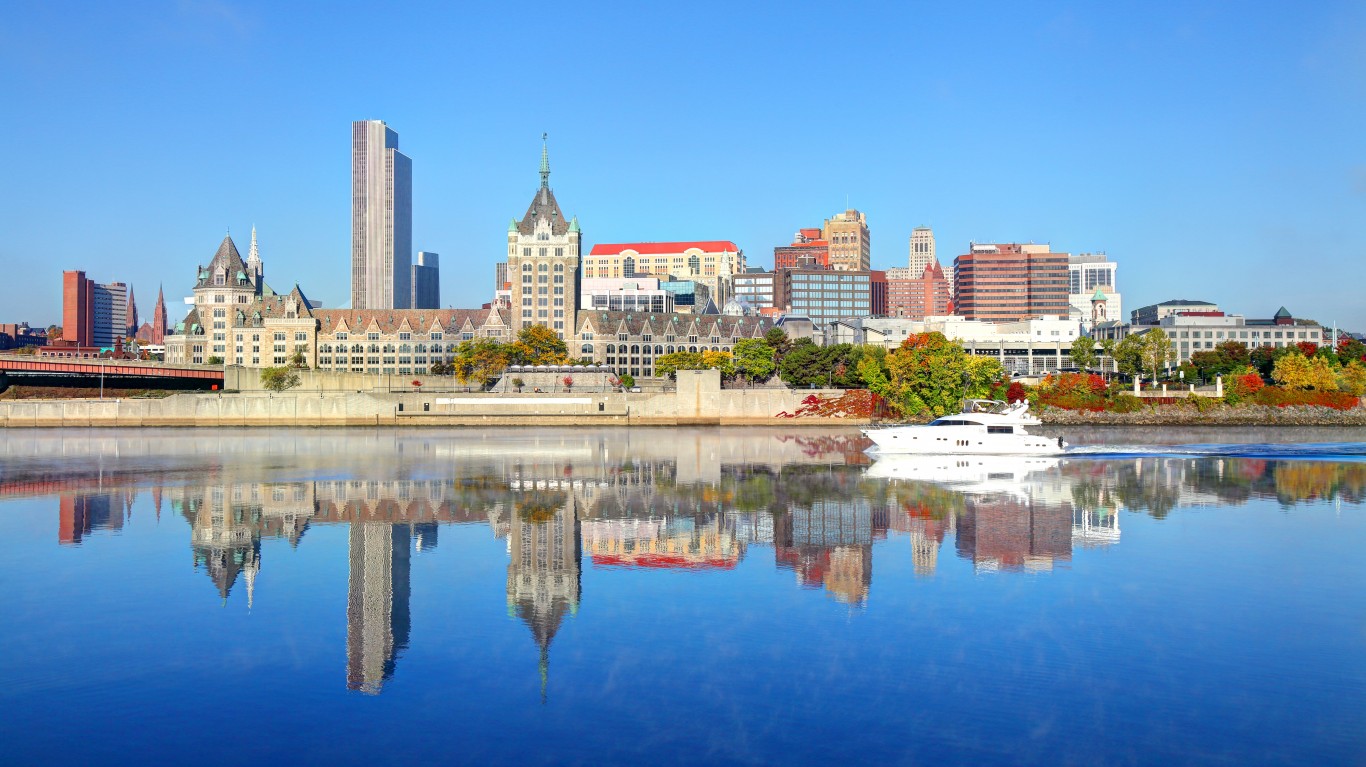
13. Albany-Schenectady-Troy, NY
> Composite score: 0.58
> Foreign-born population: 8.3% of total – 57th highest of 100 largest metro areas (73,346 total)
> Net immigration, 2010-2021: +18,115 people (contributed 2.1% to net-pop. growth)
> Adults with a bachelor’s degree: 45.4% of foreign-born pop.; 38.6% of total pop.
> Median household income: $70,119 foreign-born households; $72,810 all households
> Home ownership rate: 54.0% among foreign-born pop.; 63.5% among total pop.
> Foreign-born adults proficient in English: 84.3% – 7th highest of 100 largest metro areas
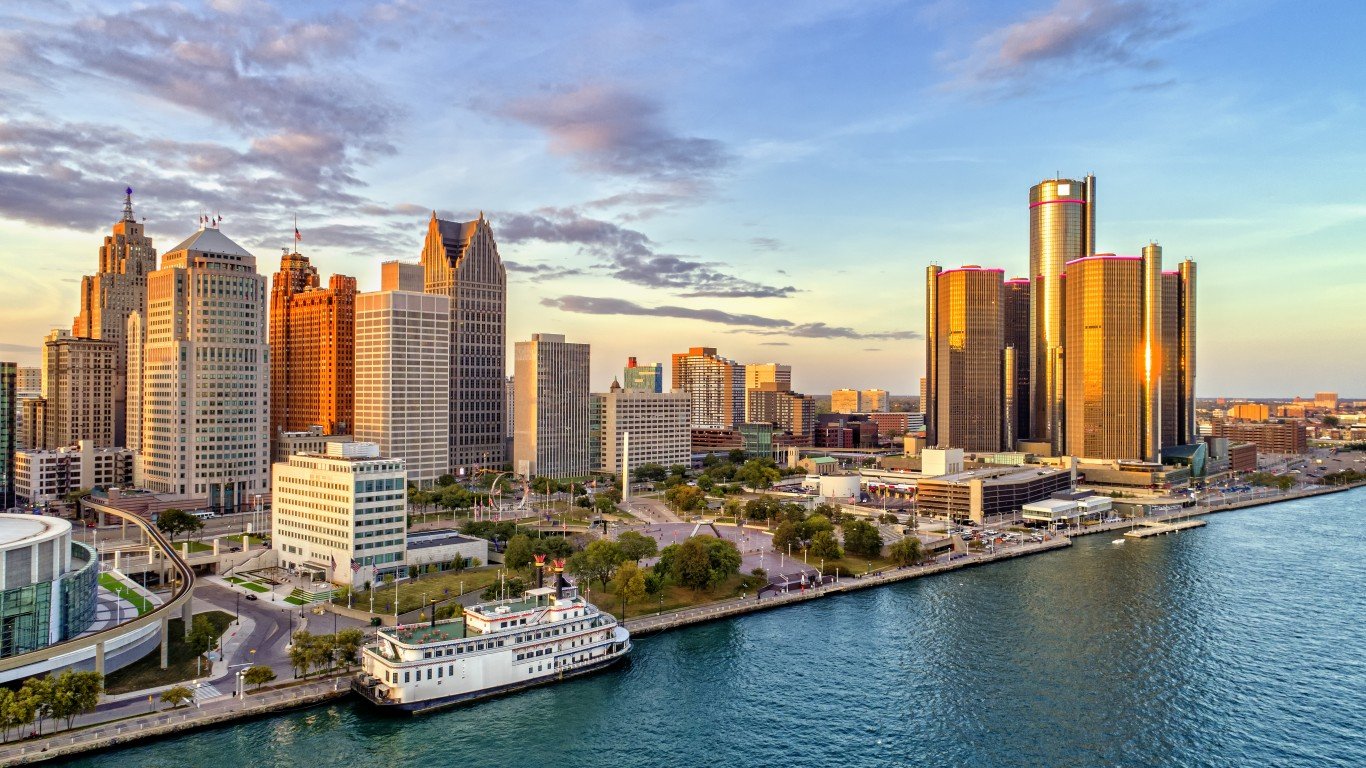
12. Detroit-Warren-Dearborn, MI
> Composite score: 0.67
> Foreign-born population: 10.1% of total – 48th highest of 100 largest metro areas (433,420 total)
> Net immigration, 2010-2021: +116,245 people (contributed 2.7% to net-pop. growth)
> Adults with a bachelor’s degree: 43.6% of foreign-born pop.; 32.2% of total pop.
> Median household income: $68,996 foreign-born households; $62,768 all households
> Home ownership rate: 66.5% among foreign-born pop.; 69.5% among total pop.
> Foreign-born adults proficient in English: 79.6% – 29th highest of 100 largest metro areas
[in-text-ad-2]

11. Hartford-East Hartford-Middletown, CT
> Composite score: 0.67
> Foreign-born population: 13.3% of total – 31st highest of 100 largest metro areas (160,196 total)
> Net immigration, 2010-2021: +51,371 people (contributed 4.2% to net-pop. growth)
> Adults with a bachelor’s degree: 38.7% of foreign-born pop.; 39.6% of total pop.
> Median household income: $71,205 foreign-born households; $78,631 all households
> Home ownership rate: 57.6% among foreign-born pop.; 66.4% among total pop.
> Foreign-born adults proficient in English: 80.3% – 21st highest of 100 largest metro areas

10. Cincinnati, OH-KY-IN
> Composite score: 0.71
> Foreign-born population: 5.0% of total – 89th highest of 100 largest metro areas (110,692 total)
> Net immigration, 2010-2021: +39,177 people (contributed 1.8% to net-pop. growth)
> Adults with a bachelor’s degree: 48.4% of foreign-born pop.; 34.5% of total pop.
> Median household income: $68,690 foreign-born households; $66,435 all households
> Home ownership rate: 52.0% among foreign-born pop.; 67.1% among total pop.
> Foreign-born adults proficient in English: 76.0% – 66th highest of 100 largest metro areas
[in-text-ad]
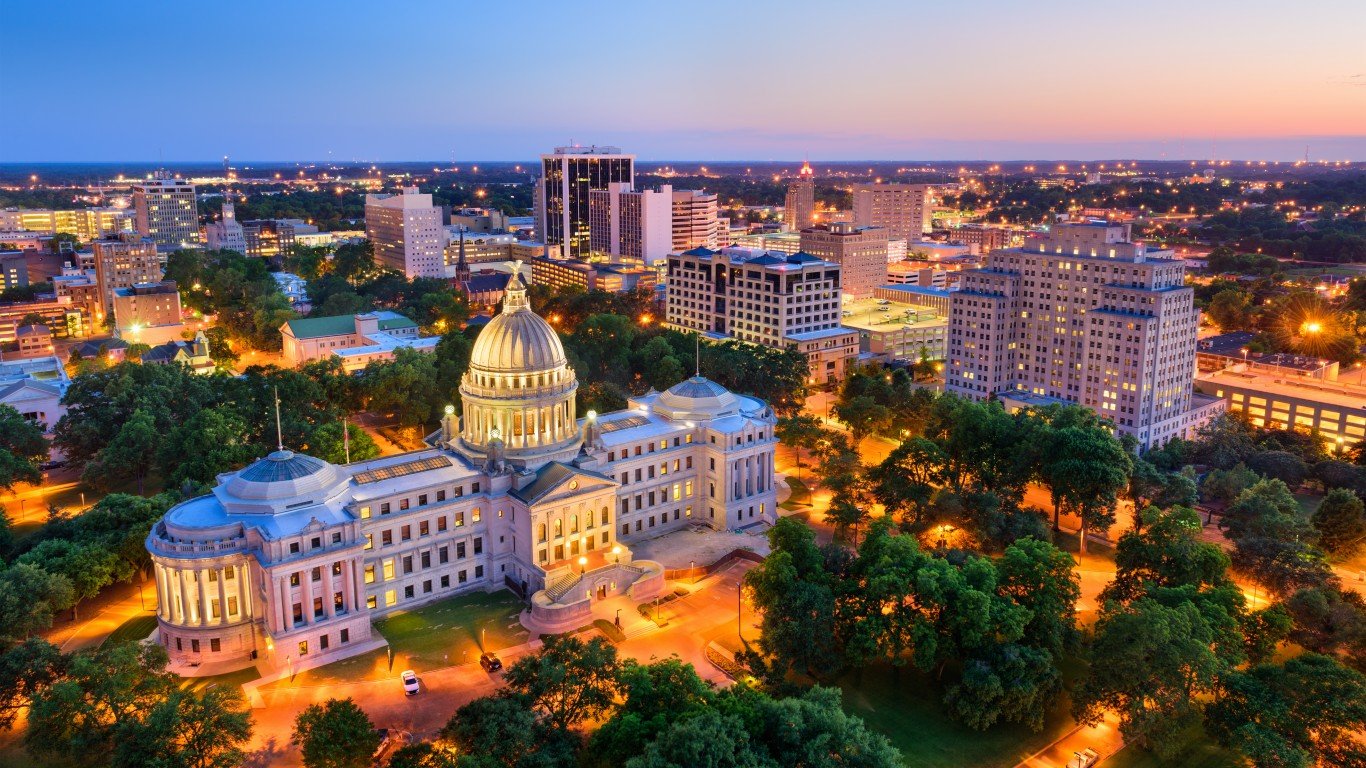
9. Jackson, MS
> Composite score: 0.80
> Foreign-born population: 2.3% of total – 100th highest of 100 largest metro areas (13,566 total)
> Net immigration, 2010-2021: +5,160 people (contributed 0.9% to net-pop. growth)
> Adults with a bachelor’s degree: 42.5% of foreign-born pop.; 31.1% of total pop.
> Median household income: $70,000 foreign-born households; $53,639 all households
> Home ownership rate: 59.8% among foreign-born pop.; 67.6% among total pop.
> Foreign-born adults proficient in English: 81.9% – 15th highest of 100 largest metro areas

8. Raleigh-Cary, NC
> Composite score: 0.84
> Foreign-born population: 12.0% of total – 37th highest of 100 largest metro areas (171,084 total)
> Net immigration, 2010-2021: +40,111 people (contributed 3.5% to net-pop. growth)
> Adults with a bachelor’s degree: 47.8% of foreign-born pop.; 47.8% of total pop.
> Median household income: $74,746 foreign-born households; $78,706 all households
> Home ownership rate: 58.4% among foreign-born pop.; 65.8% among total pop.
> Foreign-born adults proficient in English: 83.3% – 10th highest of 100 largest metro areas

7. Pittsburgh, PA
> Composite score: 1.01
> Foreign-born population: 4.0% of total – 96th highest of 100 largest metro areas (93,323 total)
> Net immigration, 2010-2021: +33,273 people (contributed 1.4% to net-pop. growth)
> Adults with a bachelor’s degree: 58.6% of foreign-born pop.; 35.9% of total pop.
> Median household income: $65,245 foreign-born households; $61,969 all households
> Home ownership rate: 52.7% among foreign-born pop.; 69.6% among total pop.
> Foreign-born adults proficient in English: 82.4% – 13th highest of 100 largest metro areas
[in-text-ad-2]

6. St. Louis, MO-IL
> Composite score: 1.02
> Foreign-born population: 4.8% of total – 91st highest of 100 largest metro areas (135,126 total)
> Net immigration, 2010-2021: +39,760 people (contributed 1.4% to net-pop. growth)
> Adults with a bachelor’s degree: 49.4% of foreign-born pop.; 35.4% of total pop.
> Median household income: $69,907 foreign-born households; $65,725 all households
> Home ownership rate: 59.6% among foreign-born pop.; 69.3% among total pop.
> Foreign-born adults proficient in English: 81.4% – 18th highest of 100 largest metro areas

5. Washington-Arlington-Alexandria, DC-VA-MD-WV
> Composite score: 1.08
> Foreign-born population: 22.8% of total – 11th highest of 100 largest metro areas (1,442,859 total)
> Net immigration, 2010-2021: +378,696 people (contributed 6.7% to net-pop. growth)
> Adults with a bachelor’s degree: 44.9% of foreign-born pop.; 51.7% of total pop.
> Median household income: $90,811 foreign-born households; $106,415 all households
> Home ownership rate: 58.4% among foreign-born pop.; 63.9% among total pop.
> Foreign-born adults proficient in English: 81.4% – 17th highest of 100 largest metro areas
[in-text-ad]

4. Seattle-Tacoma-Bellevue, WA
> Composite score: 1.11
> Foreign-born population: 19.2% of total – 19th highest of 100 largest metro areas (771,758 total)
> Net immigration, 2010-2021: +221,774 people (contributed 6.4% to net-pop. growth)
> Adults with a bachelor’s degree: 46.0% of foreign-born pop.; 43.6% of total pop.
> Median household income: $90,787 foreign-born households; $90,790 all households
> Home ownership rate: 54.2% among foreign-born pop.; 60.2% among total pop.
> Foreign-born adults proficient in English: 78.4% – 41st highest of 100 largest metro areas

3. San Francisco-Oakland-Berkeley, CA
> Composite score: 1.18
> Foreign-born population: 30.7% of total – 4th highest of 100 largest metro areas (1,440,130 total)
> Net immigration, 2010-2021: +237,403 people (contributed 5.5% to net-pop. growth)
> Adults with a bachelor’s degree: 44.6% of foreign-born pop.; 50.7% of total pop.
> Median household income: $102,953 foreign-born households; $110,837 all households
> Home ownership rate: 52.9% among foreign-born pop.; 55.0% among total pop.
> Foreign-born adults proficient in English: 78.6% – 39th highest of 100 largest metro areas
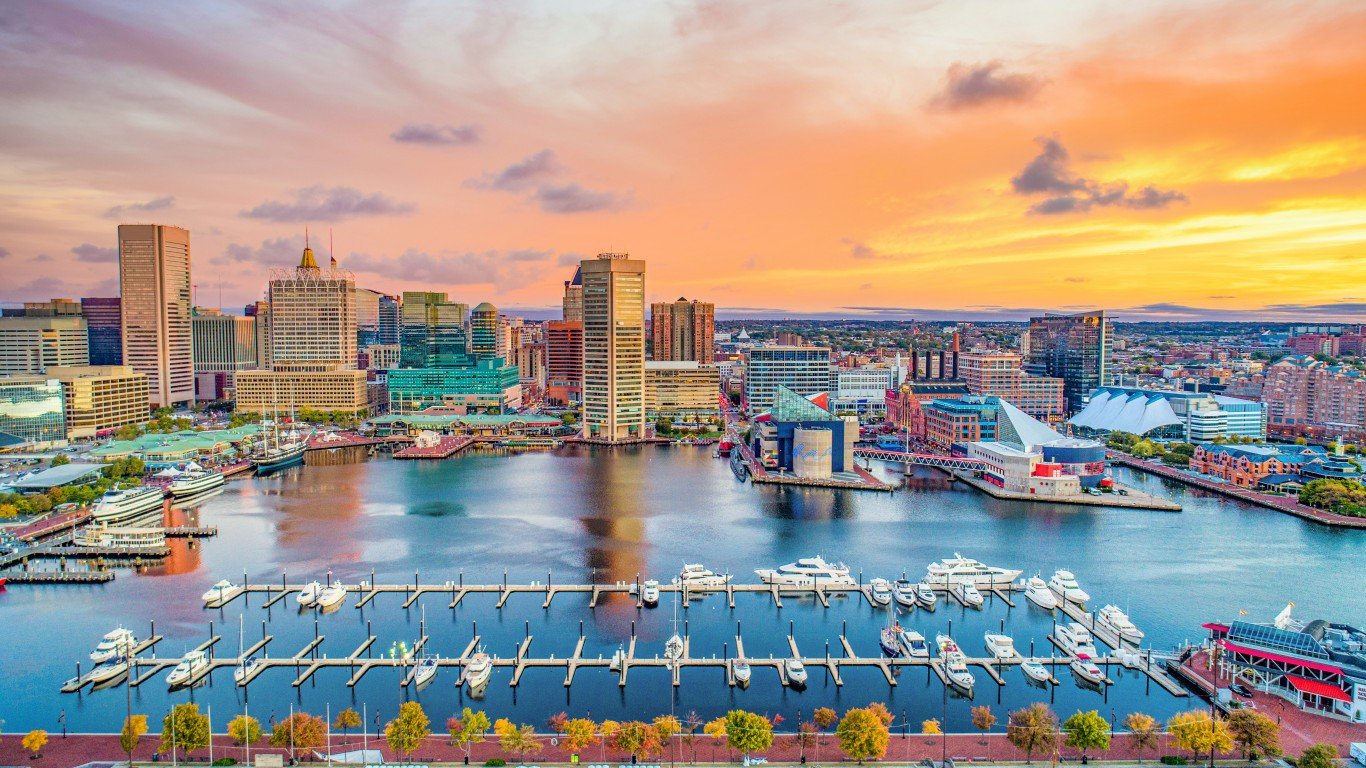
2. Baltimore-Columbia-Towson, MD
> Composite score: 1.21
> Foreign-born population: 10.3% of total – 47th highest of 100 largest metro areas (289,295 total)
> Net immigration, 2010-2021: +71,449 people (contributed 2.6% to net-pop. growth)
> Adults with a bachelor’s degree: 50.4% of foreign-born pop.; 41.0% of total pop.
> Median household income: $81,348 foreign-born households; $83,811 all households
> Home ownership rate: 60.4% among foreign-born pop.; 66.6% among total pop.
> Foreign-born adults proficient in English: 85.3% – 3rd highest of 100 largest metro areas
[in-text-ad-2]

1. San Jose-Sunnyvale-Santa Clara, CA
> Composite score: 2.23
> Foreign-born population: 39.1% of total – 2nd highest of 100 largest metro areas (770,175 total)
> Net immigration, 2010-2021: +157,896 people (contributed 8.6% to net-pop. growth)
> Adults with a bachelor’s degree: 54.5% of foreign-born pop.; 52.5% of total pop.
> Median household income: $136,154 foreign-born households; $129,343 all households
> Home ownership rate: 53.3% among foreign-born pop.; 56.6% among total pop.
> Foreign-born adults proficient in English: 79.4% – 31st highest of 100 largest metro areas
Take This Retirement Quiz To Get Matched With A Financial Advisor (Sponsored)
Take the quiz below to get matched with a financial advisor today.
Each advisor has been vetted by SmartAsset and is held to a fiduciary standard to act in your best interests.
Here’s how it works:
1. Answer SmartAsset advisor match quiz
2. Review your pre-screened matches at your leisure. Check out the
advisors’ profiles.
3. Speak with advisors at no cost to you. Have an introductory call on the phone or introduction in person and choose whom to work with in the future
Take the retirement quiz right here.
Thank you for reading! Have some feedback for us?
Contact the 24/7 Wall St. editorial team.

