The Civil Rights Act, signed into law by President Lyndon Johnson on July 2, 1964, made it illegal for employers and businesses to discriminate based on race, color, religion, or nationality. Though the articles outlined in the Civil Rights Act have been the law of the land for nearly 60 years, to this day, the legacy of centuries of state-sanctioned racism remains evident across the United States.
In the broad scope of American history, the South is associated with the most overt racial oppression. However, racist policies have shaped the economic and social structures across the country, including in Northeastern and Midwestern states. (Here is a look at the worst states for Black Americans.)
Policies such as redlining, which effectively excluded Black Americans from buying property in certain neighborhoods and school districts, were commonly employed in cities across the country. Not explicitly prohibited in the Civil Rights Act, housing discrimination was eventually outlawed under the Fair Housing Act of 1968. Still, access to housing and education can have a demonstrable impact on families for generations.
According to data from the U.S. Census Bureau’s 2021 American Community Survey, Black Americans are more than twice as likely to live below the poverty line as white Americans. Black households earn about 63 cents for every dollar earned by white households, the Black unemployment rate of 9.2% is double the white unemployment rate of 4.6%, and the Black homeownership rate of 47.7% is well below the 70.6% rate among the white population. As staggering as these disparities are, in many major metropolitan areas across the country, they are far worse than the national averages.
Using data – five-year averages – from the 2021 ACS, 24/7 Wall St. identified the 25 worst cities for Black Americans. To create this list, we used an index of eight variables measuring socioeconomic gaps between white and Black residents. Only the 225 U.S. metro areas where Black residents comprise at least 5% of the population were considered. It is important to note that this list does not rank the cities where Black Americans face the worst conditions, but rather the cities where the socioeconomic gaps between the white and Black populations are the largest.
Of the 25 metro areas on this list, 15 are in Midwestern states, and nine are in the Northeast. Only one of these cities is in the West and none are located in the South. Practices such as redlining were commonplace in many of these cities in the 20th century, laying the groundwork for ongoing inequality that remains evident today. (Here is a look at the worst voting districts for Black Americans.)
Click here to see the worst cities for black Americans.
To determine the worst cities for Black Americans, 24/7 Wall St. created an index of eight variables measuring racial socioeconomic gaps in each of the nation’s 384 metropolitan areas. For each city we evaluated the gap between white and Black residents in poverty, high school and college education, income, homeownership, unemployment, mortality, and incarceration.
Creating the index in this way means cities are ranked based on the relative differences between Black and white residents and not on absolute levels of socioeconomic development, which, if used for the ranking, would result in a list of cities with the worst social and economic measures for Black residents. Our aim, rather, was to rank cities where the differences between Black and white residents are most pronounced.
For each measure, we constructed an index of the gaps between Black and white Americans. The index was standardized using min-max normalization.
We excluded metro areas where Black residents comprise less than 5% of the population or where data limitations made comparisons between racial groups impossible.
Within the index, we considered data from the U.S. Census Bureau’s 2021 American Community Survey on median household income, poverty, adult high school and bachelor’s degree attainment, homeownership, and unemployment for each racial group. All ACS data are five-year estimates for 2021, the most recent year available.
Data on the number of prisoners in state or federal correctional facilities within a state by race are for 2020 and came from the Bureau of Justice Statistics. These figures were adjusted for population using ACS data. Because states, rather than metro areas, are responsible for the prison population, incarceration rates are for the state where the metro area is located. If a metro area spans more than one state, we used the state in which the metro area’s principal city is located.
We also included mortality rates for the years 2019 to 2021 from the Centers For Disease Control and Prevention. We aggregated mortality rates from the county to the metropolitan level using boundary definitions from the Census Bureau. Incarceration and mortality rates are per 100,000 residents.
25. Bridgeport-Stamford-Norwalk, CT
> Black population: 102,309 (10.7% of total)
> Median household income: $62,128 (Black); $116,664 (white)
> Homeownership rate: 42.0% (Black); 74.7% (white)
> Unemployment rate: 8.5% (Black); 5.7% (white)
> Poverty rate: 15.6% (Black); 6.2% (white)
Of the nearly 1 million residents of the Bridgeport metro area in Connecticut, a little over one in every 10 are Black. Social and economic disparities between white and Black populations in the metro area are among the worst in the country. The poverty rate among Bridgeport’s Black population is 15.6%, more than double the white poverty rate of 5.7%. Similarly, the typical white household in the metro area earns $116,664 a year, nearly double the median income among Black households of $62,128.
Though Bridgeport is the only metro area in Connecticut to rank on this list, racial disparities are not limited to the metro area and are perhaps most pronounced in law enforcement statistics. Black Connecticut residents, for example, are more than 10 times as likely as white residents to be incarcerated.
[in-text-ad]
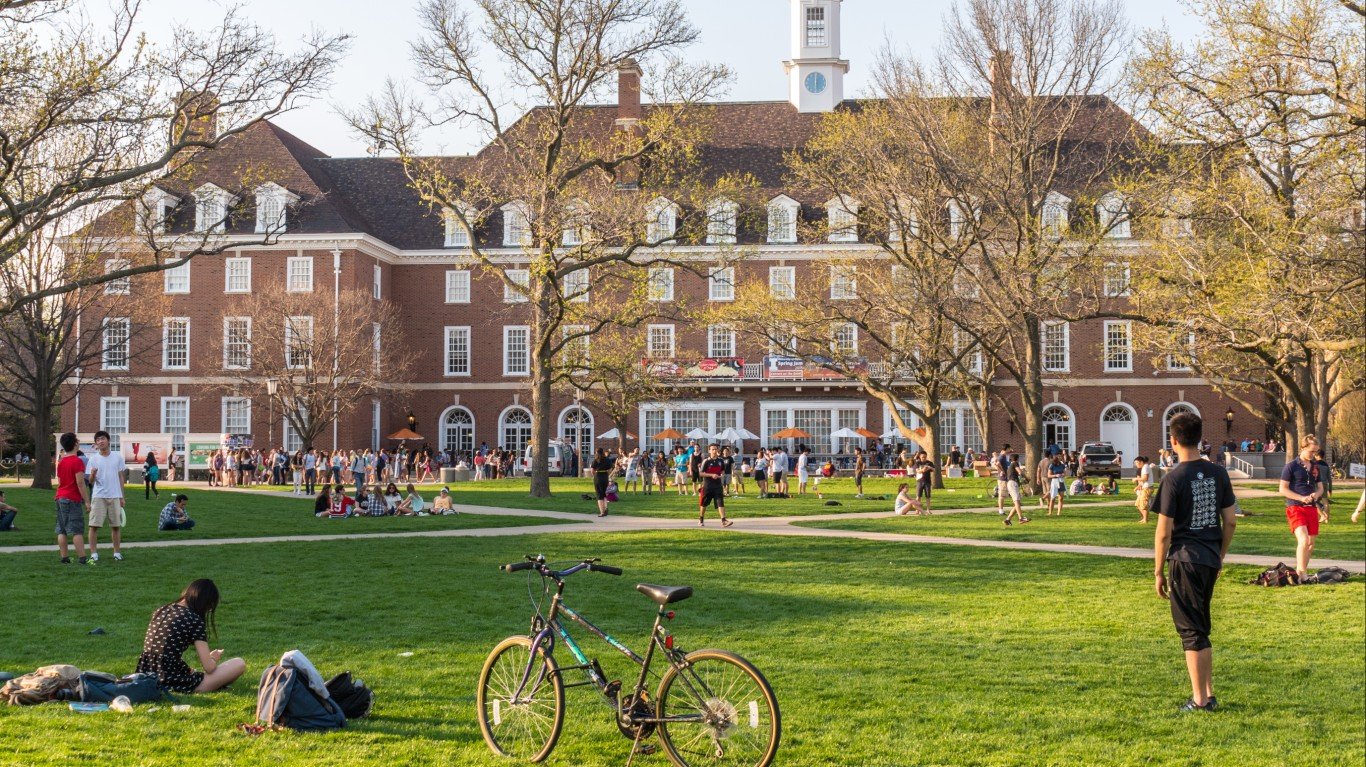
24. Champaign-Urbana, IL
> Black population: 26,808 (12.0% of total)
> Median household income: $33,791 (Black); $68,373 (white)
> Homeownership rate: 23.6% (Black); 65.1% (white)
> Unemployment rate: 12.5% (Black); 4.0% (white)
> Poverty rate: 26.1% (Black); 13.0% (white)
Champaign-Urbana is one of five metro areas in Illinois – and one of 15 across the Midwest – to rank among the worst places for Black Americans. The unemployment rate among white workers in the metro area is only 4.0% compared to 12.5% among Black workers. Racial disparities in the job market likely exacerbate financial inequality. The typical Black household earns just $33,791 a year, less than half the median income among white households of $68,373. Additionally, Black residents are twice as likely as white residents to live below the poverty line.
As is the case in most cities on this list, racial disparities in Champaign-Urbana are rooted in the area’s history of racial segregation. Racist housing covenants in the early to mid-20th century forced Black families into isolated communities in the city’s North End. These policies not only reduced economic opportunities for Black residents, but also educational opportunities as they effectively limited Black enrollment at the University of Illinois. Today, only 22.8% of Black adults in the metro area have a bachelor’s degree, compared to 43.4% of white adults.
[recirclink id=1042926]
23. Decatur, IL
> Black population: 16,844 (16.1% of total)
> Median household income: $30,176 (Black); $61,275 (white)
> Homeownership rate: 33.2% (Black); 76.4% (white)
> Unemployment rate: 18.9% (Black); 5.6% (white)
> Poverty rate: 33.2% (Black); 11.0% (white)
Black residents of Decatur, Illinois, are three times as likely as white area residents to live in poverty. Income inequality is also stark. The median income among Black area households is just $30,176 a year, less than half the median income among white households of $61,275. Homeownership is one of the most practical ways to build wealth in the U.S. In Decatur, the Black homeownership rate of 33.2% is less than half the 76.4% white homeownership rate.
The economic disparities in the metro area are likely linked to the educational attainment rate differences as schools in the metro area are becoming increasingly segregated. The Decatur Public School district lost 38% of its white student body in the 15 years ending in 2019, and currently, only 85.8% of Black adults have a high school diploma compared to 93.1% of white adults in the area. Disparities in rates of higher education are even more pronounced, as 24.8% of local white adults have a bachelor’s degree or higher, compared to 15.1% of Black adults.
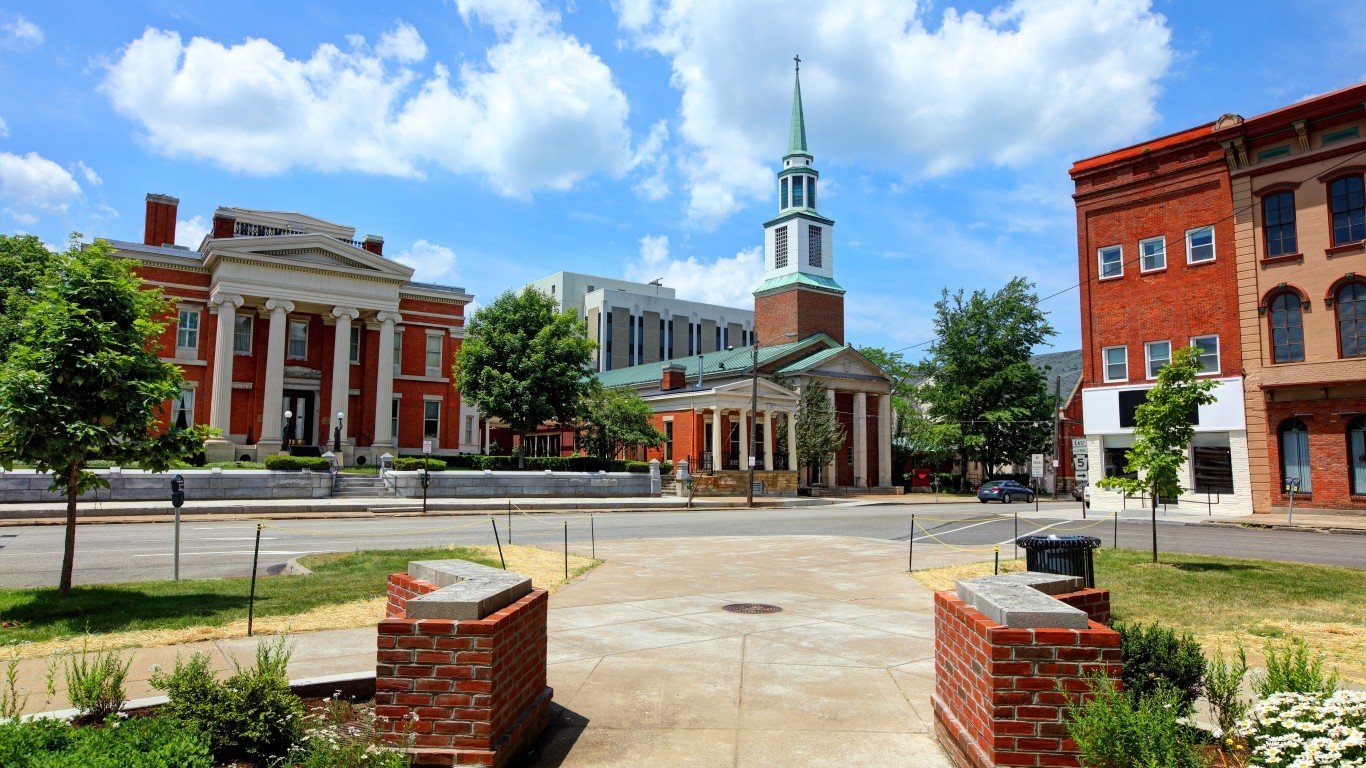
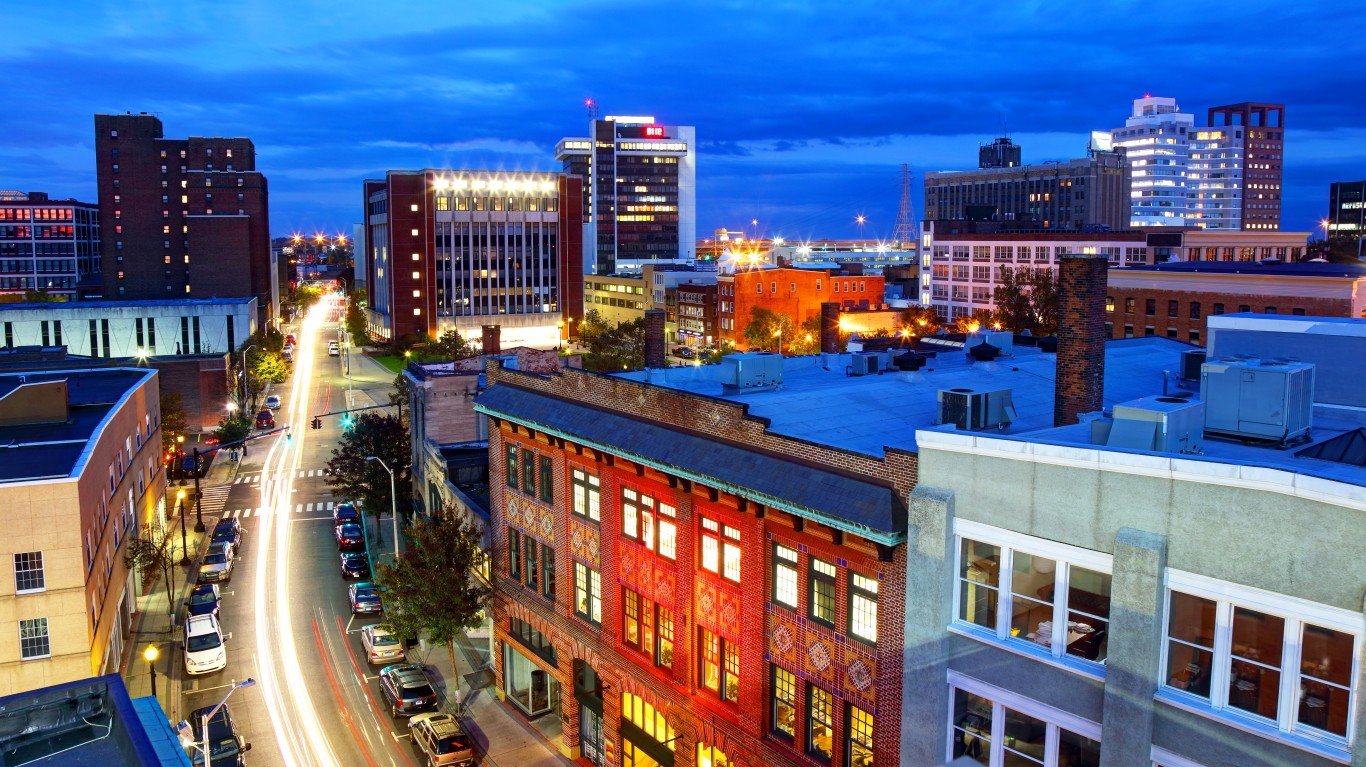
22. Erie, PA
> Black population: 18,138 (6.7% of total)
> Median household income: $25,448 (Black); $59,546 (white)
> Homeownership rate: 32.5% (Black); 71.2% (white)
> Unemployment rate: 9.3% (Black); 5.2% (white)
> Poverty rate: 37.0% (Black); 12.9% (white)
Erie is the only Pennsylvania metro area to rank among the worst places for Black Americans. Erie’s ranking on this list is due largely to economic inequality, as the city’s Black poverty rate of 37.0% is well more than double the 12.9% white poverty rate. The far greater likelihood of serious financial hardship for Erie’s Black residents is partially due to limited economic opportunity. Erie’s Black unemployment rate of 9.3% far exceeds the 5.2% white jobless rate.
Like many industrial cities in the Northeast and Midwest, racist housing policies ensured that Erie was a segregated city for much of the 20th century. Before a desegregation plan went into effect in 1975, six Erie schools were at least 80% Black, and 16 local schools were at least 80% white. Segregated schools are inherently unequal, and today, less than 82% of Black adults in the area have a high school diploma, compared to over 93% of white adults.
[in-text-ad-2]

21. Omaha-Council Bluffs, NE-IA
> Black population: 70,581 (7.4% of total)
> Median household income: $40,874 (Black); $77,933 (white)
> Homeownership rate: 32.0% (Black); 70.5% (white)
> Unemployment rate: 8.8% (Black); 3.0% (white)
> Poverty rate: 22.7% (Black); 7.3% (white)
The 20th century history of Omaha, Nebraska, is defined, in part, by racist housing policies that resulted in segregated neighborhoods and segregated schools. Largely isolated to the north side of the city, Black Omaha residents were restricted in the homes they could buy and jobs they could take, placing them at a multi-generational disadvantage that remains evident today. The homeownership rate among white Omaha residents is more than double the Black homeownership rate, and Black area residents are about three times more likely to live below the poverty line than white residents.
Though Omaha complied with federal desegregation policies in the middle of last century, the city has grown increasingly segregated by race once again in recent years as white families move out. There were 16,286 white students in the Omaha Public School District in 2012. As of 2021, there were only about 12,000. An estimated 1,600 white students left the district during the pandemic.
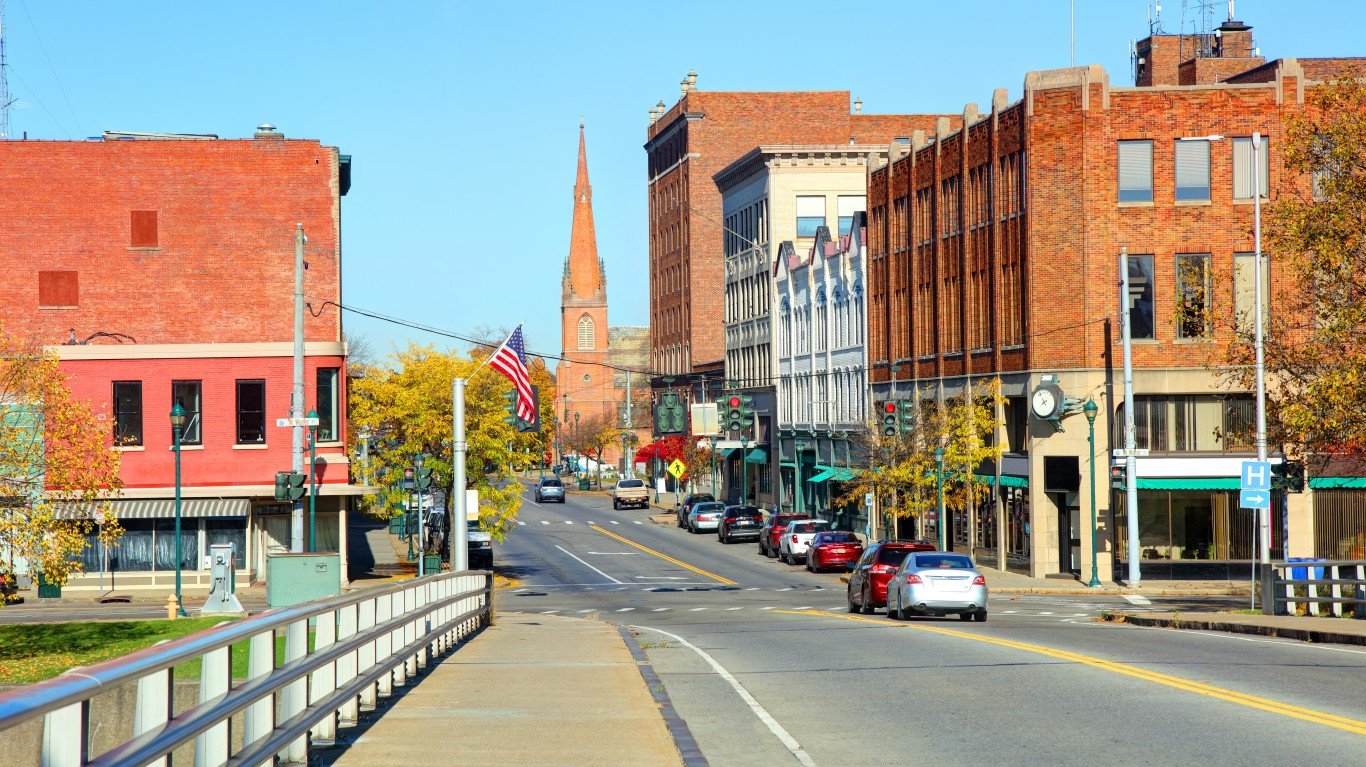
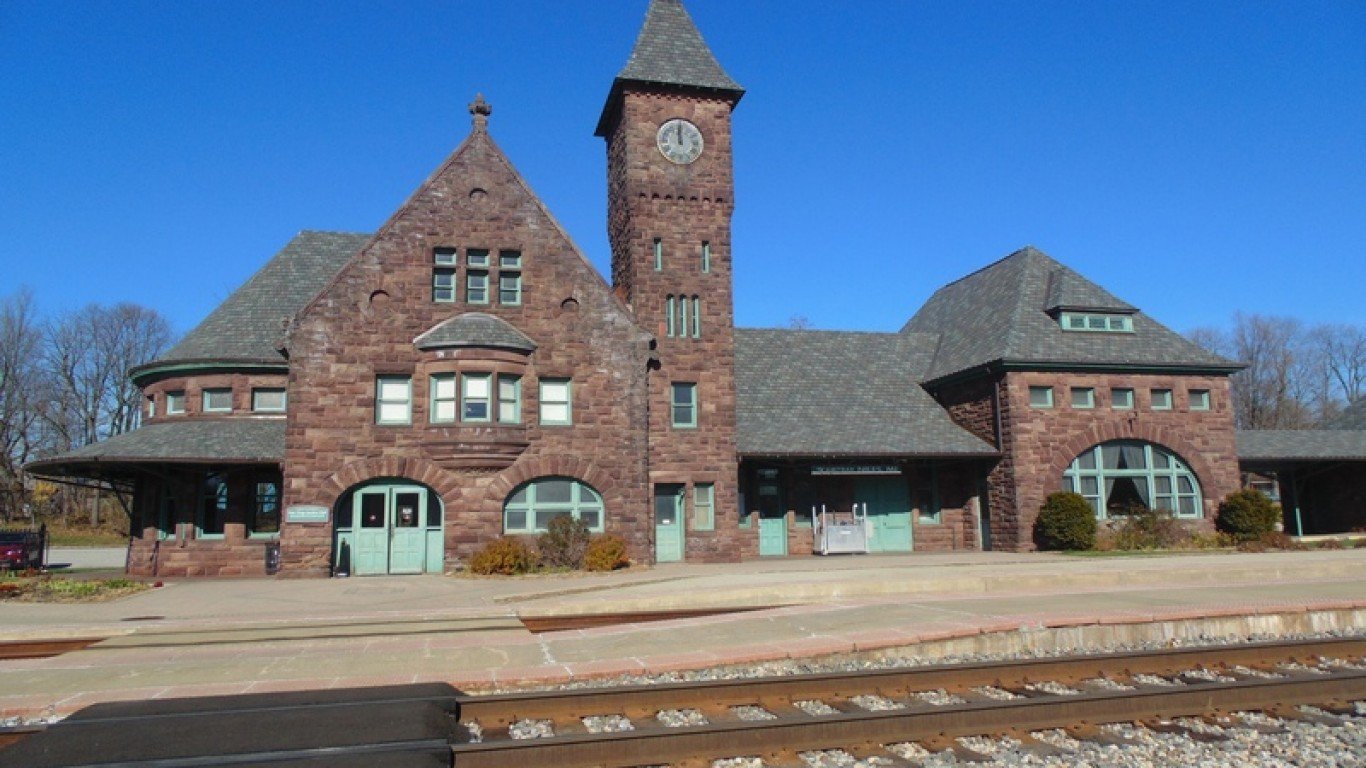
20. Elmira, NY
> Black population: 4,887 (5.8% of total)
> Median household income: $30,440 (Black); $59,858 (white)
> Homeownership rate: 32.2% (Black); 71.2% (white)
> Unemployment rate: 6.1% (Black); 6.0% (white)
> Poverty rate: 31.1% (Black); 12.6% (white)
Elmira, New York, has some of the worst disparities in educational attainment along racial lines in the country. Only about 67% of Black adults in the metro area have a high school diploma, compared to nearly 92% of white adults in the area. White adults in Elmira are also more than twice as likely as Black adults in the area to have a bachelor’s degree.
The area’s educational disparities have likely greatly contributed to the area’s economic disparities. The typical Black household in Elmira earns just $30,440 a year, and 31.1% of Black Elmira residents live below the poverty line. Meanwhile, the median household income among the metro area’s white population is nearly double at $59,858, and only 12.6% of the local white population live below the poverty line.
[in-text-ad]
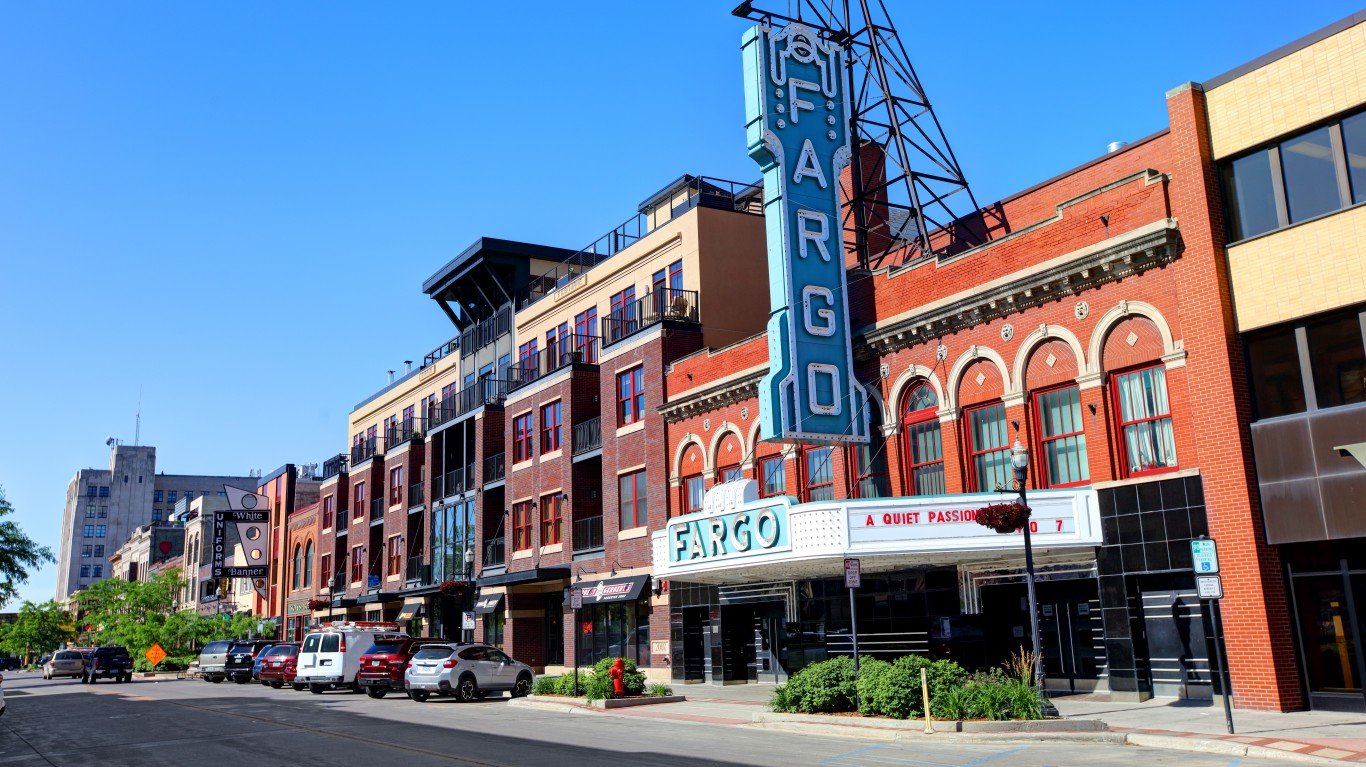
19. Fargo, ND-MN
> Black population: 14,086 (5.7% of total)
> Median household income: $33,922 (Black); $73,368 (white)
> Homeownership rate: 5.3% (Black); 61.2% (white)
> Unemployment rate: 11.9% (Black); 2.7% (white)
> Poverty rate: 37.1% (Black); 8.7% (white)
The Fargo metro area, located in eastern North Dakota and extending into parts of Minnesota, is home to about about half a million people. For the metro area’s 14,000 Black residents, economic conditions are far worse than they are for the white residents. The homeownership rate among the local Black population is just 5.3%, a fraction of the 61.2% white homeownership rate. Owning a home is a practical way to build wealth, and in Fargo, the Black poverty rate of 37.1% is more than four times the 8.7% white poverty rate.
Economic disparities are exacerbated by inequality in the job market. The unemployment in Fargo is nearly 12% among Black workers, while it is less than 3% among the local white labor force.
[recirclink id=1048284]
18. Buffalo-Cheektowaga, NY
> Black population: 131,997 (11.4% of total)
> Median household income: $36,162 (Black); $68,467 (white)
> Homeownership rate: 36.7% (Black); 72.5% (white)
> Unemployment rate: 9.8% (Black); 4.5% (white)
> Poverty rate: 27.4% (Black); 9.2% (white)
Buffalo’s nearly 132,000 Black residents are far more likely to be economically disadvantaged than their white neighbors. The Black unemployment rate in the western New York metro area is nearly 10%, more than double the 4.5% unemployment rate among the local white labor force.
With widespread unemployment, Black residents are far more likely to be struggling financially than Buffalo’s white population. The typical Black metro area household earns just $36,162 a year, well below the median income of $68,467 among white households. Additionally, more than one in every four Black Buffalo residents live in poverty, compared to fewer than one in every 10 white residents.
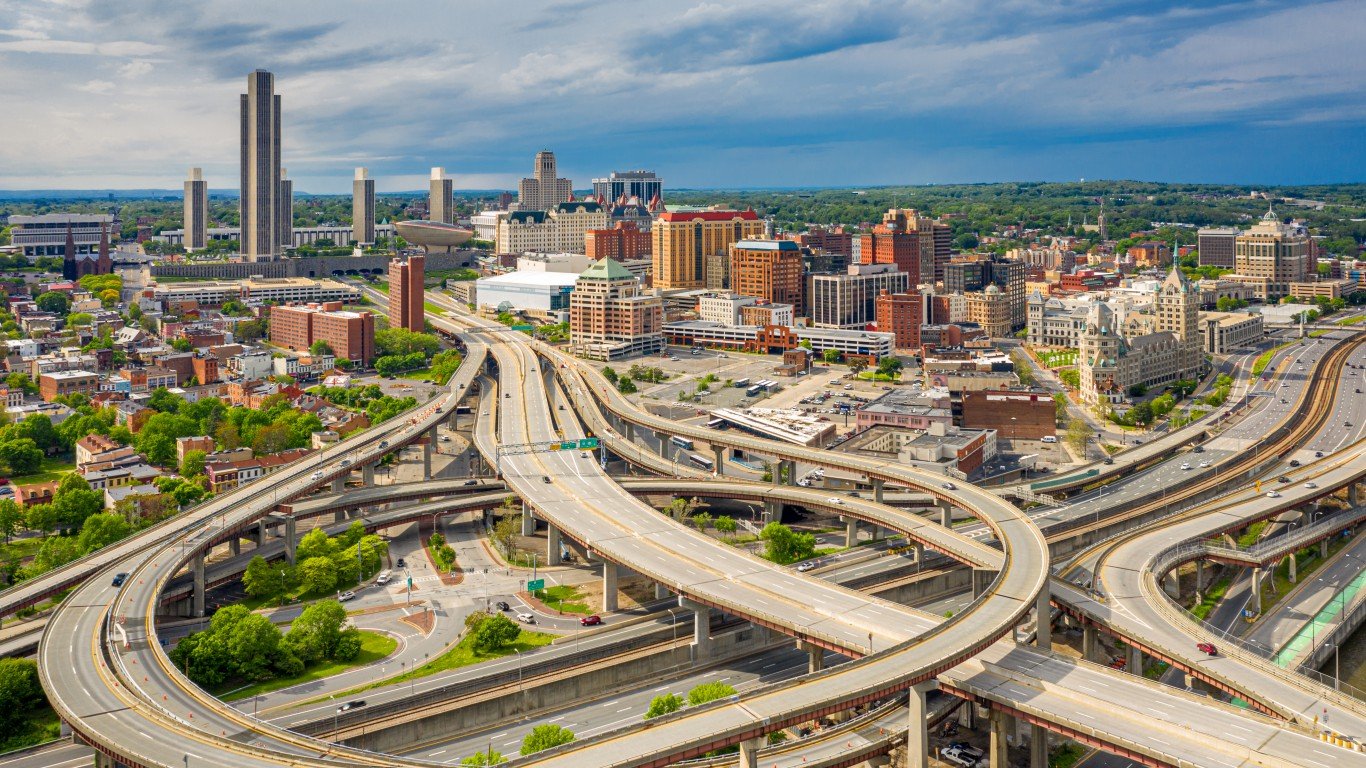
17. Albany-Schenectady-Troy, NY
> Black population: 64,408 (7.2% of total)
> Median household income: $42,220 (Black); $81,872 (white)
> Homeownership rate: 25.5% (Black); 69.1% (white)
> Unemployment rate: 10.8% (Black); 4.2% (white)
> Poverty rate: 26.3% (Black); 7.8% (white)
The region that includes New York’s capital is one of five metro areas in the state to rank among the worst places for Black Americans. The metro area, which includes the cities of Albany, Schenectady, and Troy, has some of the most pronounced racial disparities in the country. The typical Black household, for example, earns less than $43,000 a year. Meanwhile, most white area households earn over $81,000 a year. Black area residents are also more than three times as likely to live below the poverty line than whites.
Financial inequality in the Albany metro area is partially a product of inequality in the job market, as the local Black unemployment rate of 10.8% is more than double the 4.2% white jobless rate.
[in-text-ad-2]
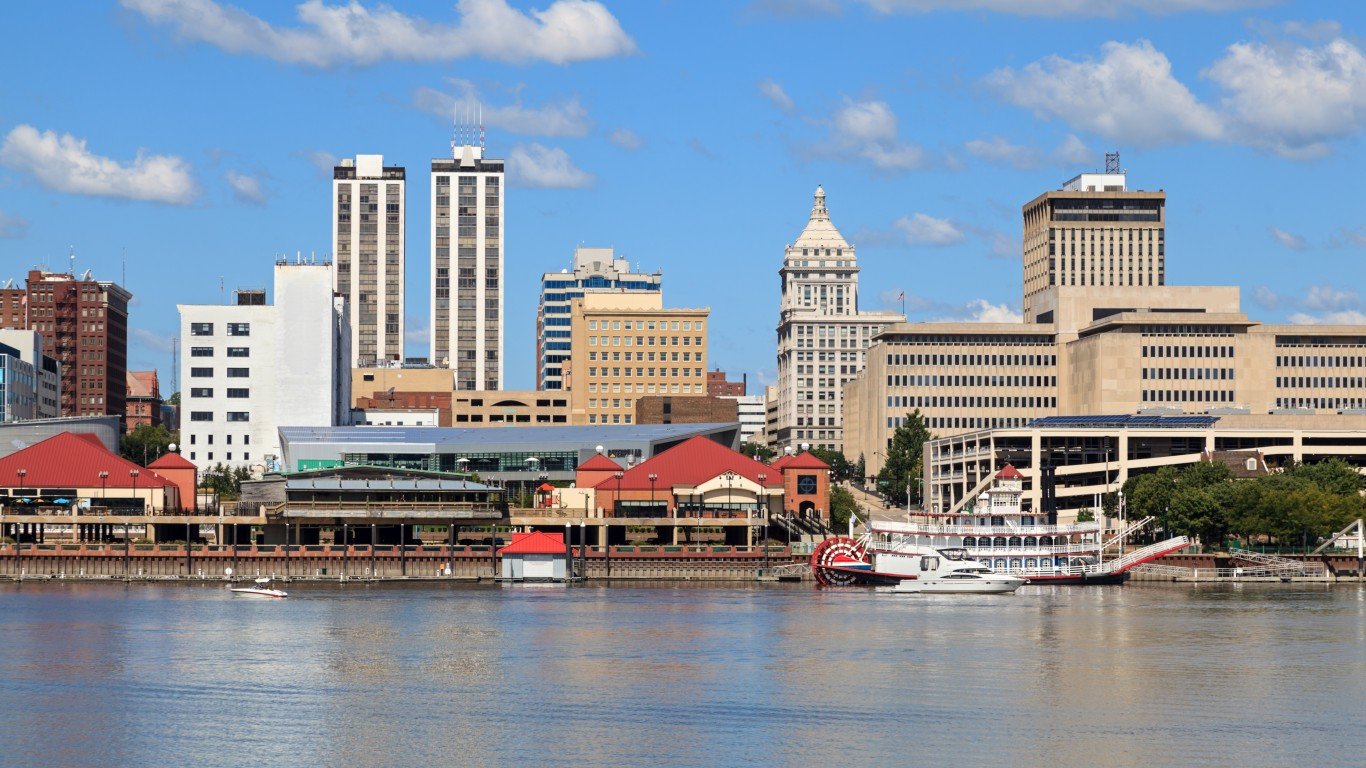
16. Peoria, IL
> Black population: 35,422 (8.8% of total)
> Median household income: $31,823 (Black); $64,932 (white)
> Homeownership rate: 35.0% (Black); 76.0% (white)
> Unemployment rate: 15.6% (Black); 4.5% (white)
> Poverty rate: 33.4% (Black); 9.7% (white)
Segregated schools can breed inequality that crosses generations, and to this day, Peoria, Illinois, has one of the most segregated school systems in the United States. Only about 83% of Black adults in the Peoria metro area have a high school diploma, and less than 15% have a bachelor’s degree. Among white adults in the area, the high school diploma attainment rate stands at about 94%, while the bachelor’s degree attainment rate is nearly 30%.
Higher educational attainment can open the door to new job opportunities and increase earning potential. In Peoria, the Black unemployment rate of 15.6% is more than three times the 4.5% white jobless rate. Additionally, the median income among local Black households of $31,823 is less than half the $64,932 median white household income.
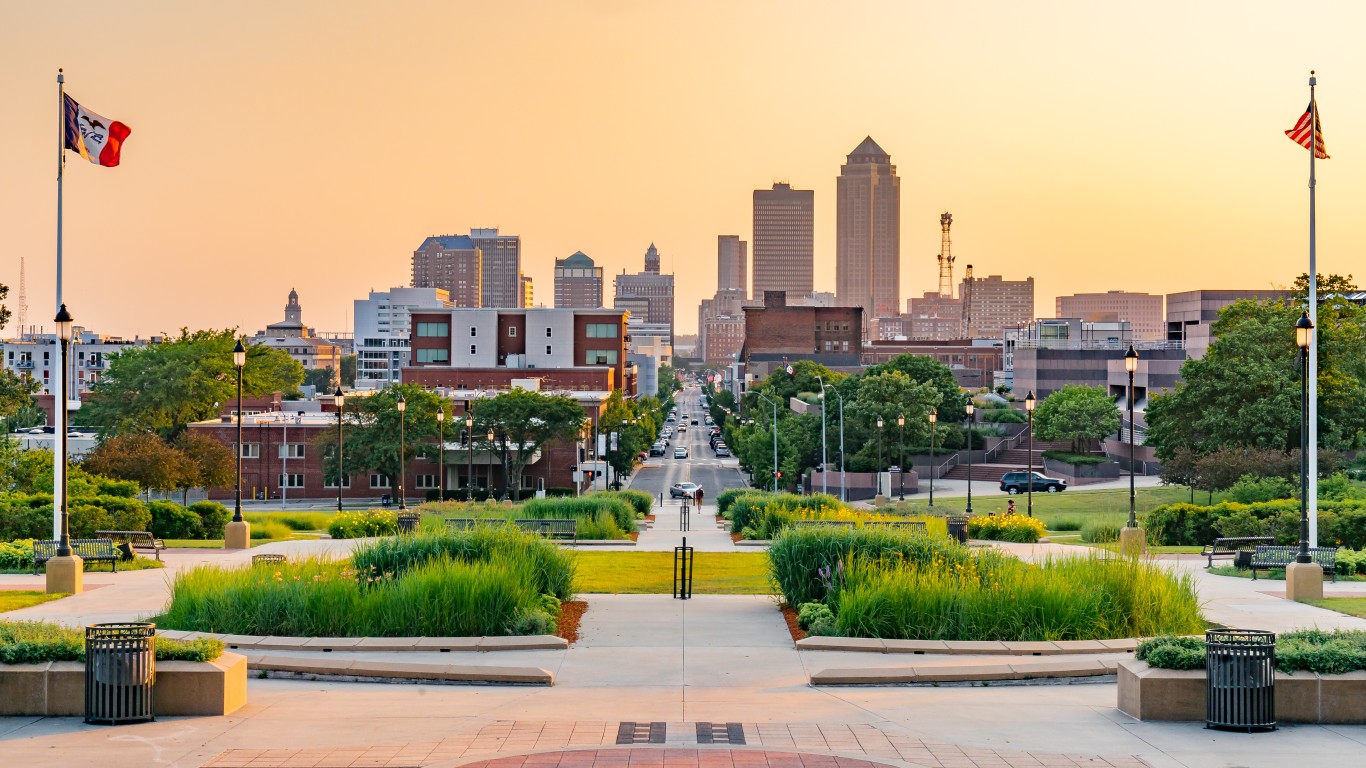
15. Des Moines-West Des Moines, IA
> Black population: 37,423 (5.3% of total)
> Median household income: $43,754 (Black); $78,090 (white)
> Homeownership rate: 29.2% (Black); 72.9% (white)
> Unemployment rate: 8.9% (Black); 3.6% (white)
> Poverty rate: 29.4% (Black); 7.0% (white)
Nearly 84% of Iowa’s population is white, the largest such share of any state in the Midwest, and Des Moines is one of two metro areas in the state to rank on this list. One of many Midwestern cities to become heavily segregated in the 20th century by a practice known as redlining, Black Des Moines residents were only allowed into economically isolated and undesirable neighborhoods for decades. Homeownership is one of the most practical ways to build intergenerational wealth in the U.S., and today, Des Moines’ Black homeownership rate is less than 30%, a fraction of the 72.9% white homeownership rate.
The segregation extends into education and translates to education disparities, including higher education. Children with college-educated parents are more likely to attend college themselves, and in Des Moines, 39% of white adults have a bachelor’s degree or higher, compared to just under 21% of Black adults.
[in-text-ad]

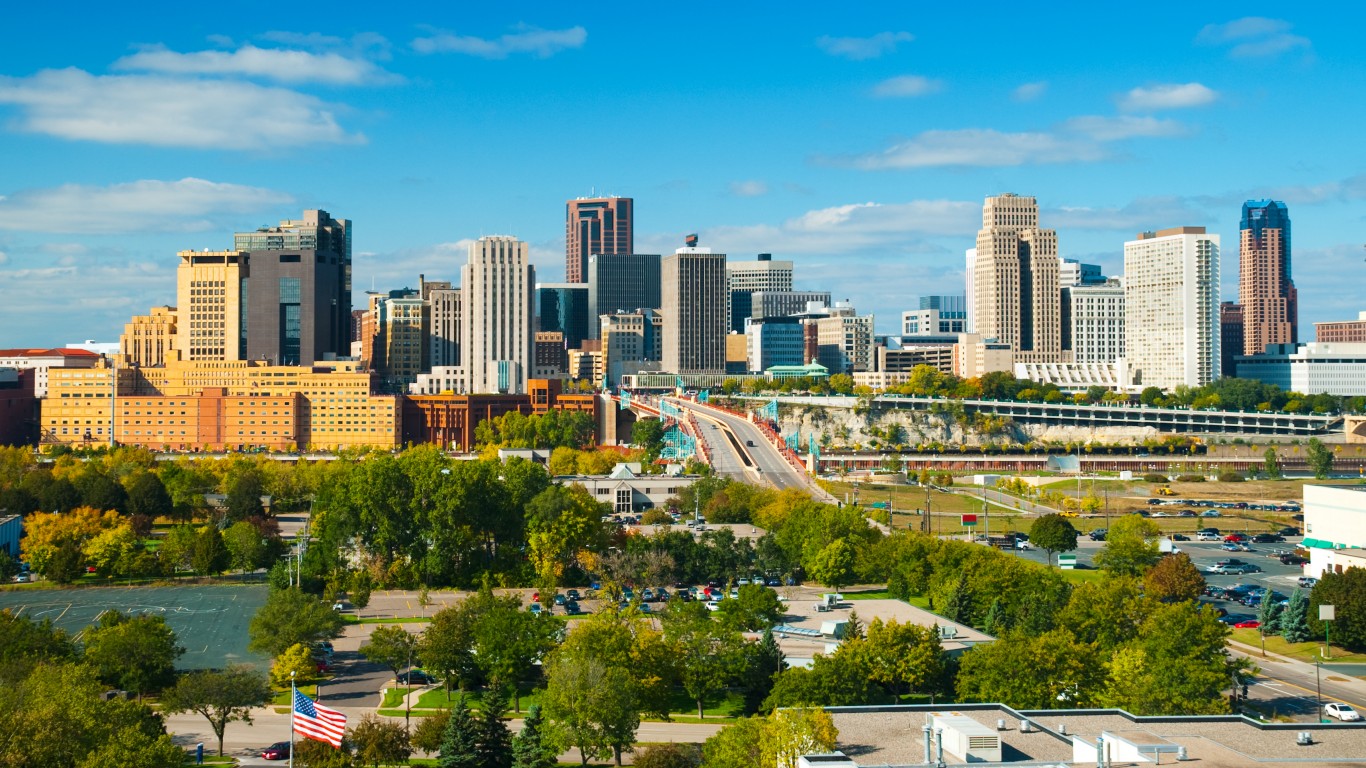
14. Minneapolis-St. Paul-Bloomington, MN-WI
> Black population: 316,875 (8.7% of total)
> Median household income: $45,847 (Black); $93,019 (white)
> Homeownership rate: 28.8% (Black); 76.4% (white)
> Unemployment rate: 8.2% (Black); 3.3% (white)
> Poverty rate: 23.1% (Black); 5.6% (white)
Until exclusionary, racist housing policies were put into place around 1910, Minneapolis was not an especially segregated city. Since then, Black area residents were excluded from owning property in much of the Twin Cities area, and Minneapolis has grown markedly segregated. Without access to real estate in the most desirable neighborhoods, Black families in the metro area have been limited in their ability to build intergenerational wealth. Today, the Black homeownership rate in the area is just 28.8%, a fraction of the 76.4% white homeownership rate.
Employment opportunities in the Minneapolis area today appear far more limited for Black workers than for white workers. Only 3.3% of the local white labor force are unemployed, compared to 8.2% of the Black labor force.
[recirclink id=1140166]
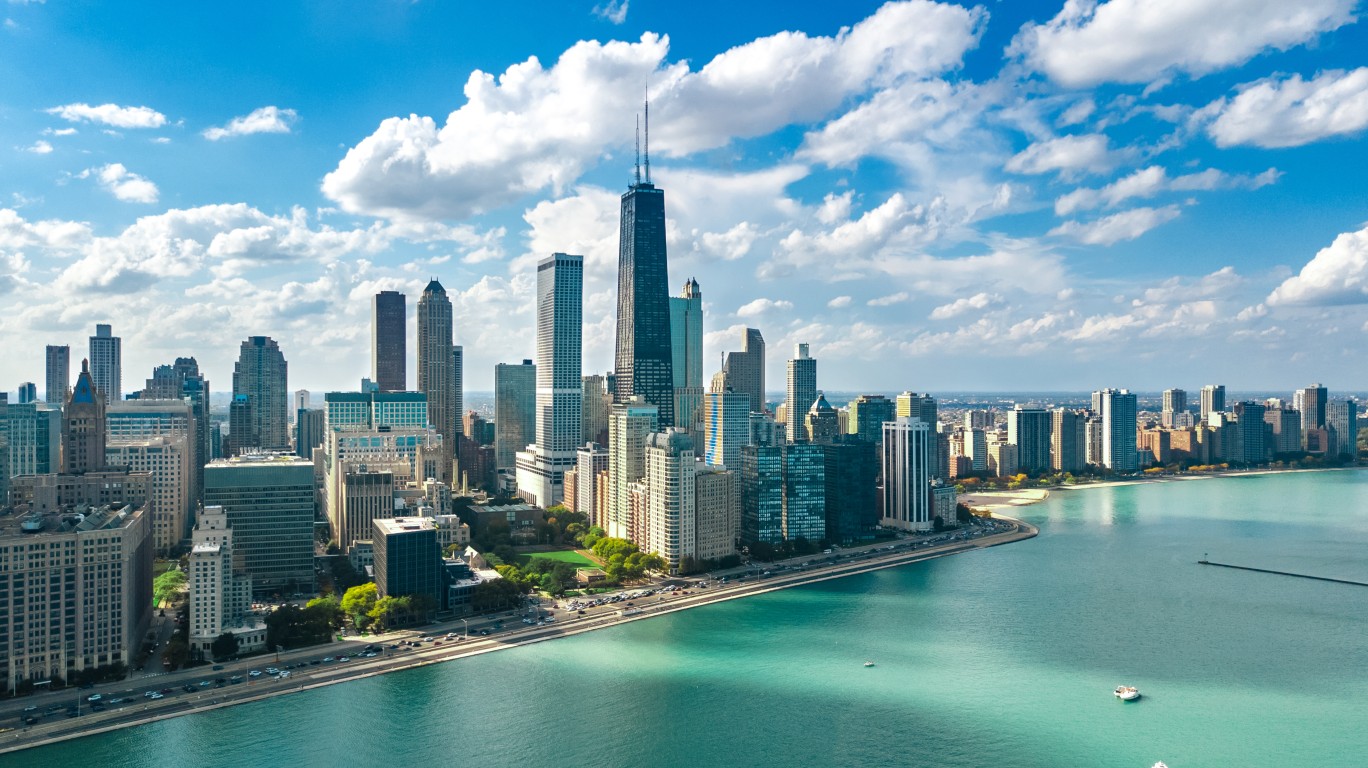
13. Chicago-Naperville-Elgin, IL-IN-WI
> Black population: 1,543,227 (16.1% of total)
> Median household income: $45,417 (Black); $89,816 (white)
> Homeownership rate: 41.2% (Black); 73.2% (white)
> Unemployment rate: 13.7% (Black); 4.8% (white)
> Poverty rate: 23.2% (Black); 7.5% (white)
Chicago is one of the most segregated cities in the United States. Due to the process of redlining, Black Chicago residents were isolated to specific parts of the city, and today, the city’s predominantly Black neighborhoods remain isolated in the city’s South Side and West Side and suffer from high crime rates and limited economic opportunity. Unemployment among the metro area’s Black population is 13.7%, well above the 4.8% white unemployment rate. Due to these conditions, an estimated 400,000 Black residents have left Chicago since 1980.
The stunted economic development in predominantly Black areas has been decades in the making, as investment has poured into more affluent white areas, bypassing majority-Black communities. The Black poverty rate of 23.2% in Chicago is more than three times the white poverty rate of 7.5%.
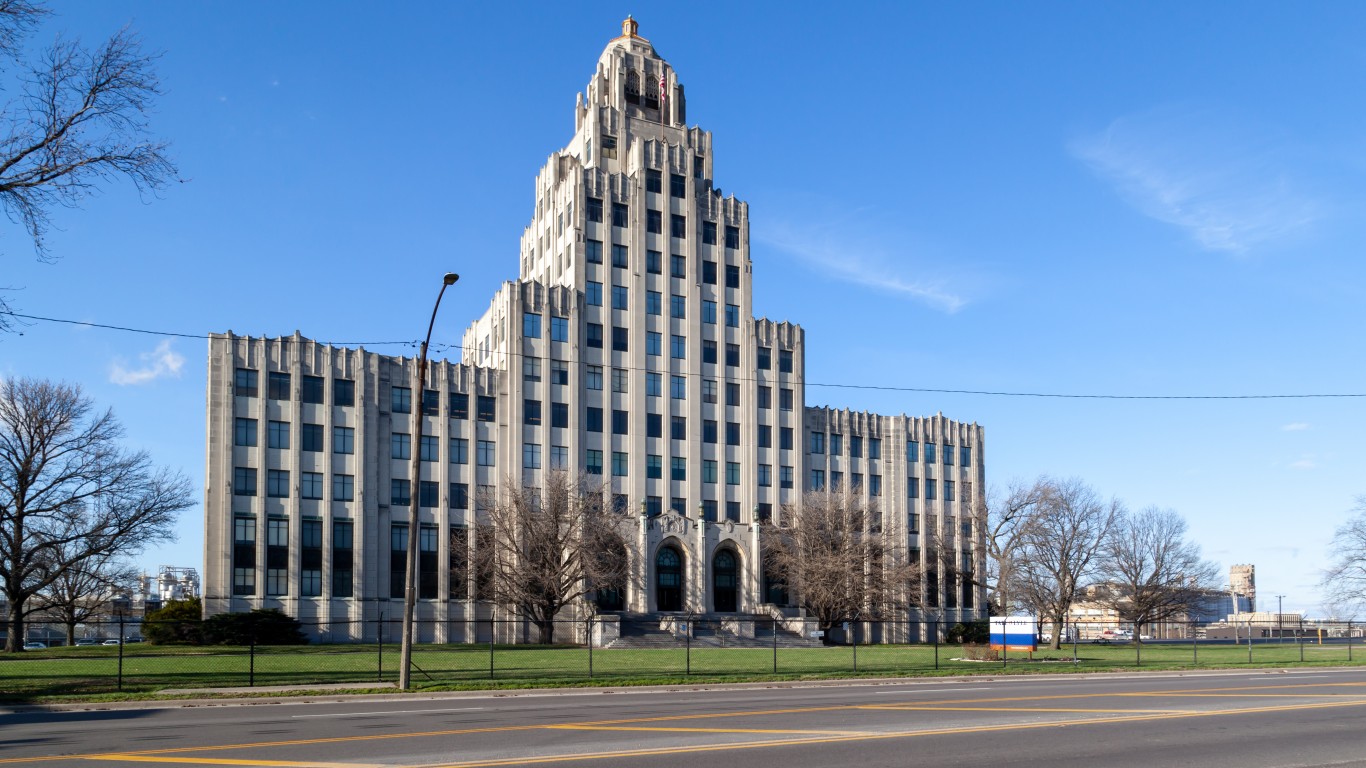
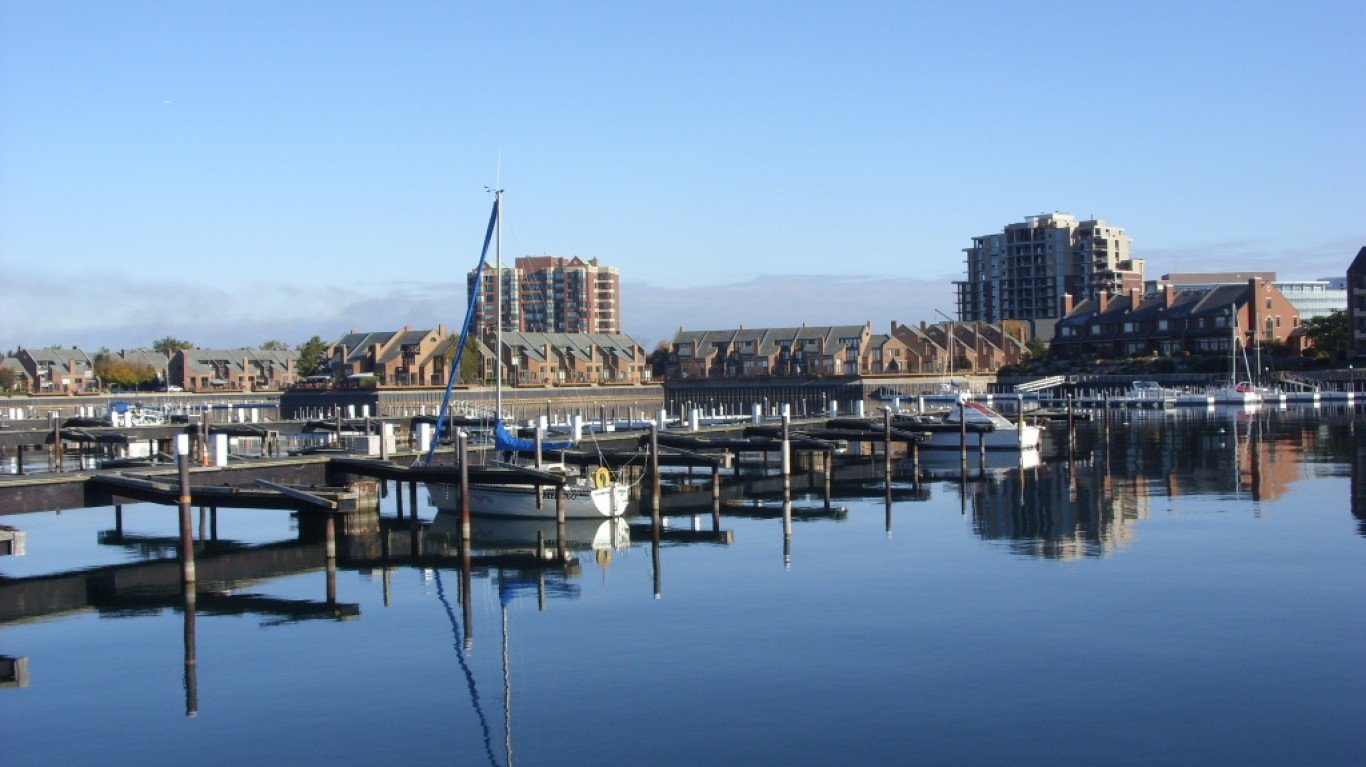
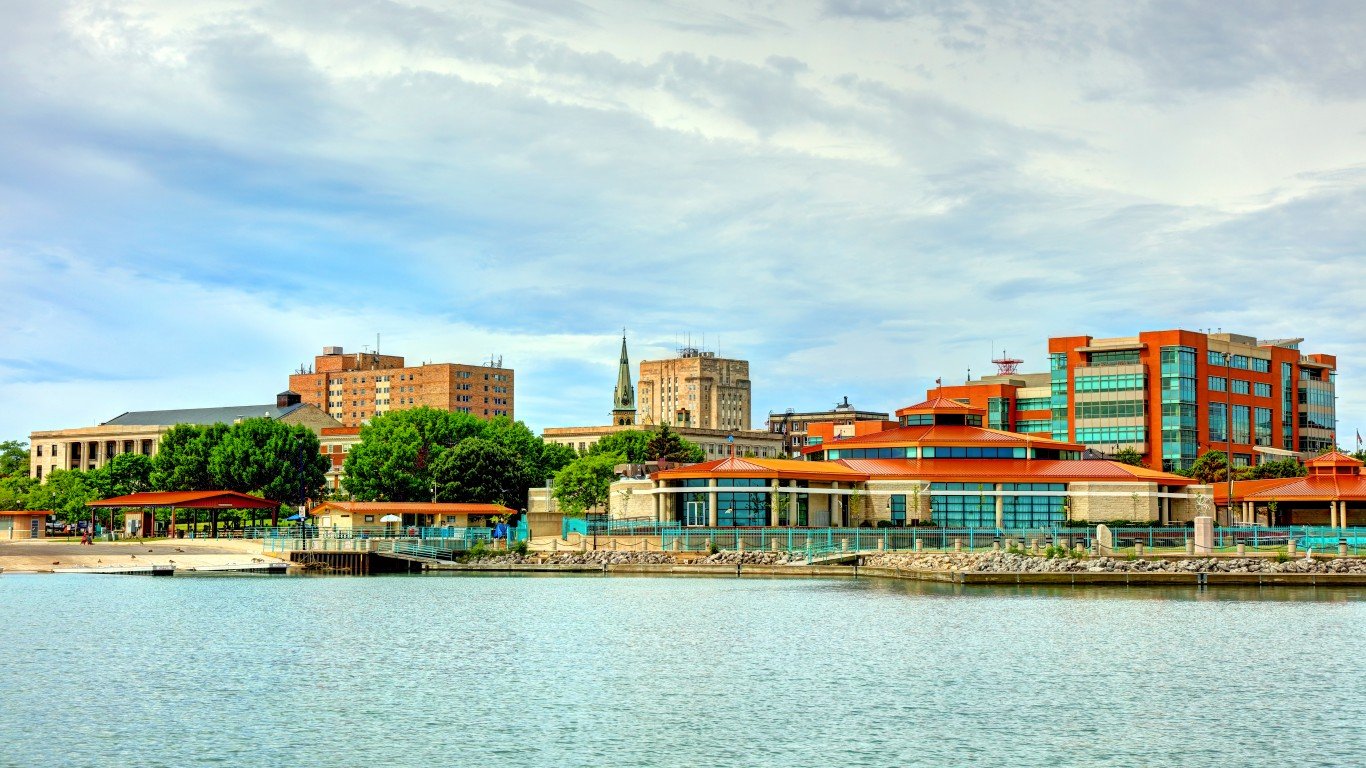
12. Niles, MI
> Black population: 21,463 (13.9% of total)
> Median household income: $26,033 (Black); $62,136 (white)
> Homeownership rate: 37.4% (Black); 78.2% (white)
> Unemployment rate: 15.4% (Black); 5.0% (white)
> Poverty rate: 39.5% (Black); 11.6% (white)
With a Black poverty rate of nearly 40% – over three times the 11.6% white poverty rate – Niles, Michigan, is the worst metro area in Michigan for Black Americans and the 12th worst nationwide. The widespread financial hardship among the area’s Black population is due in part to a lack of opportunity, as Black unemployment in Niles stands at 15.4%, more than triple the white unemployment rate of 5.0%.
Black Niles residents are also half as likely as white residents to own their own home in Niles, and the typical Black household earns just $26,033 a year, less than half the $62,136 median income among white households.
[in-text-ad-2]
11. Waterloo-Cedar Falls, IA
> Black population: 12,670 (7.5% of total)
> Median household income: $32,164 (Black); $64,847 (white)
> Homeownership rate: 31.5% (Black); 73.6% (white)
> Unemployment rate: 18.1% (Black); 3.4% (white)
> Poverty rate: 26.2% (Black); 11.7% (white)
Black and white residents of the Waterloo-Cedar Falls, Iowa, metro area face two starkly different realities. While only 3.4% of the metro area’s white labor force are unemployed, the local Black unemployment rate stands at a staggering 18.1%.
With limited economic opportunities, Black Waterloo-Cedar Falls residents are more than twice as likely to live below the poverty line as white residents, and the typical Black household earns just $32,164 a year, half of what the typical white household earns a year of $64,847.
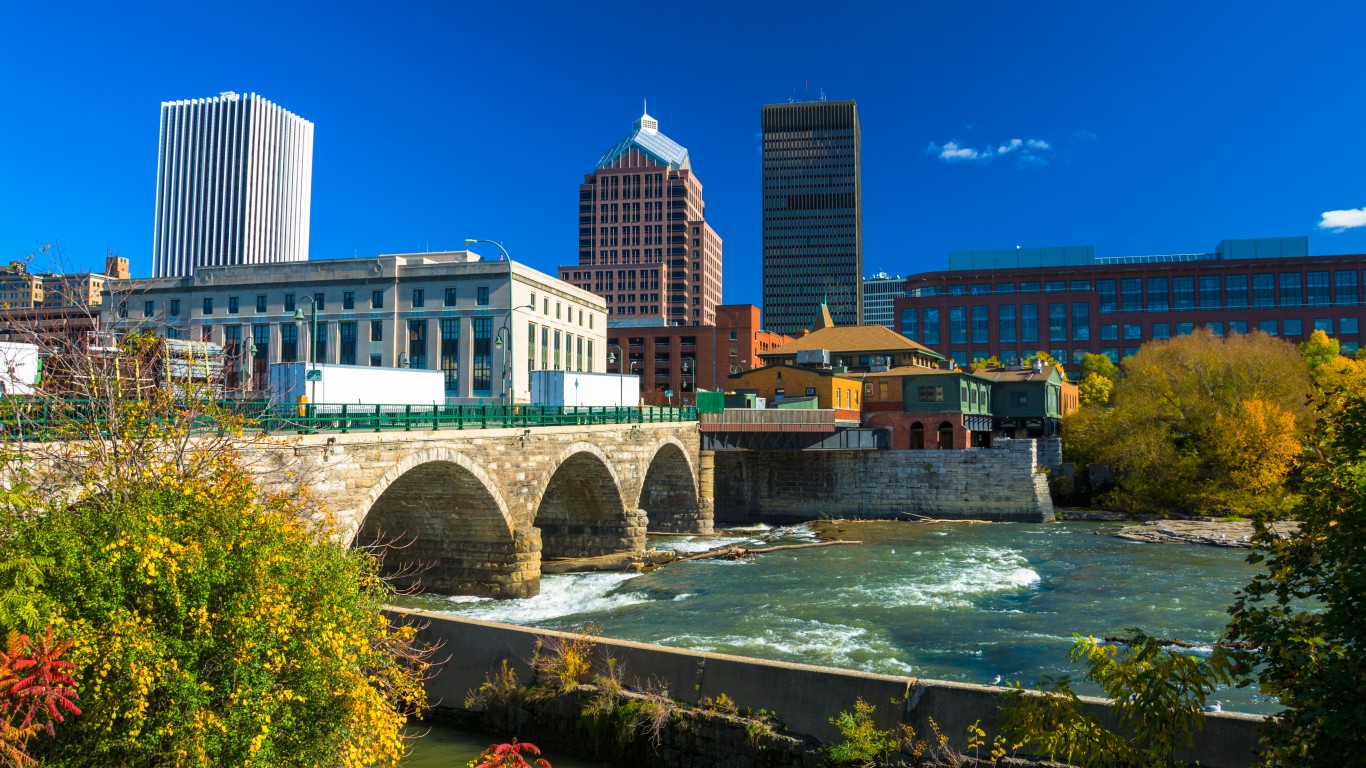
10. Rochester, NY
> Black population: 114,153 (10.5% of total)
> Median household income: $36,550 (Black); $71,182 (white)
> Homeownership rate: 33.5% (Black); 73.1% (white)
> Unemployment rate: 10.7% (Black); 4.1% (white)
> Poverty rate: 31.1% (Black); 9.4% (white)
Rochester ranks as the 10th worst city for Black Americans nationwide and the second worst in New York state. Racial disparities in Rochester are rooted in the city’s history of redlining, which isolated Black residents to specific neighborhoods. Today, the Black homeownership rate in the city is only 33.5%, less than half the 73.1% white homeownership rate.
Black Rochester residents are also more than three times as likely to live in poverty than white metro area residents and are twice as likely to be unemployed.
[in-text-ad]
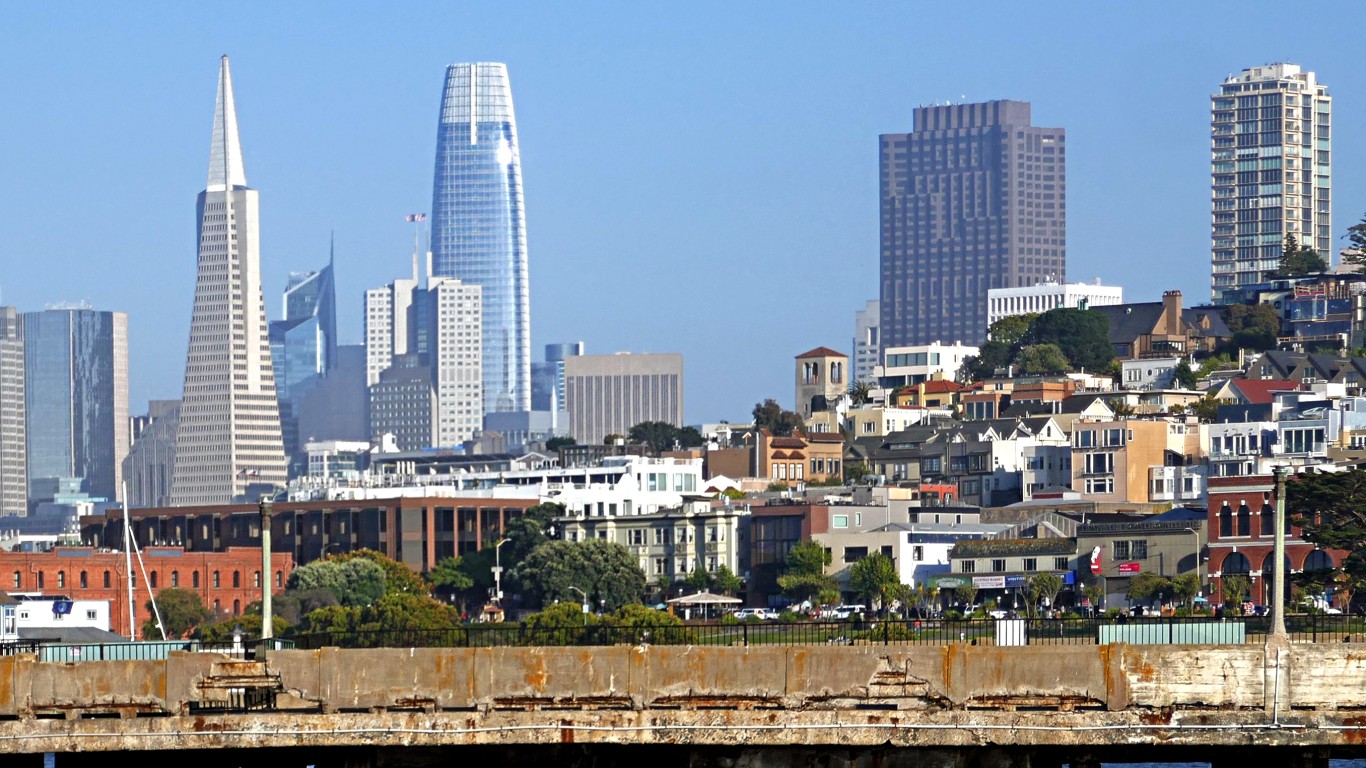
9. San Francisco-Oakland-Berkeley, CA
> Black population: 327,174 (6.9% of total)
> Median household income: $64,124 (Black); $132,631 (white)
> Homeownership rate: 35.3% (Black); 59.5% (white)
> Unemployment rate: 9.2% (Black); 4.8% (white)
> Poverty rate: 16.8% (Black); 6.5% (white)
The San Francisco-Oakland-Berkeley metro area is the only place in California to rank on this list. The typical Black household in the metro area earns $64,124 a year, more than the Black median income in the vast majority of U.S. metro areas, but considerably less than the local white median household income of $132,631 a year.
Incomes tend to rise with educational attainment, and across the metro area, 58.7% of the white adult population have a bachelor’s degree or higher, compared to 31.6% of the Black adult population.
[recirclink id=1144058]
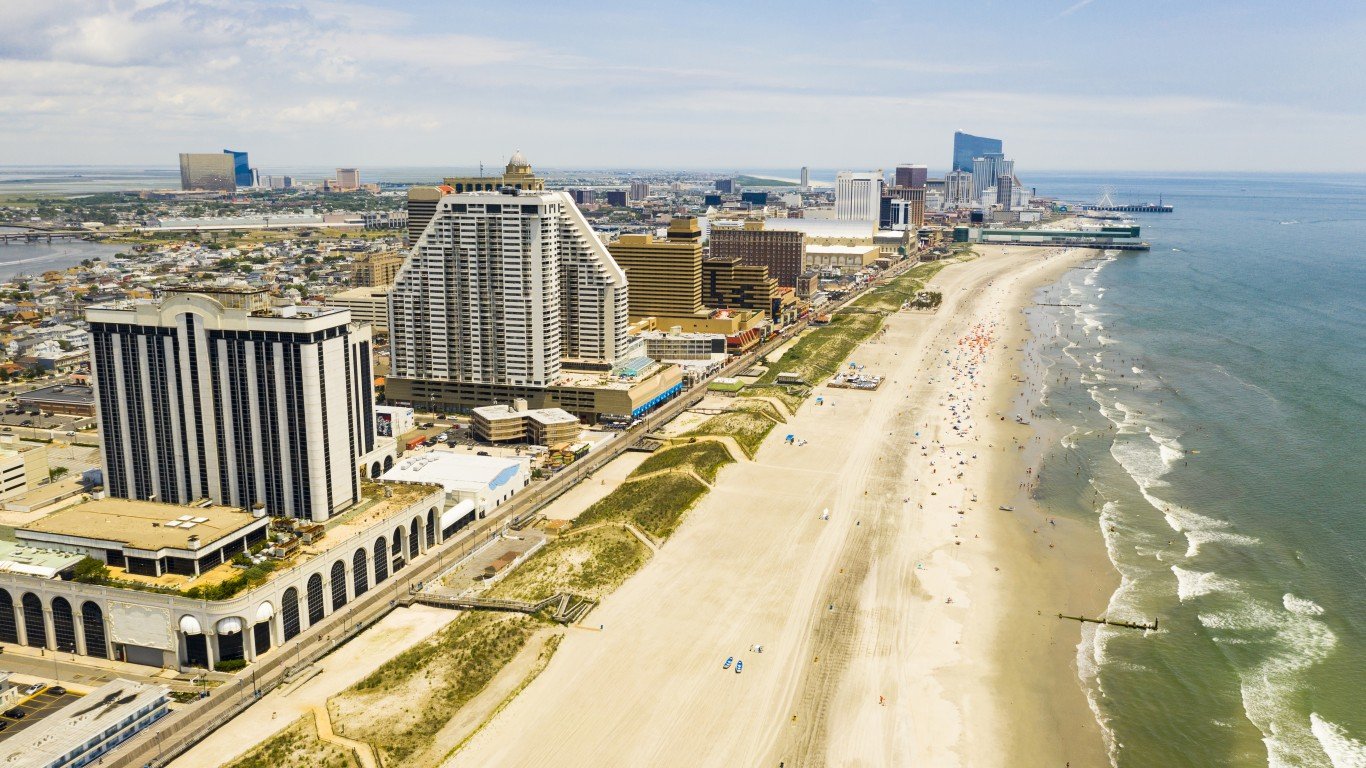
8. Atlantic City-Hammonton, NJ
> Black population: 36,194 (13.2% of total)
> Median household income: $40,128 (Black); $77,813 (white)
> Homeownership rate: 39.7% (Black); 76.4% (white)
> Unemployment rate: 11.3% (Black); 6.9% (white)
> Poverty rate: 23.8% (Black); 7.9% (white)
Atlantic City ranks as the second worst metro area in New Jersey for Black Americans and the eighth worst metro area nationwide. Atlantic City’s Black residents are about three times as likely as their white neighbors to live in poverty. Additionally, the typical Black metro area household earns just $40,128 a year, compared to the median income of $77,813 among local white households.
These income disparities are rooted in historical disadvantages Black Americans living in the metro area have faced as well as continued disparities. Black unemployment in Atlantic City stands at 11.3%, while only the white unemployment rate stands at 6.9%.

7. Syracuse, NY
> Black population: 51,247 (7.8% of total)
> Median household income: $34,120 (Black); $69,392 (white)
> Homeownership rate: 28.6% (Black); 72.6% (white)
> Unemployment rate: 12.5% (Black); 5.3% (white)
> Poverty rate: 36.7% (Black); 10.8% (white)
Syracuse ranks as the worst metro area in New York state for Black Americans and the seventh worst nationwide. Segregation breeds inequality, and according to a study conducted by the Century Foundation, a public policy think tank, public schools across the Syracuse metro area are among the most segregated in the country. Fewer than 80% of Syracuse’s Black adult population have completed high school, compared to 93% of white adults in the area. Disparities are even more profound in measures of higher education. Just 14% of Black adults in the metro area have a bachelor’s degree or higher, compared to 34% of white adults.
The economic consequences of these disparities are evident. Black Syracuse residents are more than three times as likely to live below the poverty line as their white neighbors. Additionally, the typical Black household in the area earns just $34,120 a year, less than half the median income of $69,392 among white households.
[in-text-ad-2]
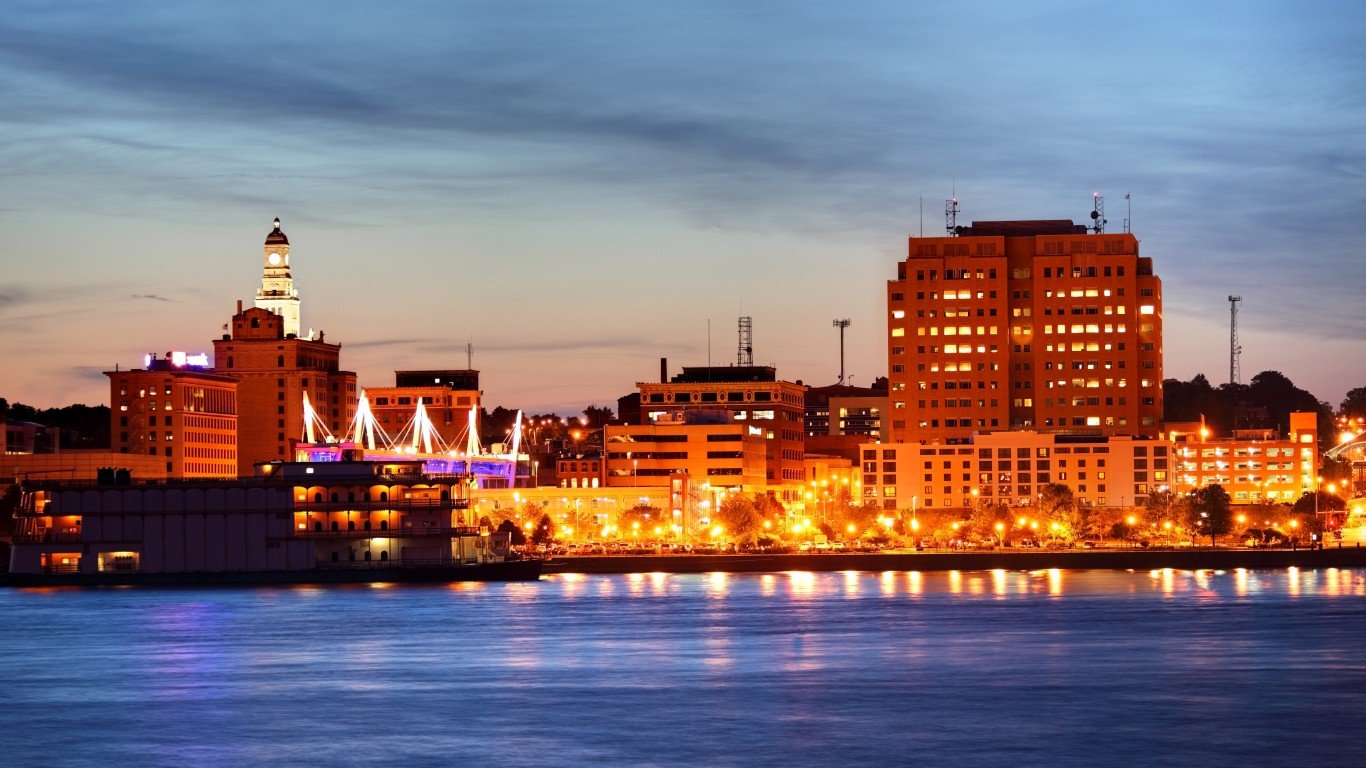
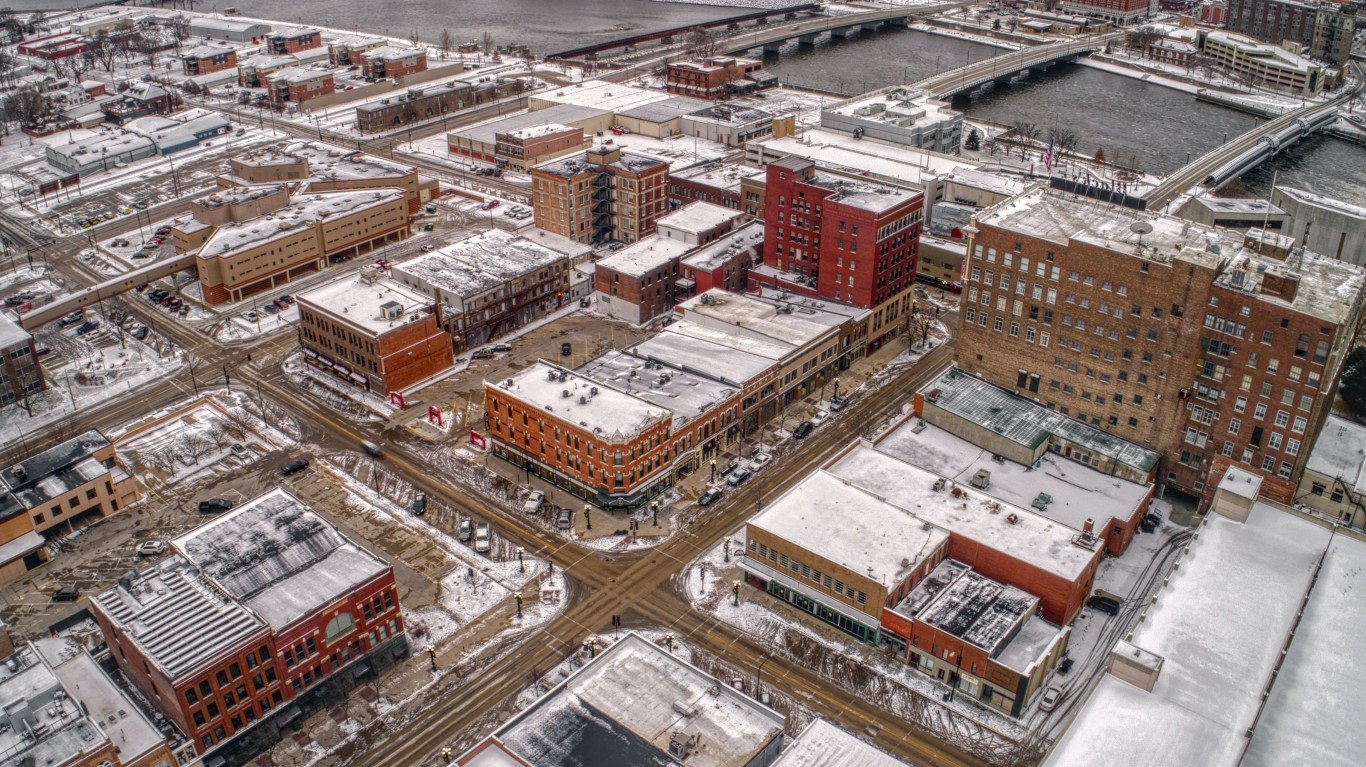
6. Davenport-Moline-Rock Island, IA-IL
> Black population: 28,049 (7.3% of total)
> Median household income: $33,007 (Black); $66,172 (white)
> Homeownership rate: 28.9% (Black); 74.7% (white)
> Unemployment rate: 16.2% (Black); 4.0% (white)
> Poverty rate: 34.8% (Black); 9.9% (white)
The Davenport metro area, primarily located in Iowa, has one of the largest Black populations in the state. Of the metro area’s 384,000 residents, 7.3% identify as Black, nearly double the 3.7% of Iowa residents who identify as Black. The wide economic disparities between Black and white Davenport residents also make the metro area the worst place in the state for Black Americans.
The typical Black household in Davenport earns just $33,007 a year, half the median income of $66,172 a typical white household earns. Additionally, more than a third of Davenport’s Black population live in poverty, compared to fewer than one in every 10 white metro area residents.
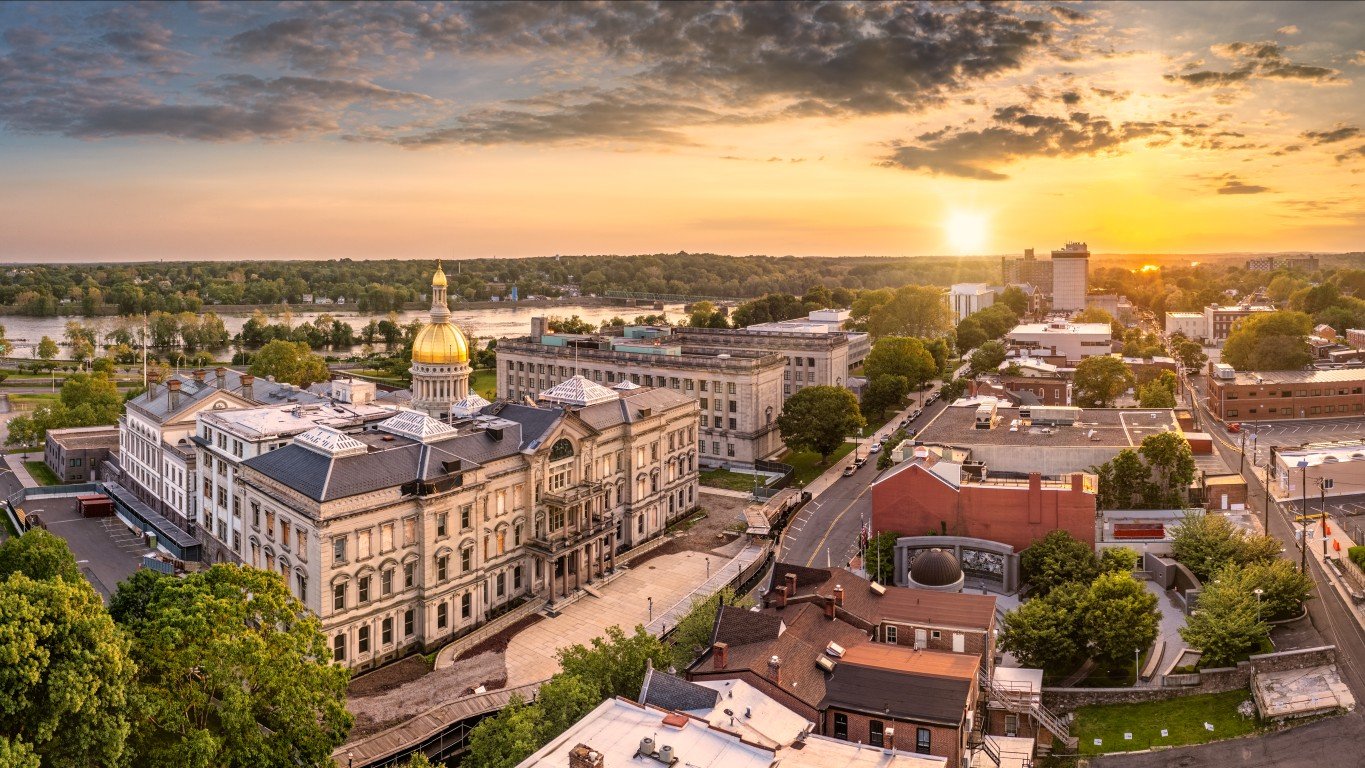
5. Trenton-Princeton, NJ
> Black population: 74,456 (19.3% of total)
> Median household income: $51,405 (Black); $94,207 (white)
> Homeownership rate: 39.8% (Black); 71.1% (white)
> Unemployment rate: 10.0% (Black); 5.6% (white)
> Poverty rate: 21.1% (Black); 8.1% (white)
Trenton-Princeton ranks as the worst metro area for Black Americans in the Northeast and the fifth worst in the United States. The metro area’s ranking is attributable in part to disparity in education outcomes. While 47.2% of white adults in the area have a bachelor’s degree or higher, only 21.8% of Black adults do.
Higher educational attainment can open new job opportunities and increase earning potential – and in Trenton, the Black unemployment rate of 10.0% is nearly double the white jobless rate of 5.6%. Additionally, 21.1% of Trenton’ Black population live below the poverty line, compared to just 8.1% of white area residents.
[in-text-ad]
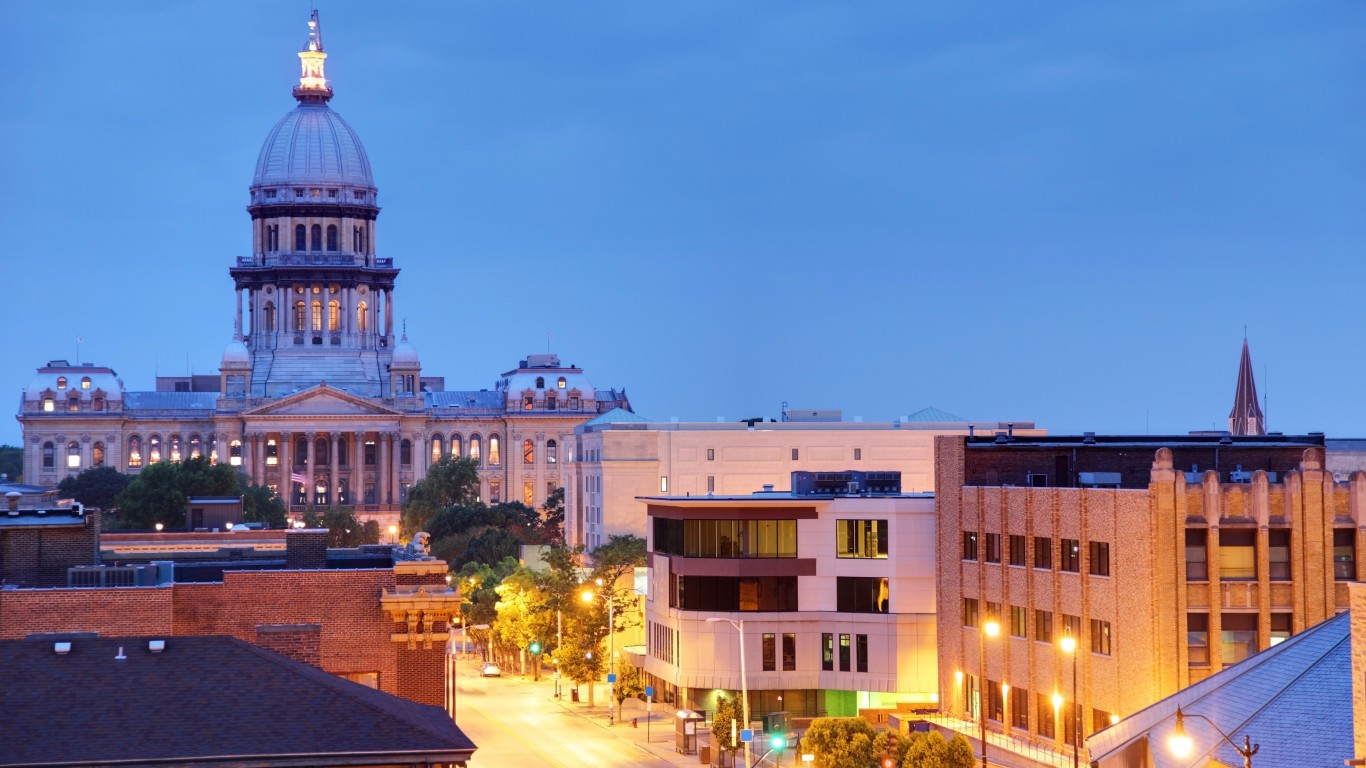
4. Springfield, IL
> Black population: 25,052 (12.0% of total)
> Median household income: $26,491 (Black); $73,279 (white)
> Homeownership rate: 29.3% (Black); 76.6% (white)
> Unemployment rate: 15.8% (Black); 3.9% (white)
> Poverty rate: 41.4% (Black); 9.2% (white)
Springfield, Illinois, has some of the worst economic disparities along racial lines of any metro area in the United States. Of the 25,000 Black Springfield residents, 41.4% live in poverty. Meanwhile, the local white poverty rate is just 9.2%. Additionally, most Black households in the metro area earn less than $27,000 a year, while the typical white household earns more than $73,000 a year.
The area’s income inequality along racial lines is rooted in the city’s racist housing policies of the 20th century that excluded Black residents from much of the metro area. Though those practices have since been outlawed, Black Springfield residents still appear to lack many of the same economic opportunities their white neighbors have. The Black jobless rate in the metro area stands at 15.8%, more than four times the white jobless rate of 3.9%.
[recirclink id=1147167]
3. Racine, WI
> Black population: 22,157 (11.2% of total)
> Median household income: $34,450 (Black); $73,904 (white)
> Homeownership rate: 25.8% (Black); 75.8% (white)
> Unemployment rate: 7.6% (Black); 3.4% (white)
> Poverty rate: 27.9% (Black); 8.0% (white)
Racine is one of two Wisconsin metro areas to rank among the three worst places for Black Americans. Racine has one of the largest income gaps between white and Black residents of any U.S. metro area. The median annual income among Black area households is just $34,450, less than half the $73,904 white median household income. With this income disparity, Black Racine residents are also more than three times as likely to live below the poverty line as white residents.
Racial disparities in Wisconsin extend far beyond Racine, particularly in the criminal justice system, as Black residents are more than 12 times as likely to be incarcerated as white residents across the state as a whole.
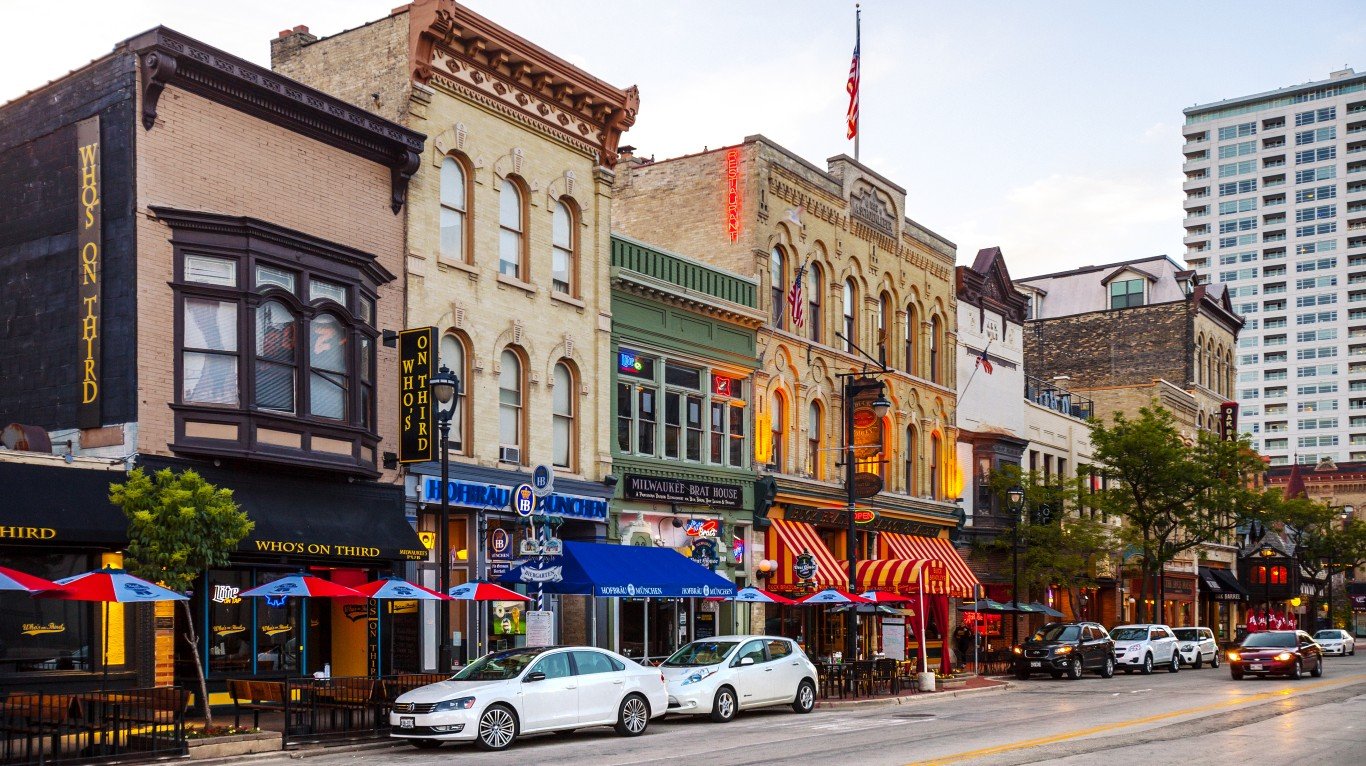
2. Milwaukee-Waukesha, WI
> Black population: 255,109 (16.2% of total)
> Median household income: $33,720 (Black); $78,186 (white)
> Homeownership rate: 27.1% (Black); 68.9% (white)
> Unemployment rate: 8.5% (Black); 3.0% (white)
> Poverty rate: 30.5% (Black); 7.4% (white)
Milwaukee ranks as the worst city for Black Americans in Wisconsin and the second worst nationwide. Like many cities on this list, racial inequality in Milwaukee can be traced to segregation deeply rooted in the metro area’s history of discriminatory zoning laws. According to 20th century appraisal maps drawn up by the Home Owners Loan Corporation, neighborhoods just north of downtown Milwaukee, such as Halyard Park, Hillside, and Haymarket, were deemed hazardous for investment, with assessors citing the area’s African American population as a threat to property values.
Redlining, as the practice has come to be known, resulted in generations of racial inequality. Today, the Black homeownership rate in the Milwaukee metro area is just 27.1%, a fraction of the 68.9% white homeownership rate. Additionally, over 30% of Black Milwaukee residents live below the poverty line, compared to 7.4% of white residents.
[in-text-ad-2]
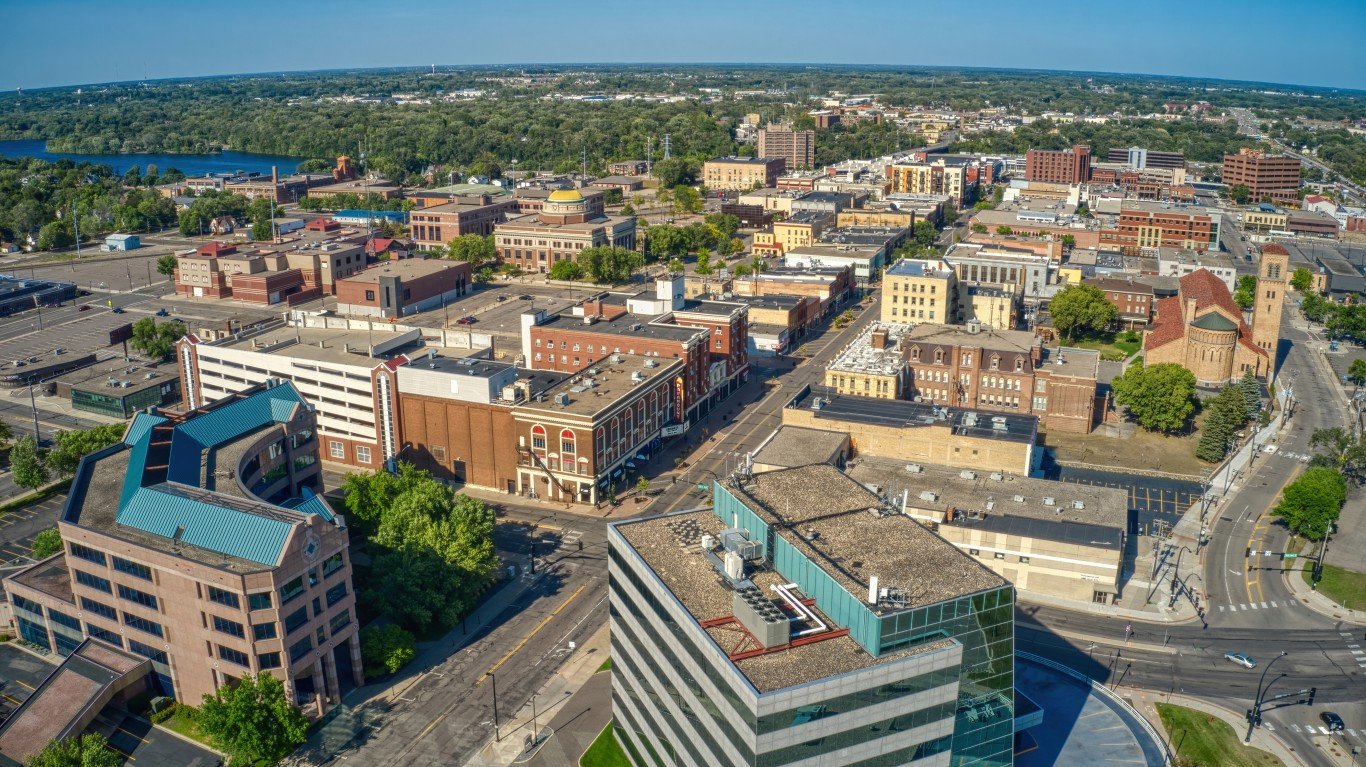
1. St. Cloud, MN
> Black population: 13,606 (6.8% of total)
> Median household income: $38,661 (Black); $70,653 (white)
> Homeownership rate: 8.8% (Black); 72.7% (white)
> Unemployment rate: 16.3% (Black); 3.6% (white)
> Poverty rate: 43.7% (Black); 8.8% (white)
St. Cloud, Minnesota, ranks as the worst metro area for Black Americans in the United States. Economic disparities along racial lines in the city are especially pronounced. For one, the Black poverty rate of 43.7% is nearly five times the local 8.8% white poverty rate. The widespread financial hardship in St. Cloud’s Black community is due in part to limited employment opportunities, as the Black unemployment rate of 16.3% is many times higher than the 3.6% white unemployment rate.
Homeownership is one of the most practical ways to build intergenerational wealth in the United States. The homeownership rate among Black St. Cloud residents is just 8.8%, compared to the white homeownership rate of 72.7%.
Contact [email protected] for any questions or corrections.