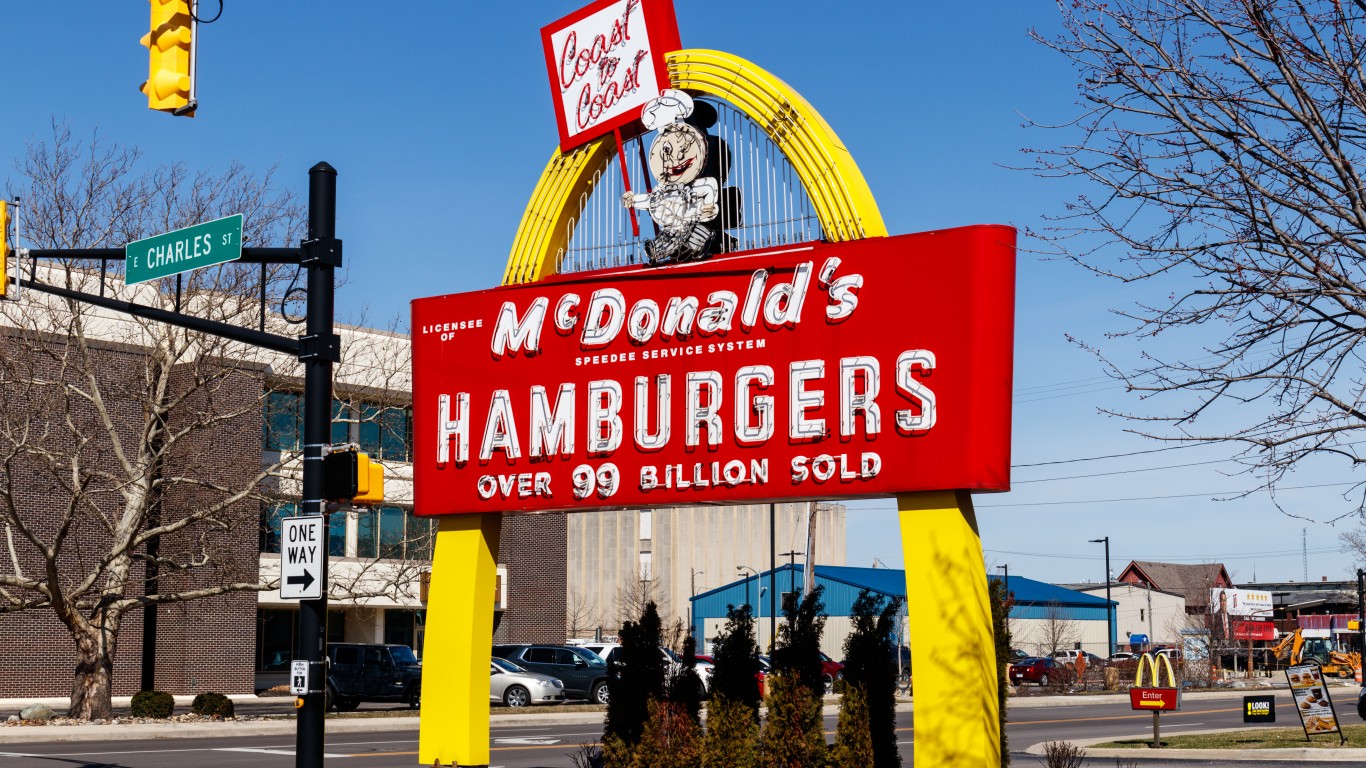
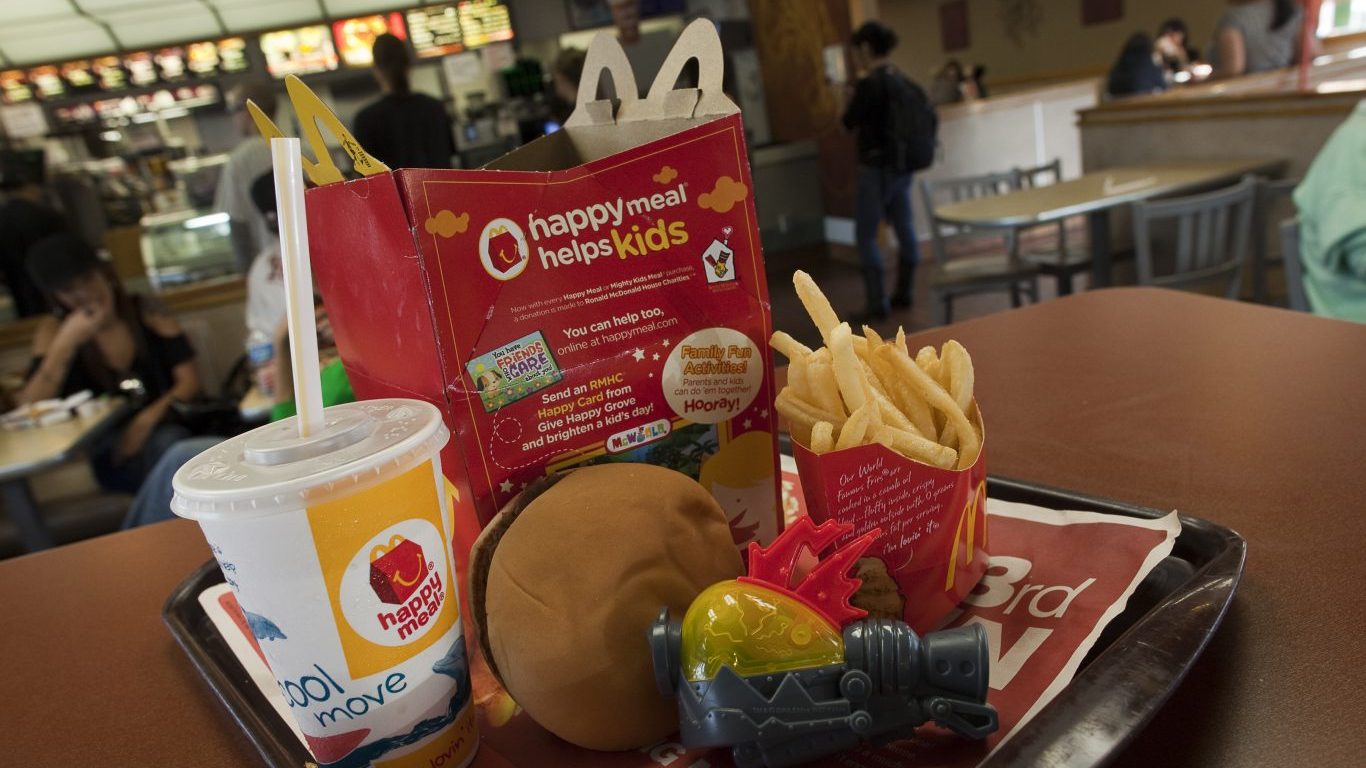
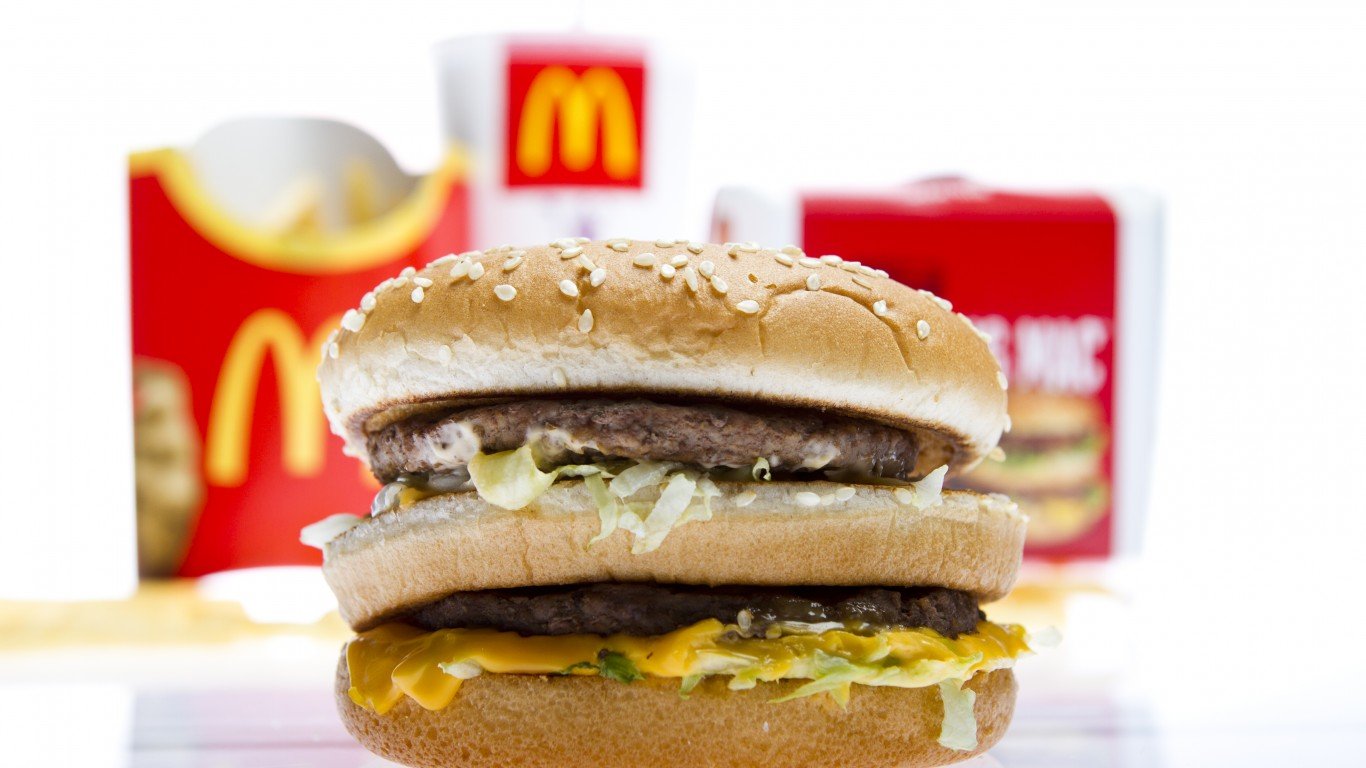
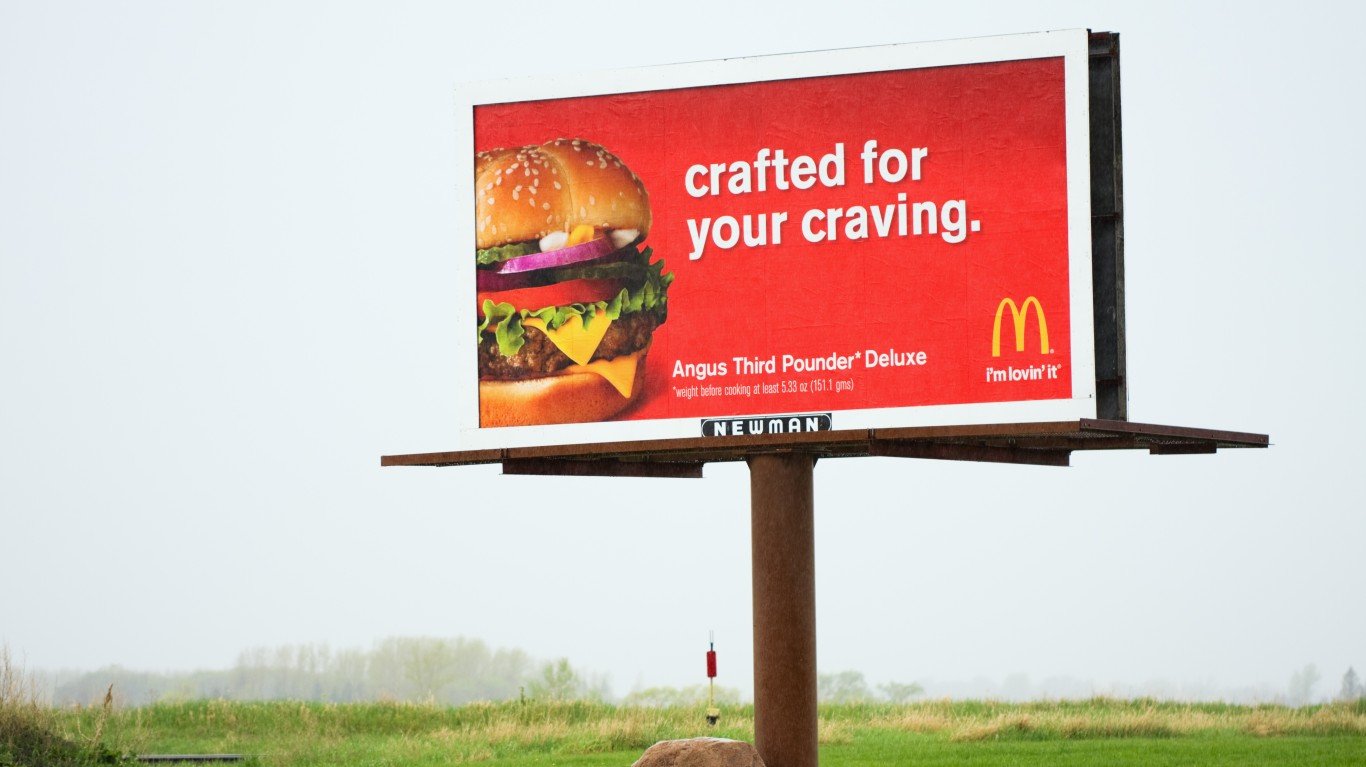
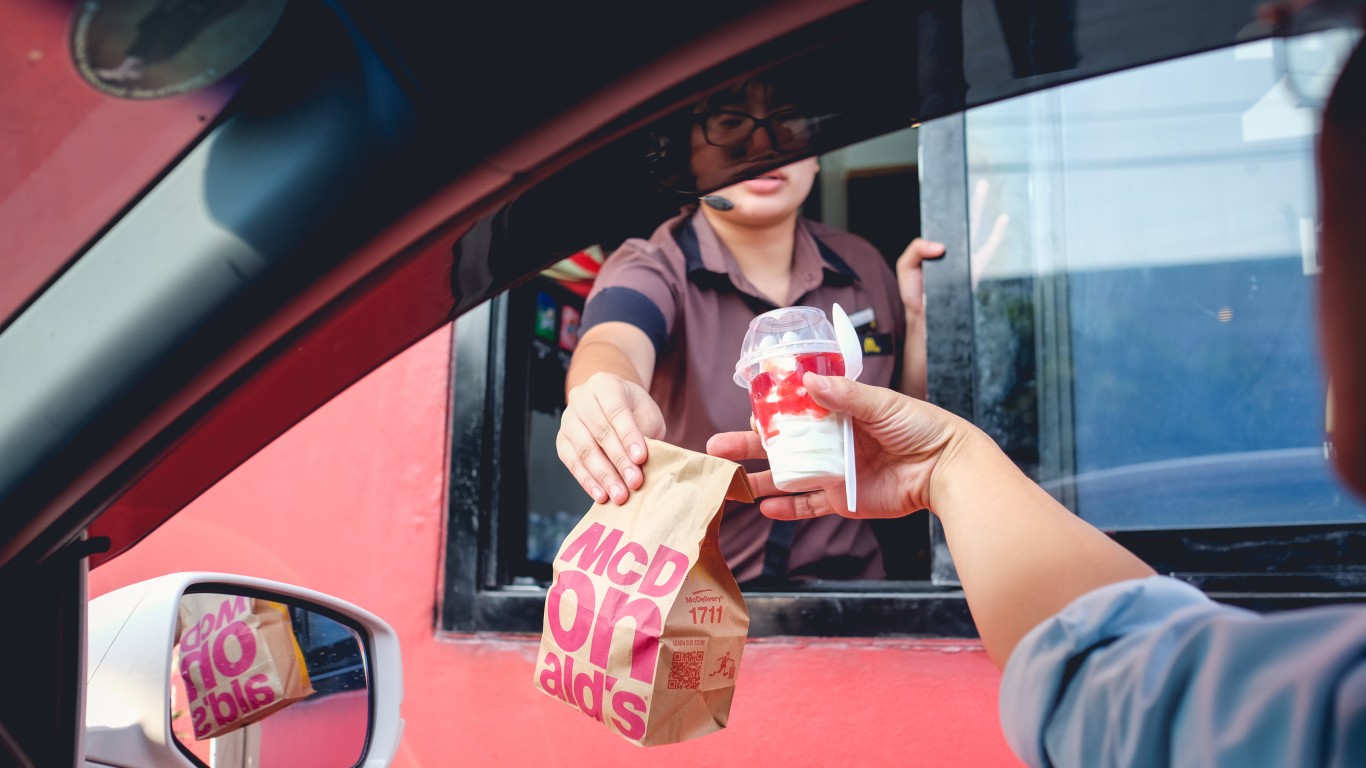
The Big Mac has been on the menu of McDonald’s, the largest fast-food chain in America, since 1967. It is the most famous sandwich in American cuisine. Back in 2007, on the sandwich’s 40-year anniversary, the company estimated it sells 550 million Big Macs a year in the U.S. alone. More are sold worldwide.
The two all-beef patties, special sauce, lettuce, cheese, pickles, onions on a sesame seed bun sandwich is so ubiquitous that each year The Economist publishes The Big Mac Index, which uses Big Mac prices to approximate cost of living, or purchasing power, in nations around the globe.
In the United States, prices of the Big Mac vary as well. And though it is supposed to taste the same whether you live in Hilo, Hawaii, or Bangor, Maine, the affordability of a 550-calorie Big Mac varies widely from state to state. (The price of this household item is soaring.)
To identify the “true cost” of a Big Mac in each state, 24/7 Wall St. adjusted Big Mac prices in each state by the state’s disposable income per capita (income after taxes) and cost of living. (The true cost, in other words, means that if all U.S. residents earned the same income, paid the same taxes, and had the same cost of living, then this is how much they would pay for the Big Mac considering the Big Mac price in their state.”) The 50 states and the District of Columbia are ranked by the “true cost” of a Big Mac.
The average price of a Big Mac nationwide was $5.15 in July. Prices in each state range from $3.91 to $5.35, while the true cost of a Big Mac ranges from $3.40 to $6.15. The national per capita disposable income was $55,671 in 2021, and ranges from $41,916 to $81,193. The cost of living ranges from 12% lower than the national average to 12% higher.
The true cost of a Big Mac is highest in the East Coast states of New York, Maryland, New Jersey, Delaware, and Vermont, as well as in the Southwest states of Arizona and New Mexico and in the Western states of Oregon, California, and Hawaii.
The actual cost of the iconic burger is at least 20% lower than the national average in 16 states. Mississippi has the lowest actual cost at $3.91, more than 24% lower than the national average price, but after adjusting for the state’s lowest disposable income and lowest cost of living, the “true cost” of a Big Mac is 18th highest of all states at $4.56.
Big Mac fans in Hawaii will have to dig deepest to sink their teeth into the famed burger. Already the Big Mac in the state is the second most expensive at $5.31. The “true cost” of the sandwich after adjusting for the state’s highest cost of living and middling disposable income is a whopping $6.15. (See also the price of gas every year since 1990.)
Click here to see states where people can’t afford a Big Mac.
Click here to see our detailed methodology.

51. South Dakota
> “True cost” of a Big Mac considering income and price: $3.40
> Actual price of a Big Mac: $3.99, 22.5% lower than avg price – 5th lowest
> Disposable income, 2021: $59,792, 7.4% higher than national avg – 12th highest
> Cost of living, 2020: 8.5% lower than national avg – 9th lowest
> Population: 879,336
[in-text-ad]
50. North Dakota
> “True cost” of a Big Mac considering income and price: $3.51
> Actual price of a Big Mac: $4.11, 20.2% lower than avg price – 16th lowest
> Disposable income, 2021: $60,051, 7.9% higher than national avg – 11th highest
> Cost of living, 2020: 8.0% lower than national avg – 14th lowest
> Population: 760,394
[recirclink id=1168741]
49. Wyoming
> “True cost” of a Big Mac considering income and price: $3.76
> Actual price of a Big Mac: $4.35, 15.5% lower than avg price – 25th lowest
> Disposable income, 2021: $59,434, 6.8% higher than national avg – 13th highest
> Cost of living, 2020: 7.7% lower than national avg – 16th lowest
> Population: 581,348
48. Nebraska
> “True cost” of a Big Mac considering income and price: $3.77
> Actual price of a Big Mac: $4.07, 21.0% lower than avg price – 12th lowest
> Disposable income, 2021: $55,892, 0.4% higher than national avg – 19th highest
> Cost of living, 2020: 7.1% lower than national avg – 22nd lowest
> Population: 1,923,826
[in-text-ad-2]
47. Kansas
> “True cost” of a Big Mac considering income and price: $3.94
> Actual price of a Big Mac: $4.07, 21.0% lower than avg price – 12th lowest
> Disposable income, 2021: $53,102, 4.6% lower than national avg – 25th highest
> Cost of living, 2020: 7.6% lower than national avg – 17th lowest
> Population: 2,912,619
46. Iowa
> “True cost” of a Big Mac considering income and price: $4.04
> Actual price of a Big Mac: $4.07, 21.0% lower than avg price – 12th lowest
> Disposable income, 2021: $51,031, 8.3% lower than national avg – 21st lowest
> Cost of living, 2020: 9.0% lower than national avg – 6th lowest
> Population: 3,150,011
[in-text-ad]
45. Ohio
> “True cost” of a Big Mac considering income and price: $4.08
> Actual price of a Big Mac: $4.03, 21.7% lower than avg price – 8th lowest
> Disposable income, 2021: $50,469, 9.3% lower than national avg – 19th lowest
> Cost of living, 2020: 8.3% lower than national avg – 12th lowest
> Population: 11,675,275
[recirclink id=1154831]
44. District of Columbia
> “True cost” of a Big Mac considering income and price: $4.09
> Actual price of a Big Mac: $5.35, 3.9% higher than avg price – the highest
> Disposable income, 2021: $81,193, 45.8% higher than national avg – the highest
> Cost of living, 2020: 11.5% higher than national avg – 2nd highest
> Population: 701,974
43. Connecticut
> “True cost” of a Big Mac considering income and price: $4.13
> Actual price of a Big Mac: $4.95, 3.9% lower than avg price – 7th highest
> Disposable income, 2021: $69,035, 24.0% higher than national avg – 3rd highest
> Cost of living, 2020: 3.4% higher than national avg – 10th highest
> Population: 3,570,549
[in-text-ad-2]
42. Missouri
> “True cost” of a Big Mac considering income and price: $4.17
> Actual price of a Big Mac: $3.99, 22.5% lower than avg price – 5th lowest
> Disposable income, 2021: $49,300, 11.4% lower than national avg – 14th lowest
> Cost of living, 2020: 7.5% lower than national avg – 19th lowest
> Population: 6,124,160
41. Tennessee
> “True cost” of a Big Mac considering income and price: $4.19
> Actual price of a Big Mac: $4.11, 20.2% lower than avg price – 16th lowest
> Disposable income, 2021: $50,292, 9.7% lower than national avg – 18th lowest
> Cost of living, 2020: 7.8% lower than national avg – 15th lowest
> Population: 6,772,268
[in-text-ad]
40. Wisconsin
> “True cost” of a Big Mac considering income and price: $4.21
> Actual price of a Big Mac: $4.19, 18.6% lower than avg price – 20th lowest
> Disposable income, 2021: $51,663, 7.2% lower than national avg – 23rd lowest
> Cost of living, 2020: 6.8% lower than national avg – 23rd lowest
> Population: 5,806,975
[recirclink id=1154200]
39. Indiana
> “True cost” of a Big Mac considering income and price: $4.21
> Actual price of a Big Mac: $4.11, 20.2% lower than avg price – 16th lowest
> Disposable income, 2021: $50,264, 9.7% lower than national avg – 17th lowest
> Cost of living, 2020: 7.5% lower than national avg – 20th lowest
> Population: 6,696,893
38. Massachusetts
> “True cost” of a Big Mac considering income and price: $4.21
> Actual price of a Big Mac: $4.87, 5.4% lower than avg price – 8th highest
> Disposable income, 2021: $69,137, 24.2% higher than national avg – 2nd highest
> Cost of living, 2020: 7.4% higher than national avg – 6th highest
> Population: 6,873,003
[in-text-ad-2]
37. Arkansas
> “True cost” of a Big Mac considering income and price: $4.24
> Actual price of a Big Mac: $3.95, 23.3% lower than avg price – 2nd lowest
> Disposable income, 2021: $46,278, 16.9% lower than national avg – 7th lowest
> Cost of living, 2020: 10.8% lower than national avg – 3rd lowest
> Population: 3,011,873
36. Oklahoma
> “True cost” of a Big Mac considering income and price: $4.27
> Actual price of a Big Mac: $4.07, 21.0% lower than avg price – 12th lowest
> Disposable income, 2021: $48,494, 12.9% lower than national avg – 9th lowest
> Cost of living, 2020: 8.7% lower than national avg – 8th lowest
> Population: 3,949,342
[in-text-ad]
35. Pennsylvania
> “True cost” of a Big Mac considering income and price: $4.28
> Actual price of a Big Mac: $4.47, 13.2% lower than avg price – 17th highest
> Disposable income, 2021: $56,715, 1.9% higher than national avg – 17th highest
> Cost of living, 2020: 2.4% lower than national avg – 23rd highest
> Population: 12,794,885
[recirclink id=1161455]
34. Minnesota
> “True cost” of a Big Mac considering income and price: $4.28
> Actual price of a Big Mac: $4.43, 14.0% lower than avg price – 22nd highest
> Disposable income, 2021: $56,794, 2.0% higher than national avg – 16th highest
> Cost of living, 2020: 1.4% lower than national avg – 21st highest
> Population: 5,600,166
33. Louisiana
> “True cost” of a Big Mac considering income and price: $4.31
> Actual price of a Big Mac: $4.15, 19.4% lower than avg price – 19th lowest
> Disposable income, 2021: $49,715, 10.7% lower than national avg – 16th lowest
> Cost of living, 2020: 7.3% lower than national avg – 21st lowest
> Population: 4,664,616
[in-text-ad-2]
32. New Hampshire
> “True cost” of a Big Mac considering income and price: $4.34
> Actual price of a Big Mac: $4.83, 6.2% lower than avg price – 10th highest
> Disposable income, 2021: $64,229, 15.4% higher than national avg – 6th highest
> Cost of living, 2020: 3.7% higher than national avg – 9th highest
> Population: 1,355,244

31. Montana
> “True cost” of a Big Mac considering income and price: $4.34
> Actual price of a Big Mac: $4.27, 17.1% lower than avg price – 23rd lowest
> Disposable income, 2021: $50,596, 9.1% lower than national avg – 20th lowest
> Cost of living, 2020: 7.6% lower than national avg – 18th lowest
> Population: 1,061,705
[in-text-ad]
30. North Carolina
> “True cost” of a Big Mac considering income and price: $4.35
> Actual price of a Big Mac: $4.15, 19.4% lower than avg price – 19th lowest
> Disposable income, 2021: $48,792, 12.4% lower than national avg – 11th lowest
> Cost of living, 2020: 8.2% lower than national avg – 13th lowest
> Population: 10,386,227
[recirclink id=1148209]
29. Illinois
> “True cost” of a Big Mac considering income and price: $4.36
> Actual price of a Big Mac: $4.55, 11.7% lower than avg price – 16th highest
> Disposable income, 2021: $58,438, 5.0% higher than national avg – 15th highest
> Cost of living, 2020: 0.5% higher than national avg – 17th highest
> Population: 12,716,164
28. Colorado
> “True cost” of a Big Mac considering income and price: $4.36
> Actual price of a Big Mac: $4.59, 10.9% lower than avg price – 14th highest
> Disposable income, 2021: $60,344, 8.4% higher than national avg – 10th highest
> Cost of living, 2020: 2.9% higher than national avg – 12th highest
> Population: 5,684,926
[in-text-ad-2]
27. Washington
> “True cost” of a Big Mac considering income and price: $4.36
> Actual price of a Big Mac: $4.67, 9.3% lower than avg price – 11th highest
> Disposable income, 2021: $64,004, 15.0% higher than national avg – 7th highest
> Cost of living, 2020: 7.4% higher than national avg – 7th highest
> Population: 7,512,465
26. Georgia
> “True cost” of a Big Mac considering income and price: $4.44
> Actual price of a Big Mac: $4.15, 19.4% lower than avg price – 19th lowest
> Disposable income, 2021: $49,192, 11.6% lower than national avg – 12th lowest
> Cost of living, 2020: 5.5% lower than national avg – 25th lowest
> Population: 10,516,579
[in-text-ad]
25. Kentucky
> “True cost” of a Big Mac considering income and price: $4.44
> Actual price of a Big Mac: $4.03, 21.7% lower than avg price – 8th lowest
> Disposable income, 2021: $45,357, 18.5% lower than national avg – 5th lowest
> Cost of living, 2020: 10.2% lower than national avg – 5th lowest
> Population: 4,461,952
[recirclink id=1168741]
24. Texas
> “True cost” of a Big Mac considering income and price: $4.48
> Actual price of a Big Mac: $4.39, 14.8% lower than avg price – 25th highest
> Disposable income, 2021: $54,280, 2.5% lower than national avg – 21st highest
> Cost of living, 2020: 0.5% lower than national avg – 18th highest
> Population: 28,635,442
23. South Carolina
> “True cost” of a Big Mac considering income and price: $4.49
> Actual price of a Big Mac: $4.11, 20.2% lower than avg price – 16th lowest
> Disposable income, 2021: $46,715, 16.1% lower than national avg – 8th lowest
> Cost of living, 2020: 8.4% lower than national avg – 11th lowest
> Population: 5,091,517
[in-text-ad-2]
22. Alaska
> “True cost” of a Big Mac considering income and price: $4.50
> Actual price of a Big Mac: $4.87, 5.4% lower than avg price – 8th highest
> Disposable income, 2021: $62,164, 11.7% higher than national avg – 9th highest
> Cost of living, 2020: 3.2% higher than national avg – 11th highest
> Population: 736,990
21. Alabama
> “True cost” of a Big Mac considering income and price: $4.51
> Actual price of a Big Mac: $3.99, 22.5% lower than avg price – 5th lowest
> Disposable income, 2021: $44,003, 21.0% lower than national avg – 3rd lowest
> Cost of living, 2020: 10.7% lower than national avg – 4th lowest
> Population: 4,893,186
[in-text-ad]
20. Michigan
> “True cost” of a Big Mac considering income and price: $4.52
> Actual price of a Big Mac: $4.27, 17.1% lower than avg price – 23rd lowest
> Disposable income, 2021: $49,427, 11.2% lower than national avg – 15th lowest
> Cost of living, 2020: 6.0% lower than national avg – 24th lowest
> Population: 9,973,907
[recirclink id=1154831]
19. West Virginia
> “True cost” of a Big Mac considering income and price: $4.53
> Actual price of a Big Mac: $4.03, 21.7% lower than avg price – 8th lowest
> Disposable income, 2021: $43,537, 21.8% lower than national avg – 2nd lowest
> Cost of living, 2020: 12.0% lower than national avg – 2nd lowest
> Population: 1,807,426
18. Mississippi
> “True cost” of a Big Mac considering income and price: $4.56
> Actual price of a Big Mac: $3.91, 24.1% lower than avg price – the lowest
> Disposable income, 2021: $41,916, 24.7% lower than national avg – the lowest
> Cost of living, 2020: 12.2% lower than national avg – the lowest
> Population: 2,981,835
[in-text-ad-2]
17. Nevada
> “True cost” of a Big Mac considering income and price: $4.59
> Actual price of a Big Mac: $4.43, 14.0% lower than avg price – 22nd highest
> Disposable income, 2021: $52,198, 6.2% lower than national avg – 25th lowest
> Cost of living, 2020: 2.9% lower than national avg – 24th highest
> Population: 3,030,281
16. Rhode Island
> “True cost” of a Big Mac considering income and price: $4.61
> Actual price of a Big Mac: $4.47, 13.2% lower than avg price – 17th highest
> Disposable income, 2021: $54,991, 1.2% lower than national avg – 20th highest
> Cost of living, 2020: 1.8% higher than national avg – 14th highest
> Population: 1,057,798
[in-text-ad]
15. Florida
> “True cost” of a Big Mac considering income and price: $4.63
> Actual price of a Big Mac: $4.47, 13.2% lower than avg price – 17th highest
> Disposable income, 2021: $54,099, 2.8% lower than national avg – 22nd highest
> Cost of living, 2020: 0.7% higher than national avg – 16th highest
> Population: 21,216,924
[recirclink id=1154200]
14. Virginia
> “True cost” of a Big Mac considering income and price: $4.64
> Actual price of a Big Mac: $4.67, 9.3% lower than avg price – 11th highest
> Disposable income, 2021: $56,638, 1.7% higher than national avg – 18th highest
> Cost of living, 2020: 1.0% higher than national avg – 15th highest
> Population: 8,509,358
13. Idaho
> “True cost” of a Big Mac considering income and price: $4.67
> Actual price of a Big Mac: $4.23, 17.9% lower than avg price – 21st lowest
> Disposable income, 2021: $46,026, 17.3% lower than national avg – 6th lowest
> Cost of living, 2020: 8.8% lower than national avg – 7th lowest
> Population: 1,754,367
[in-text-ad-2]
12. Maine
> “True cost” of a Big Mac considering income and price: $4.72
> Actual price of a Big Mac: $4.47, 13.2% lower than avg price – 17th highest
> Disposable income, 2021: $51,073, 8.3% lower than national avg – 22nd lowest
> Cost of living, 2020: 3.2% lower than national avg – 25th highest
> Population: 1,340,825
11. Utah
> “True cost” of a Big Mac considering income and price: $4.73
> Actual price of a Big Mac: $4.39, 14.8% lower than avg price – 25th highest
> Disposable income, 2021: $49,291, 11.5% lower than national avg – 13th lowest
> Cost of living, 2020: 4.7% lower than national avg – 26th highest
> Population: 3,151,239
[in-text-ad]
10. Vermont
> “True cost” of a Big Mac considering income and price: $4.74
> Actual price of a Big Mac: $4.59, 10.9% lower than avg price – 14th highest
> Disposable income, 2021: $53,506, 3.9% lower than national avg – 24th highest
> Cost of living, 2020: 0.7% lower than national avg – 19th highest
> Population: 624,340
[recirclink id=1161455]
9. California
> “True cost” of a Big Mac considering income and price: $4.83
> Actual price of a Big Mac: $5.11, 0.8% lower than avg price – 5th highest
> Disposable income, 2021: $64,994, 16.7% higher than national avg – 4th highest
> Cost of living, 2020: 10.4% higher than national avg – 4th highest
> Population: 39,346,023
8. Oregon
> “True cost” of a Big Mac considering income and price: $4.84
> Actual price of a Big Mac: $4.47, 13.2% lower than avg price – 17th highest
> Disposable income, 2021: $52,748, 5.3% lower than national avg – 26th highest
> Cost of living, 2020: 2.6% higher than national avg – 13th highest
> Population: 4,176,346
[in-text-ad-2]
7. New Mexico
> “True cost” of a Big Mac considering income and price: $4.85
> Actual price of a Big Mac: $4.31, 16.3% lower than avg price – 24th lowest
> Disposable income, 2021: $45,293, 18.6% lower than national avg – 4th lowest
> Cost of living, 2020: 8.4% lower than national avg – 10th lowest
> Population: 2,097,021
6. Delaware
> “True cost” of a Big Mac considering income and price: $4.86
> Actual price of a Big Mac: $4.63, 10.1% lower than avg price – 13th highest
> Disposable income, 2021: $51,916, 6.7% lower than national avg – 24th lowest
> Cost of living, 2020: 2.1% lower than national avg – 22nd highest
> Population: 967,679
[in-text-ad]
5. New Jersey
> “True cost” of a Big Mac considering income and price: $5.00
> Actual price of a Big Mac: $5.19, 0.8% higher than avg price – 4th highest
> Disposable income, 2021: $64,258, 15.4% higher than national avg – 5th highest
> Cost of living, 2020: 11.2% higher than national avg – 3rd highest
> Population: 8,885,418
[recirclink id=1148209]
4. Arizona
> “True cost” of a Big Mac considering income and price: $5.01
> Actual price of a Big Mac: $4.43, 14.0% lower than avg price – 22nd highest
> Disposable income, 2021: $48,732, 12.5% lower than national avg – 10th lowest
> Cost of living, 2020: 0.9% lower than national avg – 20th highest
> Population: 7,174,064
3. Maryland
> “True cost” of a Big Mac considering income and price: $5.04
> Actual price of a Big Mac: $5.03, 2.3% lower than avg price – 6th highest
> Disposable income, 2021: $59,105, 6.2% higher than national avg – 14th highest
> Cost of living, 2020: 6.5% higher than national avg – 8th highest
> Population: 6,037,624
[in-text-ad-2]
2. New York
> “True cost” of a Big Mac considering income and price: $5.08
> Actual price of a Big Mac: $5.23, 1.6% higher than avg price – 3rd highest
> Disposable income, 2021: $63,161, 13.5% higher than national avg – 8th highest
> Cost of living, 2020: 10.2% higher than national avg – 5th highest
> Population: 19,514,849
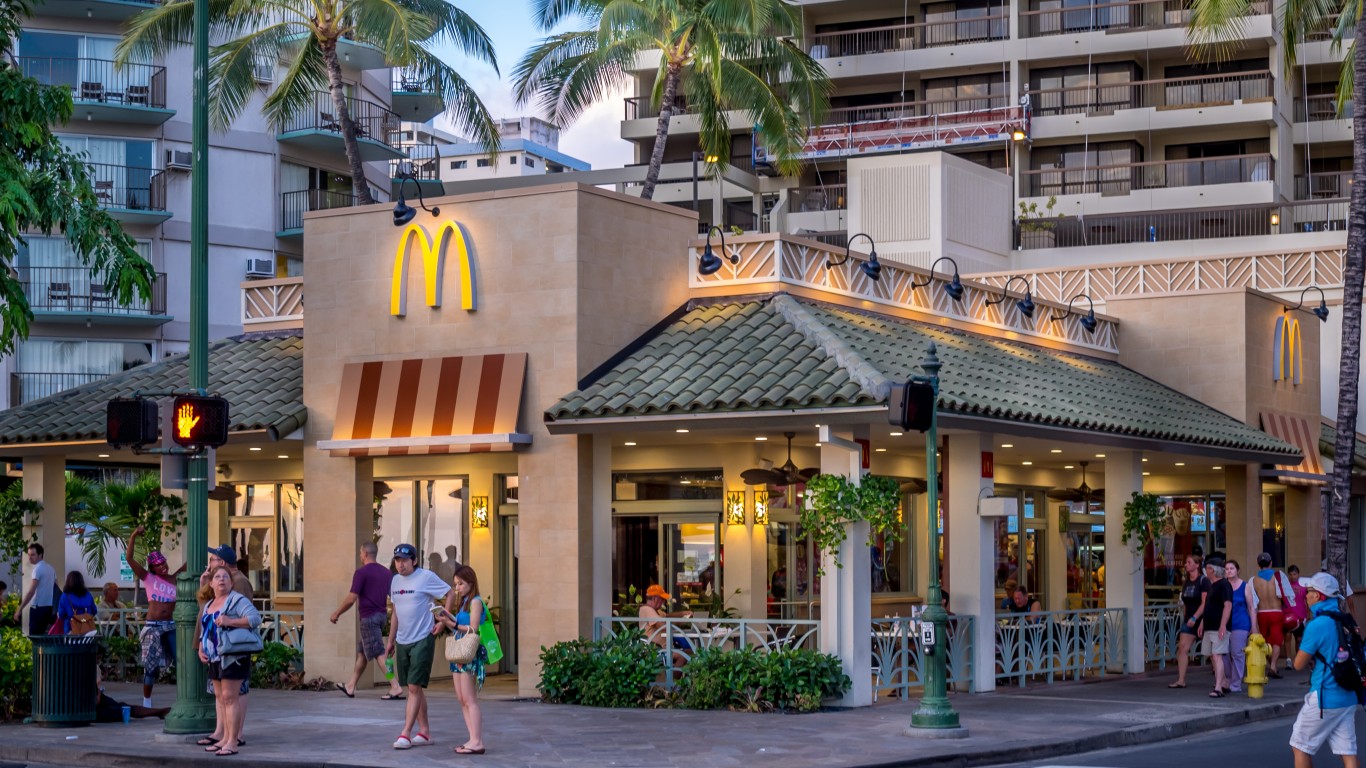
1. Hawaii
> “True cost” of a Big Mac considering income and price: $6.15
> Actual price of a Big Mac: $5.31, 3.1% higher than avg price – 2nd highest
> Disposable income, 2021: $53,815, 3.3% lower than national avg – 23rd highest
> Cost of living, 2020: 12.0% higher than national avg – the highest
> Population: 1,420,074
Methodology
To identify the “true cost” of a Big Mac in each state, 24/7 Wall St. adjusted Big Mac prices in each state by the state’s disposable income per capita (income after taxes) and cost of living. We indexed each state’s cost of living and disposable income to national levels, and used the indices to adjust the cost of a Big Mac to find the “true cost.” (In other words, if all U.S. residents earned the same income, paid the same taxes, and had the same cost of living, then this is how much they would pay for the Big Mac considering the Big Mac price in their state.) The 50 states and the District of Columbia are ranked by the “true cost” of a Big Mac.
Big Mac prices came from Fast Food Menu Prices and are recent as of September. The national average price of a Big Mac of $5.15 came from The Economist’s Big Mac data repository for the publication’s Big Mac Index. Disposable income per capita figures are for 2021 and came from the Bureau of Labor Statistics. The national per capita disposable income was $55,671 that year. Regional price parities for 2020, which express the cost of living in the state, are from the Bureau of Economic Analysis. While we partly emulated Pantry and Larder’s methodology, ours takes a different approach.
Contact [email protected] for any questions or corrections.