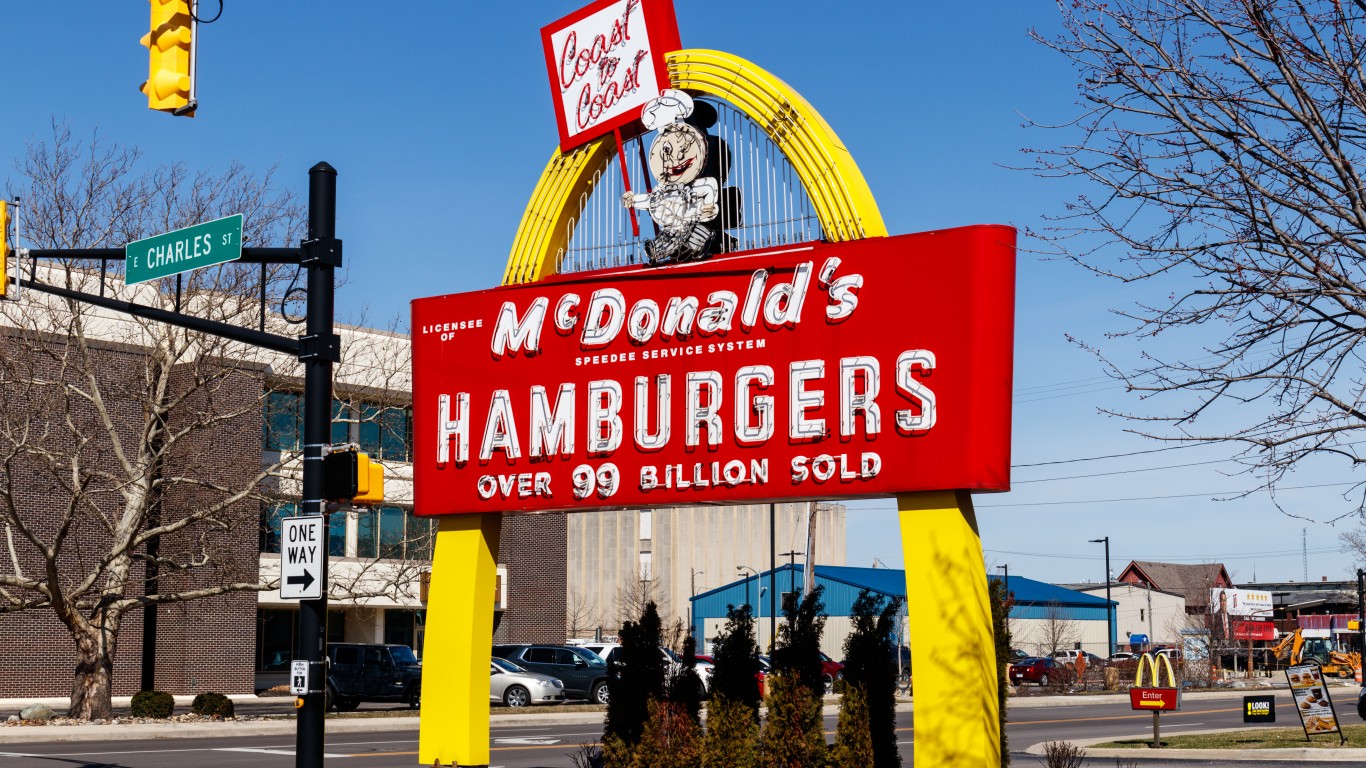
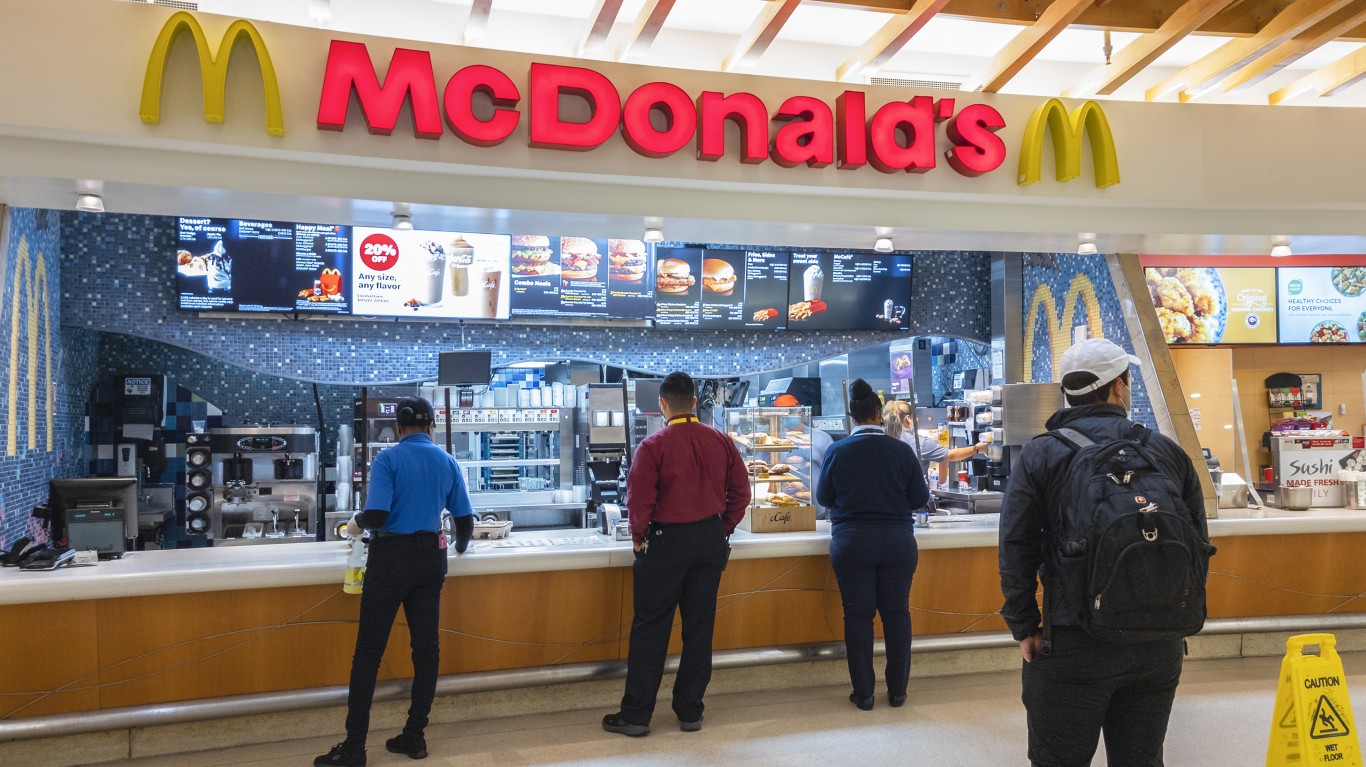
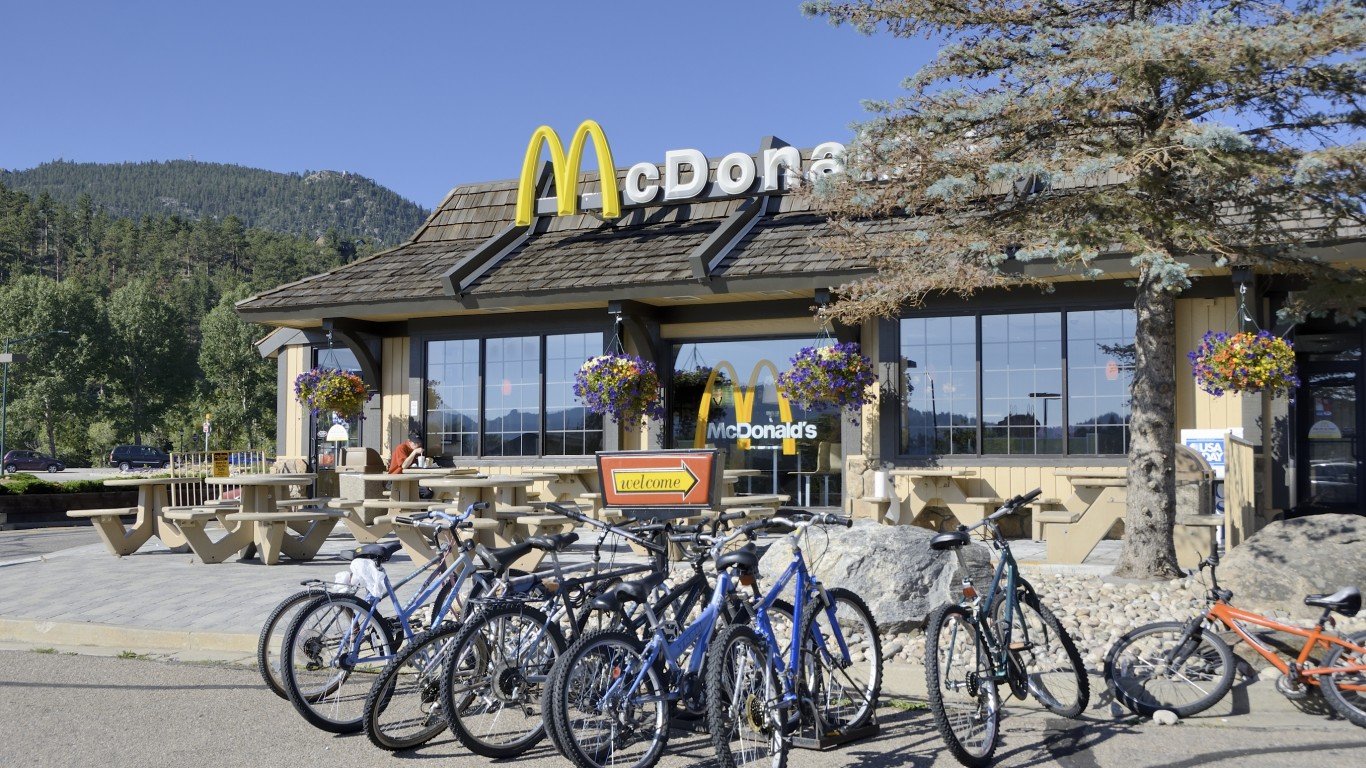
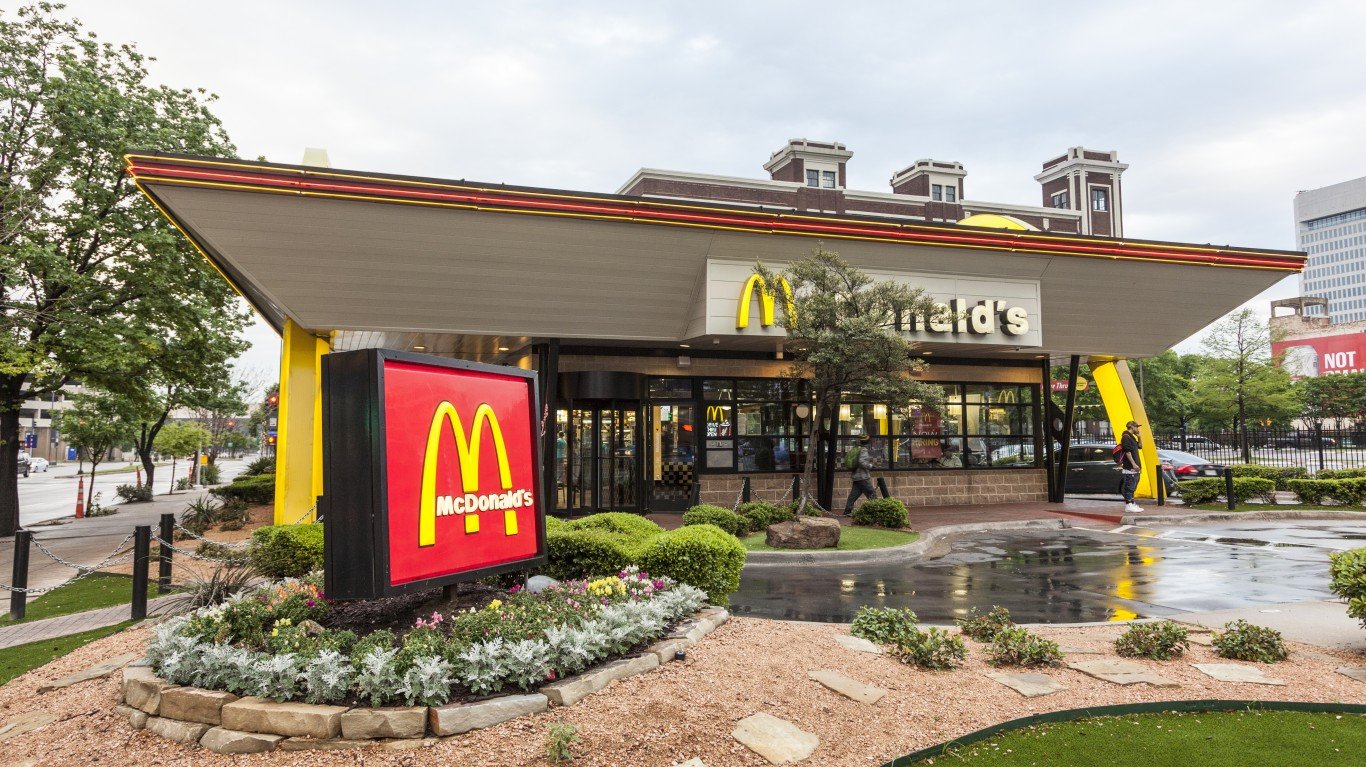
The Big Mac — the menu mainstay of McDonald’s, one of America’s largest fast-food chains — is among the most famous sandwiches in the United States. The ingredients of the burger were enshrined in a television commercial jingle: Two all-beef patties, special sauce, lettuce, cheese, pickles, onions on a sesame seed bun. (These are the top 5 McDonald’s menu items in every state.)
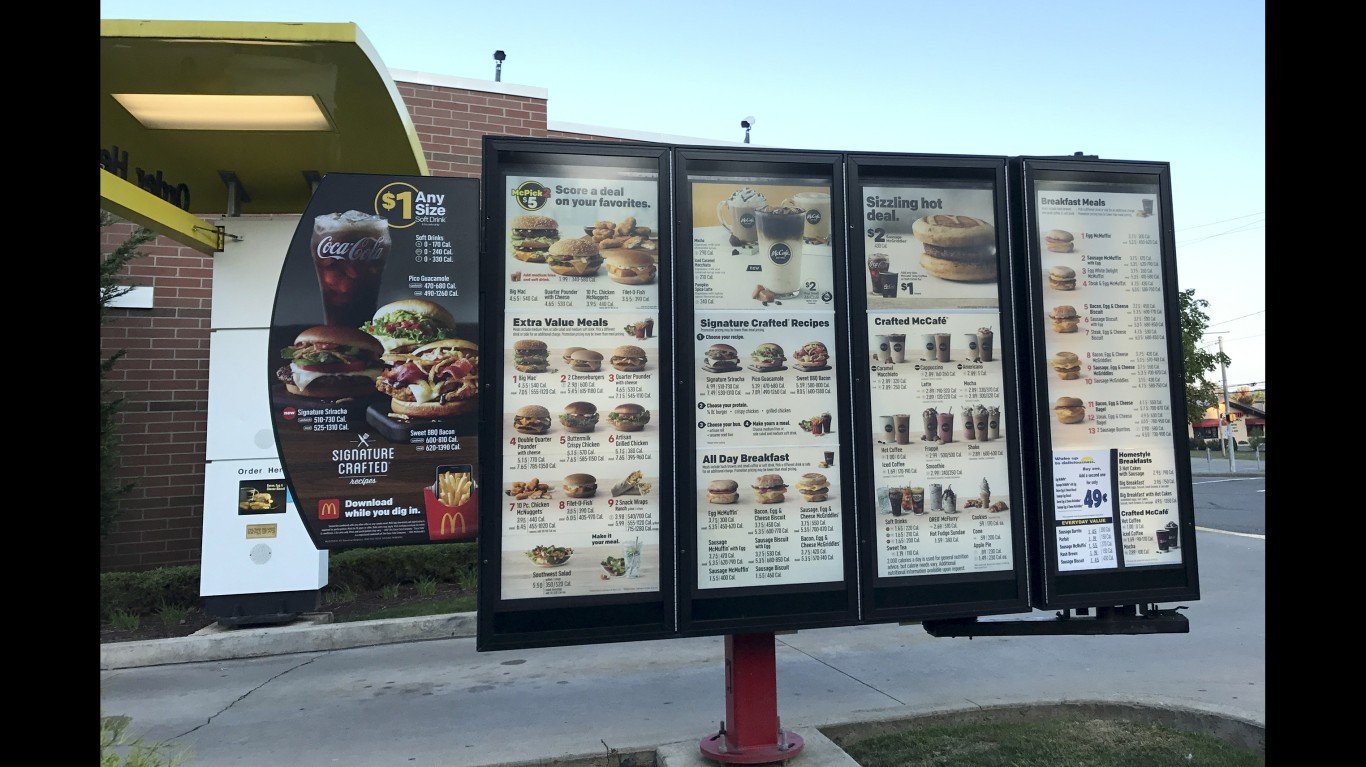
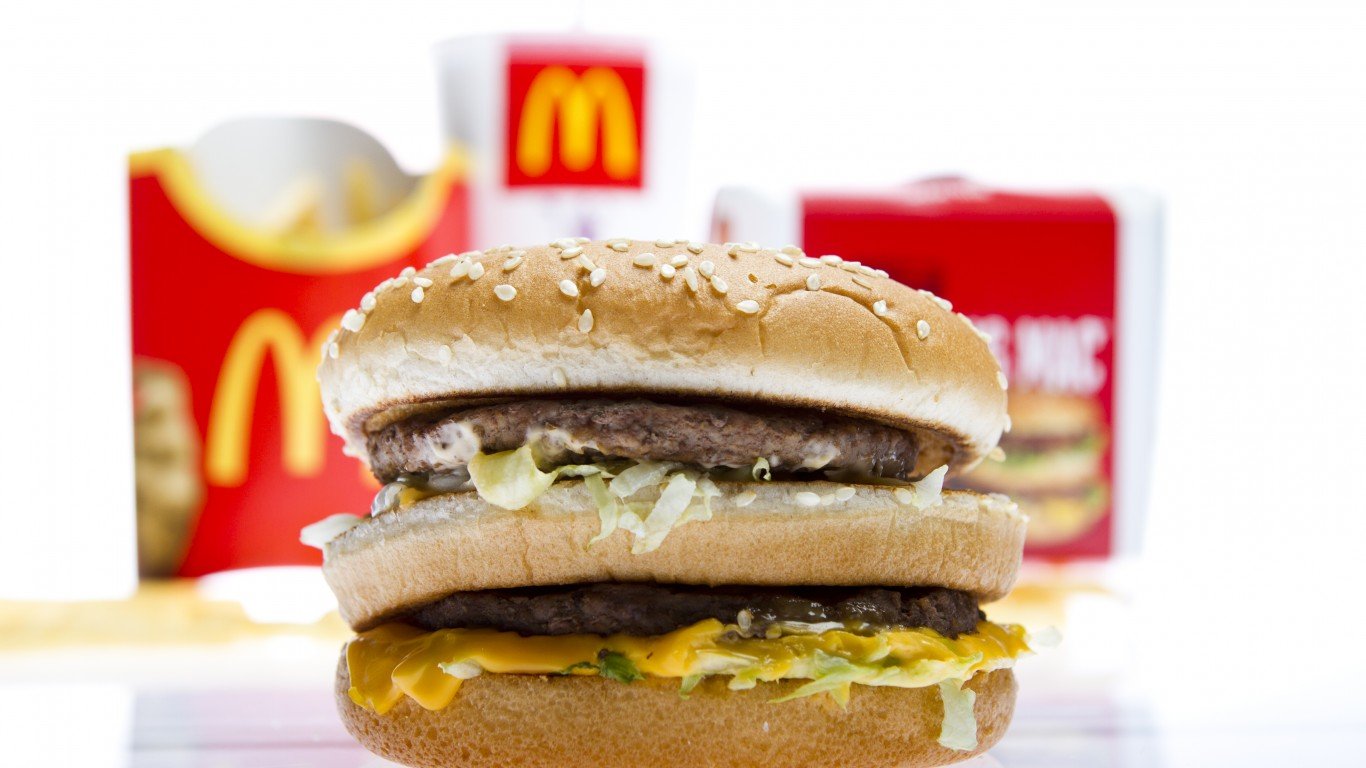
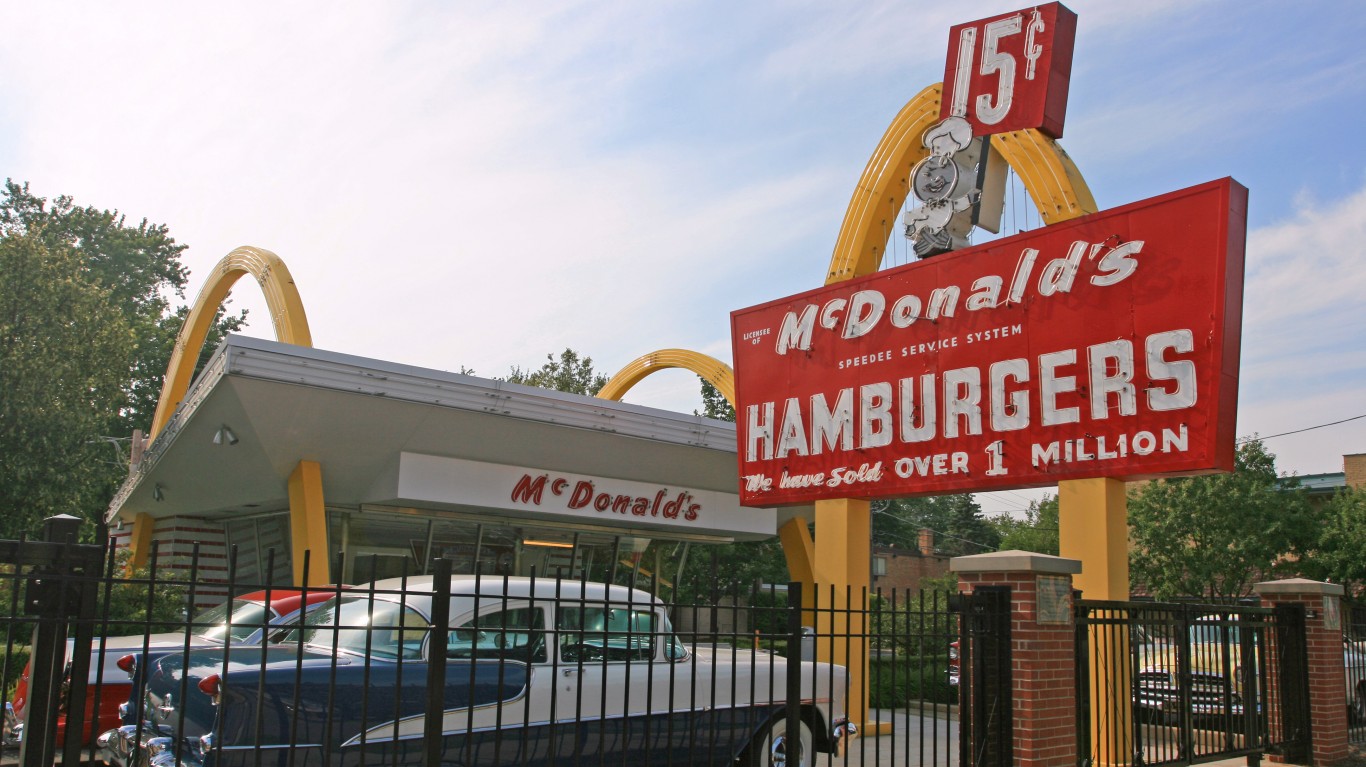
The sandwich is so well known that the Economist magazine publishes The Big Mac Index, which uses Big Mac prices to approximate cost of living, or purchasing power, in countries around the world. When it debuted in 1967, the Big Mac cost 45 cents; today, the average price is $5.17. These days, the price of the sandwich in the U.S. varies considerably from state to state.
To identify the “true cost” of a Big Mac in each state, 24/7 Wall St. adjusted the average Big Mac price in each state by the state’s disposable income per capita (income after taxes) and cost of living (based on regional price parities). In other words, considering income, taxes, cost and living and actual Big Mac price in each state — we calculated the true cost of Big Mac for residents living in that state. The 50 states were ranked by the “true cost” of a Big Mac.
The Big Mac is supposed to taste the same regardless of where you are, but the price varies dramatically. Prices in each state range from $4.19 to $7.09, while the “true cost” of a Big Mac — after adjusting for income, taxes, and cost of living — ranges from $3.44 to $6.54. The true cost of a Big Mac is highest in the East Coast states of Maine, Rhode Island, Massachusetts, and Vermont, as well as the Southern states of Arkansas and Mississippi, two of the poorer states in the Union. (These are the 31 poorest states in America ranked.)
Folks in Wyoming and South Dakota get the best deal for the iconic burger. In Wyoming, the true cost is $3.44 and the actual price is $4.19, 19% lower than the national average price. This is because disposable income in the state is $62,227, 11.5% higher than the national average, while the cost of living is 8.6% lower than national average. Similarly, in South Dakota, the true cost of a Big Mac is $3.83 and the actual price is $4.54, 12.2% lower than national average. Disposable income in South Dakota is $59,688, 6.9% higher than the national average, while the cost of living is 9.9% lower than the national average.
On the other hand, in Vermont, where the price of a Big Mac is $6.29, or 21.7% higher than the national average, after considering the state’s relatively low disposable income of $54,714 (2.0% lower than national average) and cost of living that is just 1.3% lower than the national average, the true cost of a Big Mac comes to $6.33. Similarly in Hawaii, where the price of a Big Mac is $5.31, after considering the state’s relatively low disposable income of $52,515 (5.9% lower than national average) and the nation’s highest cost of living, the true cost of a Big Mac for residents there comes to $6.39.
Click here to see the states where people can’t afford a Big Mac.
Click here to read our detailed methodology.
50. Wyoming
> “True cost” of a Big Mac considering income and cost of living: $3.44
> Actual price of a Big Mac, Aug 2023: $4.19, 19.0% lower than national avg price – 2nd lowest
> Disposable income, 2022: $62,227, 11.5% higher than national avg – 9th highest
> Cost of living, 2021: 8.6% lower than national avg – 14th lowest
> Population, 2022: 581,381
[in-text-ad]
49. South Dakota
> “True cost” of a Big Mac considering income and cost of living: $3.83
> Actual price of a Big Mac, Aug 2023: $4.54, 12.2% lower than national avg price – 12th lowest
> Disposable income, 2022: $59,688, 6.9% higher than national avg – 11th highest
> Cost of living, 2021: 9.9% lower than national avg – 7th lowest
> Population, 2022: 909,824
[recirclink id=1319123]
48. Nebraska
> “True cost” of a Big Mac considering income and cost of living: $3.94
> Actual price of a Big Mac, Aug 2023: $4.29, 17.0% lower than national avg price – 6th lowest
> Disposable income, 2022: $55,766, 0.1% lower than national avg – 19th highest
> Cost of living, 2021: 8.2% lower than national avg – 16th lowest
> Population, 2022: 1,967,923
47. Pennsylvania
> “True cost” of a Big Mac considering income and cost of living: $4.12
> Actual price of a Big Mac, Aug 2023: $4.29, 17.0% lower than national avg price – 6th lowest
> Disposable income, 2022: $56,034, 0.4% higher than national avg – 18th highest
> Cost of living, 2021: 3.6% lower than national avg – 23rd highest
> Population, 2022: 12,972,008
[in-text-ad-2]
46. Washington
> “True cost” of a Big Mac considering income and cost of living: $4.19
> Actual price of a Big Mac, Aug 2023: $4.49, 13.2% lower than national avg price – 11th lowest
> Disposable income, 2022: $65,210, 16.8% higher than national avg – 4th highest
> Cost of living, 2021: 8.9% higher than national avg – 5th highest
> Population, 2022: 7,785,786
45. Kansas
> “True cost” of a Big Mac considering income and cost of living: $4.35
> Actual price of a Big Mac, Aug 2023: $4.49, 13.2% lower than national avg price – 11th lowest
> Disposable income, 2022: $52,484, 6.0% lower than national avg – 23rd lowest
> Cost of living, 2021: 8.8% lower than national avg – 12th lowest
> Population, 2022: 2,937,150
[in-text-ad]
44. Ohio
> “True cost” of a Big Mac considering income and cost of living: $4.38
> Actual price of a Big Mac, Aug 2023: $4.29, 17.0% lower than national avg price – 6th lowest
> Disposable income, 2022: $50,577, 9.4% lower than national avg – 18th lowest
> Cost of living, 2021: 7.5% lower than national avg – 19th lowest
> Population, 2022: 11,756,058
[recirclink id=1254498]
43. North Carolina
> “True cost” of a Big Mac considering income and cost of living: $4.41
> Actual price of a Big Mac, Aug 2023: $4.19, 19.0% lower than national avg price – 2nd lowest
> Disposable income, 2022: $49,728, 10.9% lower than national avg – 16th lowest
> Cost of living, 2021: 6.2% lower than national avg – 23rd lowest
> Population, 2022: 10,698,973
42. Florida
> “True cost” of a Big Mac considering income and cost of living: $4.45
> Actual price of a Big Mac, Aug 2023: $4.29, 17.0% lower than national avg price – 6th lowest
> Disposable income, 2022: $54,596, 2.2% lower than national avg – 21st highest
> Cost of living, 2021: 1.4% higher than national avg – 15th highest
> Population, 2022: 22,244,823
[in-text-ad-2]
41. Indiana
> “True cost” of a Big Mac considering income and cost of living: $4.48
> Actual price of a Big Mac, Aug 2023: $4.40, 14.9% lower than national avg price – 8th lowest
> Disposable income, 2022: $50,796, 9.0% lower than national avg – 19th lowest
> Cost of living, 2021: 7.3% lower than national avg – 20th lowest
> Population, 2022: 6,833,037
40. Iowa
> “True cost” of a Big Mac considering income and cost of living: $4.50
> Actual price of a Big Mac, Aug 2023: $4.69, 9.3% lower than national avg price – 17th lowest
> Disposable income, 2022: $52,071, 6.7% lower than national avg – 20th lowest
> Cost of living, 2021: 10.4% lower than national avg – 5th lowest
> Population, 2022: 3,200,517
[in-text-ad]
39. Wisconsin
> “True cost” of a Big Mac considering income and cost of living: $4.51
> Actual price of a Big Mac, Aug 2023: $4.59, 11.2% lower than national avg price – 13th lowest
> Disposable income, 2022: $53,062, 5.0% lower than national avg – 25th highest
> Cost of living, 2021: 6.7% lower than national avg – 21st lowest
> Population, 2022: 5,892,539
[recirclink id=1187269]
38. Nevada
> “True cost” of a Big Mac considering income and cost of living: $4.51
> Actual price of a Big Mac, Aug 2023: $4.49, 13.2% lower than national avg price – 11th lowest
> Disposable income, 2022: $53,076, 4.9% lower than national avg – 24th highest
> Cost of living, 2021: 4.5% lower than national avg – 25th highest
> Population, 2022: 3,177,772
37. Minnesota
> “True cost” of a Big Mac considering income and cost of living: $4.60
> Actual price of a Big Mac, Aug 2023: $4.80, 7.2% lower than national avg price – 21st lowest
> Disposable income, 2022: $57,359, 2.7% higher than national avg – 16th highest
> Cost of living, 2021: 1.6% lower than national avg – 19th highest
> Population, 2022: 5,717,184
[in-text-ad-2]
36. Utah
> “True cost” of a Big Mac considering income and cost of living: $4.67
> Actual price of a Big Mac, Aug 2023: $4.39, 15.1% lower than national avg price – 7th lowest
> Disposable income, 2022: $49,632, 11.1% lower than national avg – 15th lowest
> Cost of living, 2021: 5.4% lower than national avg – 25th lowest
> Population, 2022: 3,380,800

35. North Dakota
> “True cost” of a Big Mac considering income and cost of living: $4.67
> Actual price of a Big Mac, Aug 2023: $5.39, 4.3% higher than national avg price – 17th highest
> Disposable income, 2022: $58,659, 5.1% higher than national avg – 13th highest
> Cost of living, 2021: 8.9% lower than national avg – 11th lowest
> Population, 2022: 779,261
[in-text-ad]
34. Oklahoma
> “True cost” of a Big Mac considering income and cost of living: $4.79
> Actual price of a Big Mac, Aug 2023: $4.69, 9.3% lower than national avg price – 17th lowest
> Disposable income, 2022: $49,398, 11.5% lower than national avg – 12th lowest
> Cost of living, 2021: 9.7% lower than national avg – 8th lowest
> Population, 2022: 4,019,800
[recirclink id=1316240]
33. Louisiana
> “True cost” of a Big Mac considering income and cost of living: $4.89
> Actual price of a Big Mac, Aug 2023: $4.69, 9.3% lower than national avg price – 17th lowest
> Disposable income, 2022: $48,882, 12.4% lower than national avg – 9th lowest
> Cost of living, 2021: 8.7% lower than national avg – 13th lowest
> Population, 2022: 4,590,241
32. Virginia
> “True cost” of a Big Mac considering income and cost of living: $4.93
> Actual price of a Big Mac, Aug 2023: $4.99, 3.5% lower than national avg price – 24th lowest
> Disposable income, 2022: $57,789, 3.5% higher than national avg – 15th highest
> Cost of living, 2021: 2.3% higher than national avg – 13th highest
> Population, 2022: 8,683,619
[in-text-ad-2]
31. Tennessee
> “True cost” of a Big Mac considering income and cost of living: $4.94
> Actual price of a Big Mac, Aug 2023: $5.09, 1.5% lower than national avg price – 25th highest
> Disposable income, 2022: $52,262, 6.4% lower than national avg – 22nd lowest
> Cost of living, 2021: 9.1% lower than national avg – 10th lowest
> Population, 2022: 7,051,339

30. Connecticut
> “True cost” of a Big Mac considering income and cost of living: $5.04
> Actual price of a Big Mac, Aug 2023: $6.09, 17.8% higher than national avg price – 6th highest
> Disposable income, 2022: $69,247, 24.0% higher than national avg – 2nd highest
> Cost of living, 2021: 2.6% higher than national avg – 11th highest
> Population, 2022: 3,626,205
[in-text-ad]
29. Kentucky
> “True cost” of a Big Mac considering income and cost of living: $5.07
> Actual price of a Big Mac, Aug 2023: $4.69, 9.3% lower than national avg price – 17th lowest
> Disposable income, 2022: $46,016, 17.6% lower than national avg – 4th lowest
> Cost of living, 2021: 10.9% lower than national avg – 3rd lowest
> Population, 2022: 4,512,310
[recirclink id=1304208]
28. Michigan
> “True cost” of a Big Mac considering income and cost of living: $5.12
> Actual price of a Big Mac, Aug 2023: $4.79, 7.4% lower than national avg price – 20th lowest
> Disposable income, 2022: $49,256, 11.8% lower than national avg – 10th lowest
> Cost of living, 2021: 5.7% lower than national avg – 24th lowest
> Population, 2022: 10,034,118
27. New York
> “True cost” of a Big Mac considering income and cost of living: $5.12
> Actual price of a Big Mac, Aug 2023: $5.29, 2.3% higher than national avg price – 21st highest
> Disposable income, 2022: $63,118, 13.0% higher than national avg – 7th highest
> Cost of living, 2021: 9.5% higher than national avg – 3rd highest
> Population, 2022: 19,677,151
[in-text-ad-2]
26. Alabama
> “True cost” of a Big Mac considering income and cost of living: $5.13
> Actual price of a Big Mac, Aug 2023: $4.70, 9.1% lower than national avg price – 18th lowest
> Disposable income, 2022: $45,079, 19.3% lower than national avg – 3rd lowest
> Cost of living, 2021: 11.9% lower than national avg – 2nd lowest
> Population, 2022: 5,074,296
25. Maryland
> “True cost” of a Big Mac considering income and cost of living: $5.19
> Actual price of a Big Mac, Aug 2023: $5.19, 0.4% higher than national avg price – 22nd highest
> Disposable income, 2022: $59,307, 6.2% higher than national avg – 12th highest
> Cost of living, 2021: 6.2% higher than national avg – 7th highest
> Population, 2022: 6,164,660
[in-text-ad]
24. Colorado
> “True cost” of a Big Mac considering income and cost of living: $5.20
> Actual price of a Big Mac, Aug 2023: $5.69, 10.1% higher than national avg price – 11th highest
> Disposable income, 2022: $62,984, 12.8% higher than national avg – 8th highest
> Cost of living, 2021: 3.0% higher than national avg – 10th highest
> Population, 2022: 5,839,926
[recirclink id=1319123]
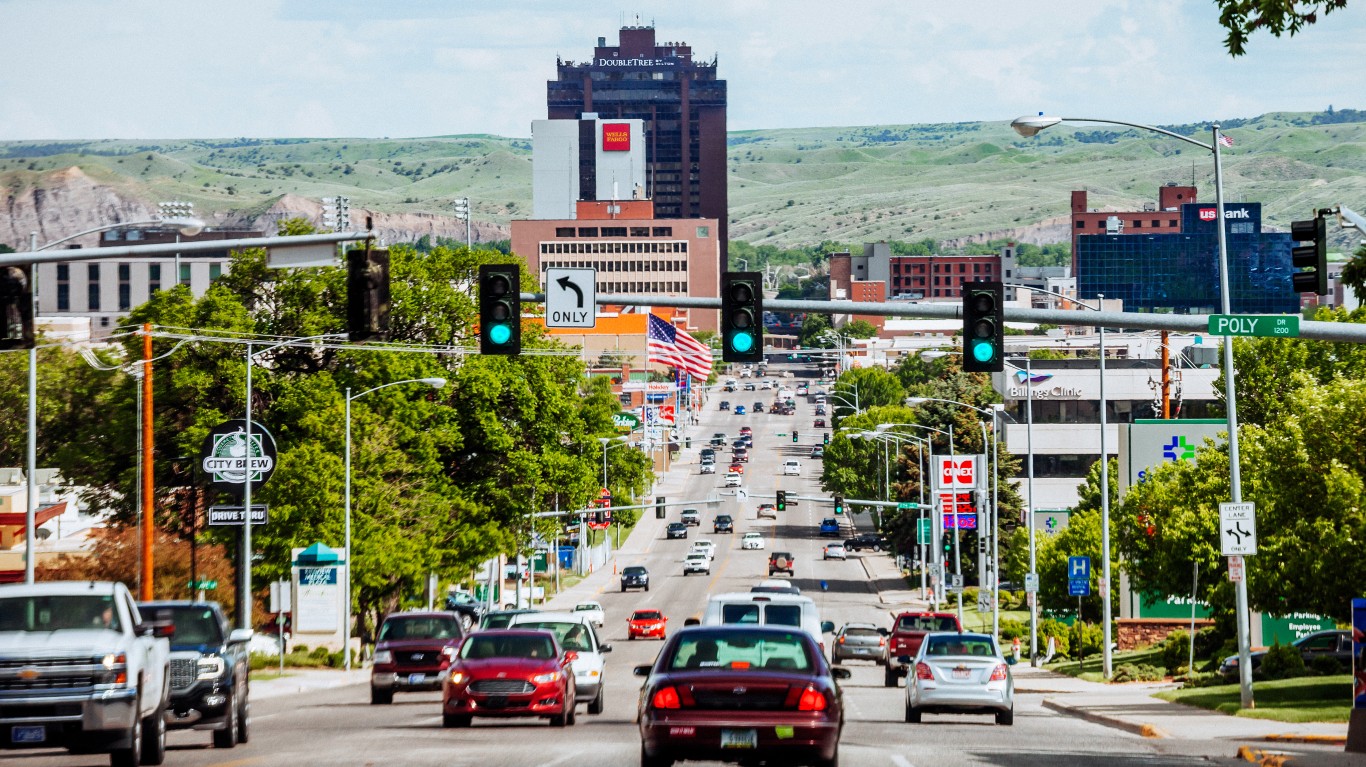
23. Montana
> “True cost” of a Big Mac considering income and cost of living: $5.31
> Actual price of a Big Mac, Aug 2023: $5.19, 0.4% higher than national avg price – 22nd highest
> Disposable income, 2022: $49,936, 10.6% lower than national avg – 17th lowest
> Cost of living, 2021: 8.4% lower than national avg – 15th lowest
> Population, 2022: 1,122,867

22. New Jersey
> “True cost” of a Big Mac considering income and cost of living: $5.36
> Actual price of a Big Mac, Aug 2023: $5.79, 12.0% higher than national avg price – 10th highest
> Disposable income, 2022: $65,844, 17.9% higher than national avg – 3rd highest
> Cost of living, 2021: 9.1% higher than national avg – 4th highest
> Population, 2022: 9,261,699
[in-text-ad-2]

21. Oregon
> “True cost” of a Big Mac considering income and cost of living: $5.39
> Actual price of a Big Mac, Aug 2023: $5.00, 3.3% lower than national avg price – 25th lowest
> Disposable income, 2022: $53,361, 4.4% lower than national avg – 23rd highest
> Cost of living, 2021: 3.0% higher than national avg – 9th highest
> Population, 2022: 4,240,137
20. Texas
> “True cost” of a Big Mac considering income and cost of living: $5.41
> Actual price of a Big Mac, Aug 2023: $5.36, 3.7% higher than national avg price – 19th highest
> Disposable income, 2022: $54,488, 2.4% lower than national avg – 22nd highest
> Cost of living, 2021: 1.5% lower than national avg – 18th highest
> Population, 2022: 30,029,572
[in-text-ad]
19. New Mexico
> “True cost” of a Big Mac considering income and cost of living: $5.41
> Actual price of a Big Mac, Aug 2023: $4.99, 3.5% lower than national avg price – 24th lowest
> Disposable income, 2022: $46,270, 17.1% lower than national avg – 6th lowest
> Cost of living, 2021: 10.1% lower than national avg – 6th lowest
> Population, 2022: 2,113,344
[recirclink id=1254498]
18. South Carolina
> “True cost” of a Big Mac considering income and cost of living: $5.48
> Actual price of a Big Mac, Aug 2023: $4.89, 5.4% lower than national avg price – 22nd lowest
> Disposable income, 2022: $46,720, 16.3% lower than national avg – 7th lowest
> Cost of living, 2021: 6.3% lower than national avg – 22nd lowest
> Population, 2022: 5,282,634

17. West Virginia
> “True cost” of a Big Mac considering income and cost of living: $5.52
> Actual price of a Big Mac, Aug 2023: $4.79, 7.4% lower than national avg price – 20th lowest
> Disposable income, 2022: $43,972, 21.2% lower than national avg – 2nd lowest
> Cost of living, 2021: 9.2% lower than national avg – 9th lowest
> Population, 2022: 1,775,156
[in-text-ad-2]
16. New Hampshire
> “True cost” of a Big Mac considering income and cost of living: $5.55
> Actual price of a Big Mac, Aug 2023: $6.29, 21.7% higher than national avg price – 3rd highest
> Disposable income, 2022: $64,826, 16.1% higher than national avg – 5th highest
> Cost of living, 2021: 2.5% higher than national avg – 12th highest
> Population, 2022: 1,395,231
15. Georgia
> “True cost” of a Big Mac considering income and cost of living: $5.56
> Actual price of a Big Mac, Aug 2023: $5.15, 0.4% lower than national avg price – 24th highest
> Disposable income, 2022: $49,538, 11.3% lower than national avg – 14th lowest
> Cost of living, 2021: 4.2% lower than national avg – 24th highest
> Population, 2022: 10,912,876
[in-text-ad]

14. Delaware
> “True cost” of a Big Mac considering income and cost of living: $5.69
> Actual price of a Big Mac, Aug 2023: $5.49, 6.2% higher than national avg price – 14th highest
> Disposable income, 2022: $52,591, 5.8% lower than national avg – 25th lowest
> Cost of living, 2021: 2.3% lower than national avg – 20th highest
> Population, 2022: 1,018,396
[recirclink id=1187269]
13. Idaho
> “True cost” of a Big Mac considering income and cost of living: $5.77
> Actual price of a Big Mac, Aug 2023: $5.39, 4.3% higher than national avg price – 17th highest
> Disposable income, 2022: $47,859, 14.3% lower than national avg – 8th lowest
> Cost of living, 2021: 8.2% lower than national avg – 17th lowest
> Population, 2022: 1,939,033
12. California
> “True cost” of a Big Mac considering income and cost of living: $5.82
> Actual price of a Big Mac, Aug 2023: $5.89, 13.9% higher than national avg price – 9th highest
> Disposable income, 2022: $63,219, 13.2% higher than national avg – 6th highest
> Cost of living, 2021: 11.8% higher than national avg – 2nd highest
> Population, 2022: 39,029,342
[in-text-ad-2]
11. Illinois
> “True cost” of a Big Mac considering income and cost of living: $5.90
> Actual price of a Big Mac, Aug 2023: $6.09, 17.8% higher than national avg price – 6th highest
> Disposable income, 2022: $58,437, 4.7% higher than national avg – 14th highest
> Cost of living, 2021: 1.4% higher than national avg – 16th highest
> Population, 2022: 12,582,032
10. Missouri
> “True cost” of a Big Mac considering income and cost of living: $5.92
> Actual price of a Big Mac, Aug 2023: $5.69, 10.1% higher than national avg price – 11th highest
> Disposable income, 2022: $49,367, 11.6% lower than national avg – 11th lowest
> Cost of living, 2021: 8.0% lower than national avg – 18th lowest
> Population, 2022: 6,177,957
[in-text-ad]
9. Arkansas
> “True cost” of a Big Mac considering income and cost of living: $5.93
> Actual price of a Big Mac, Aug 2023: $5.49, 6.2% higher than national avg price – 14th highest
> Disposable income, 2022: $46,218, 17.2% lower than national avg – 5th lowest
> Cost of living, 2021: 10.6% lower than national avg – 4th lowest
> Population, 2022: 3,045,637
[recirclink id=1316240]
8. Rhode Island
> “True cost” of a Big Mac considering income and cost of living: $6.06
> Actual price of a Big Mac, Aug 2023: $5.99, 15.9% higher than national avg price – 8th highest
> Disposable income, 2022: $56,289, 0.8% higher than national avg – 17th highest
> Cost of living, 2021: 2.1% higher than national avg – 14th highest
> Population, 2022: 1,093,734
7. Massachusetts
> “True cost” of a Big Mac considering income and cost of living: $6.09
> Actual price of a Big Mac, Aug 2023: $7.09, 37.1% higher than national avg price – the highest
> Disposable income, 2022: $69,316, 24.2% higher than national avg – the highest
> Cost of living, 2021: 6.6% higher than national avg – 6th highest
> Population, 2022: 6,981,974
[in-text-ad-2]
6. Arizona
> “True cost” of a Big Mac considering income and cost of living: $6.10
> Actual price of a Big Mac, Aug 2023: $5.59, 8.1% higher than national avg price – 13th highest
> Disposable income, 2022: $49,493, 11.4% lower than national avg – 13th lowest
> Cost of living, 2021: 3.3% lower than national avg – 22nd highest
> Population, 2022: 7,359,197
5. Alaska
> “True cost” of a Big Mac considering income and cost of living: $6.11
> Actual price of a Big Mac, Aug 2023: $6.50, 25.7% higher than national avg price – 2nd highest
> Disposable income, 2022: $62,045, 11.1% higher than national avg – 10th highest
> Cost of living, 2021: 4.4% higher than national avg – 8th highest
> Population, 2022: 733,583
[in-text-ad]

4. Mississippi
> “True cost” of a Big Mac considering income and cost of living: $6.23
> Actual price of a Big Mac, Aug 2023: $5.40, 4.4% higher than national avg price – 16th highest
> Disposable income, 2022: $41,887, 25.0% lower than national avg – the lowest
> Cost of living, 2021: 13.4% lower than national avg – the lowest
> Population, 2022: 2,940,057
[recirclink id=1304208]
3. Vermont
> “True cost” of a Big Mac considering income and cost of living: $6.33
> Actual price of a Big Mac, Aug 2023: $6.29, 21.7% higher than national avg price – 3rd highest
> Disposable income, 2022: $54,714, 2.0% lower than national avg – 20th highest
> Cost of living, 2021: 1.3% lower than national avg – 17th highest
> Population, 2022: 647,064
2. Hawaii
> “True cost” of a Big Mac considering income and cost of living: $6.39
> Actual price of a Big Mac, Aug 2023: $5.31, 2.7% higher than national avg price – 20th highest
> Disposable income, 2022: $52,515, 5.9% lower than national avg – 24th lowest
> Cost of living, 2021: 13.2% higher than national avg – the highest
> Population, 2022: 1,440,196
[in-text-ad-2]
1. Maine
> “True cost” of a Big Mac considering income and cost of living: $6.54
> Actual price of a Big Mac, Aug 2023: $6.29, 21.7% higher than national avg price – 3rd highest
> Disposable income, 2022: $52,236, 6.4% lower than national avg – 21st lowest
> Cost of living, 2021: 2.8% lower than national avg – 21st highest
> Population, 2022: 1,385,340
Methodology
To identify the “true cost” of a Big Mac in each state, 24/7 Wall St. adjusted the average Big Mac price in each state by the state’s disposable income per capita (income after taxes) and cost of living (based on regional price parities). In other words, considering income, taxes, cost and living and actual Big Mac price in each state — we calculated the true cost of Big Mac. The 50 states were ranked by the “true cost” of a Big Mac.
Big Mac prices for each state and the national average price of $5.17 came from Zippia’s How Much A Big Mac Costs In Every State and are as of August 2023. Disposable income per capita figures, which are income per capita figures after taxes, are for 2022 and came from the Bureau of Labor Statistics. The national per capita disposable income was $55,832 that year. Regional price parities for 2021, which express the cost of living in the state, are from the Bureau of Economic Analysis. Population data came from the Census Bureau’s 2022 American Community Survey. We should note the idea came from Pantry and Larder, though we took a different approach.
Contact [email protected] for any questions or corrections.