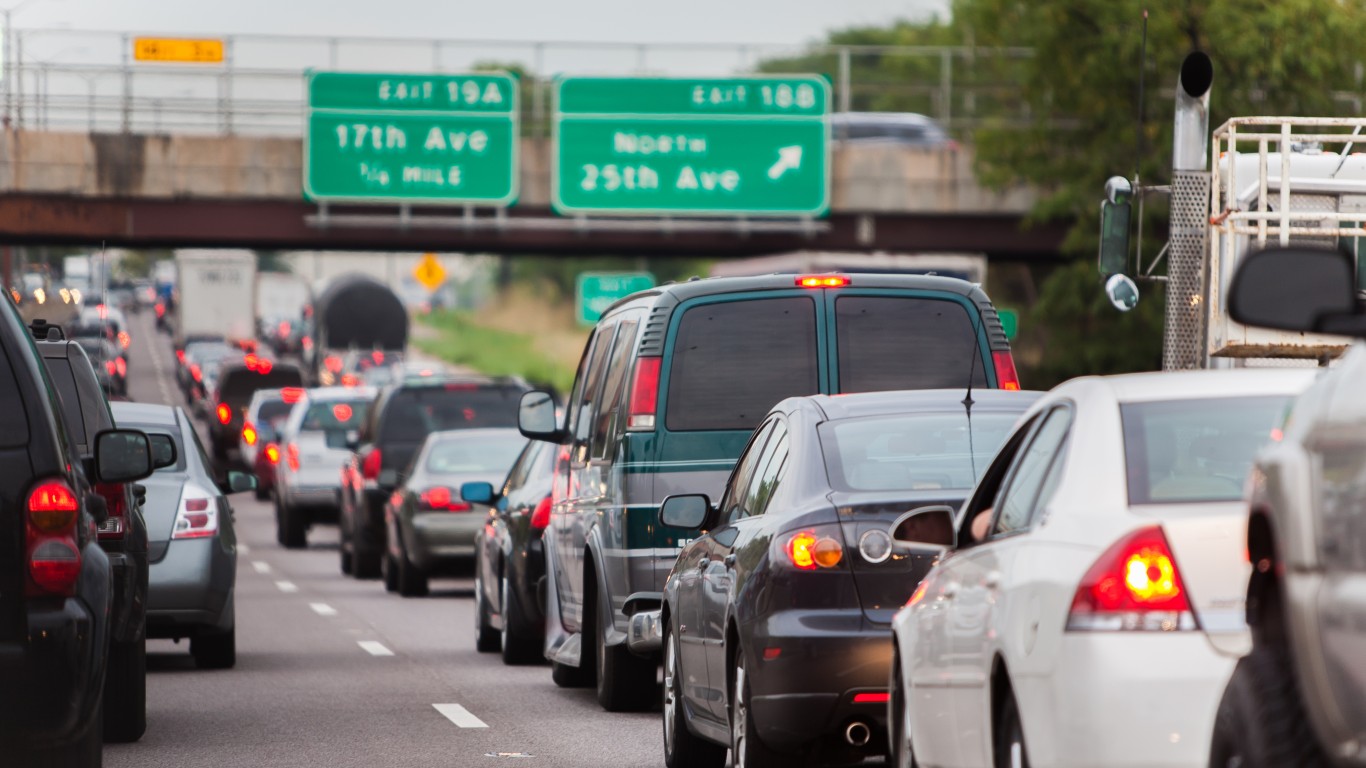
According to the U.S. Census Bureau, the average commute time in the United States is about 27 minutes. Over a week, this adds up to around four hours and 30 minutes, and more than 230 hours in a single year for the typical full-time worker. The number of Americans working from home surged during the pandemic. Many of those who still work remotely are likely reluctant to return to the office, if for no other reason than eliminating the daily commute.
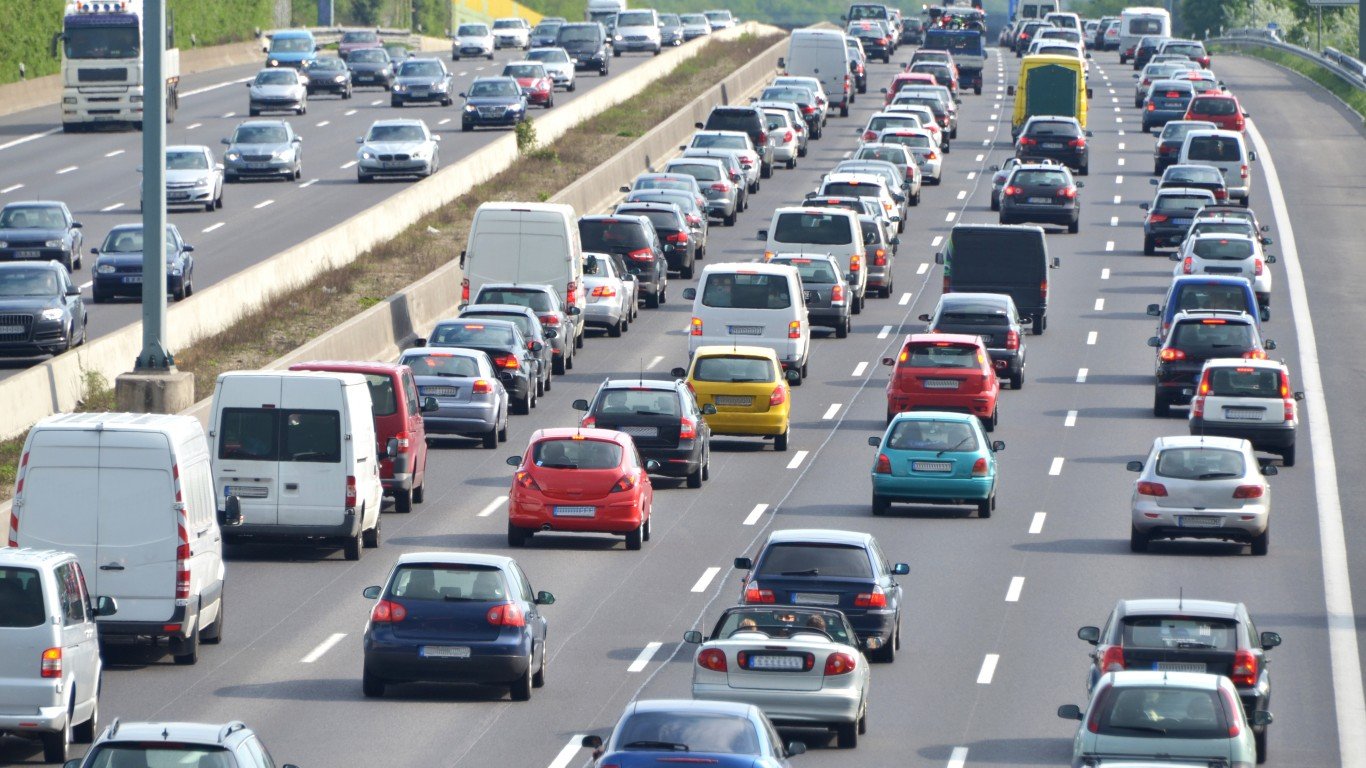
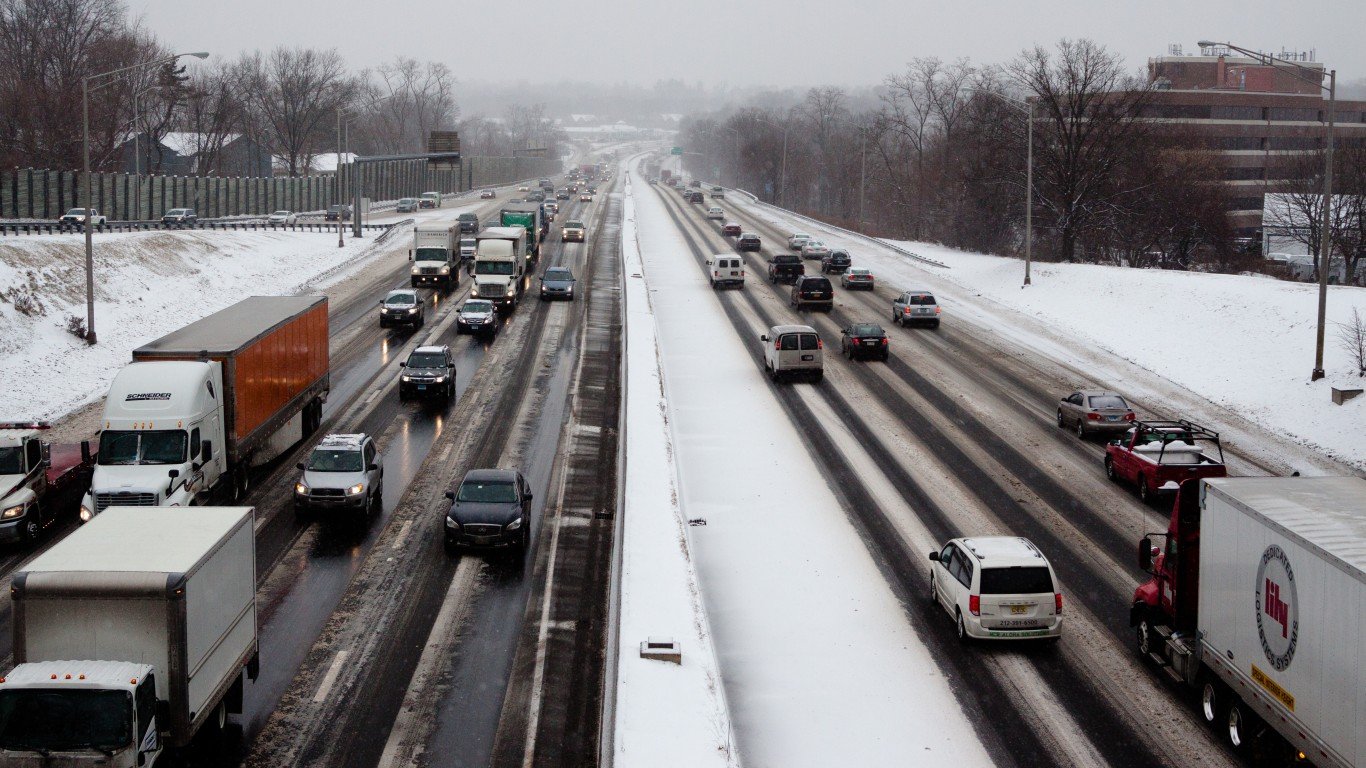
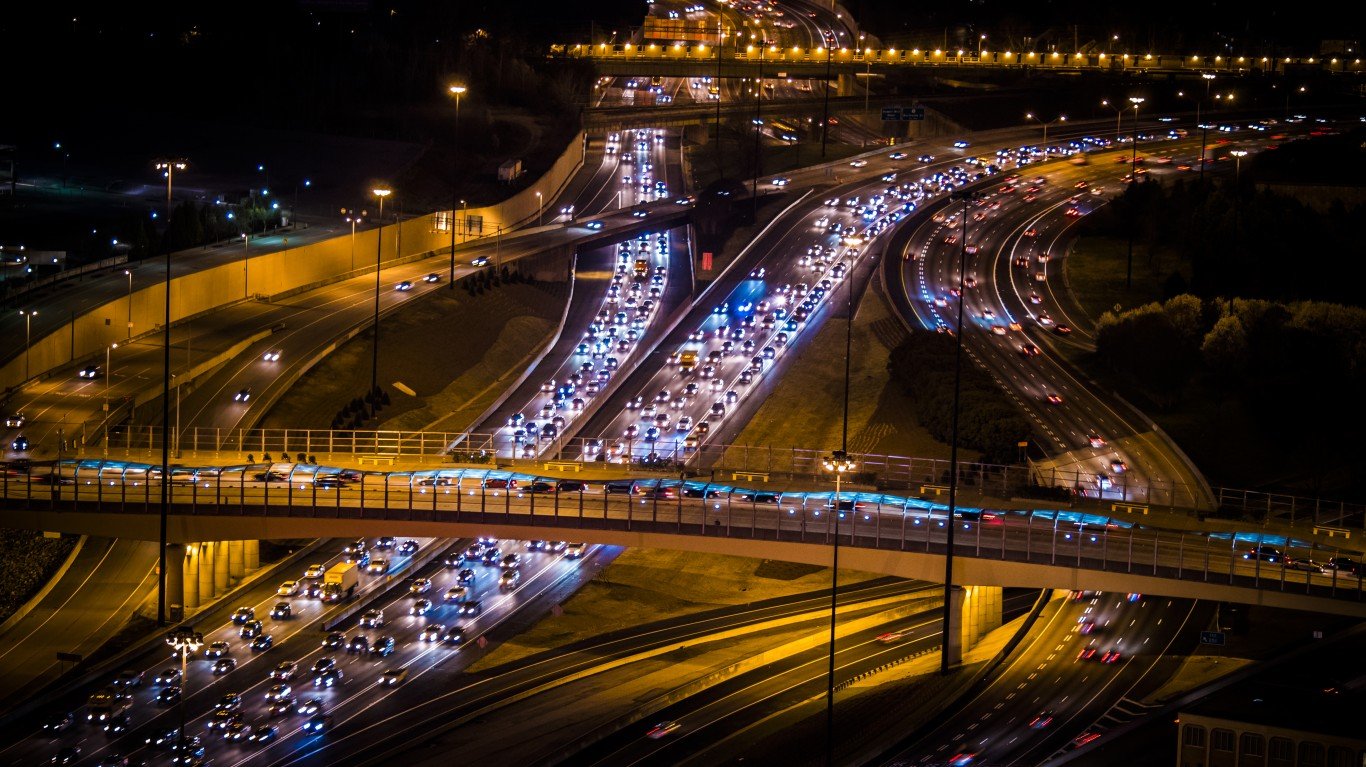
Commute times are not only a product of distance but also of roadway congestion. Rush hour traffic can add significantly to commute times and lead to increased fuel consumption and travel expenses. Many of those with jobs that take them in and out of densely populated urban areas are all too familiar with this reality. (Here is a look at every major automaker’s plan to go electric.)
24/7 Wall St. identified the city in every state with the worst traffic by using traffic and analytics company INRIX’s traffic data and analytics company. Cities are ranked on the average number of hours commuters lost due to traffic congestion in 2022. Due to a lack of available data, Alaska, South Dakota, Vermont, and Wyoming are not included in this analysis. Washington, D.C., is one of six places on this list that is home to only one city with available data. In these places, which are noted, the city listed ranks as having the worst traffic by default.
Depending on the state, the average time lost to traffic congestion each year ranges from only a few hours to well over 100 hours in the city with the worst traffic. While many of the cities on this list are also the largest in the state by population, there are some notable exceptions. For example, although Los Angeles is the largest city in California and second largest in the country – and also notorious for its congested roadways – there is another California city where traffic is even worse.
In nearly every city on this list, the average number of hours commuters spend sitting in traffic increased in 2022 compared to the previous year. This is likely largely due to easing pandemic restrictions and more workers returning to the office. In all but three cities on this list, traffic delays worsened from 2021 to 2022, by anywhere from 3% to 380%. (Here is a look at the worst city to drive in in each state.)
Here is the city with the worst traffic in each U.S. state
See below for our detailed methodology.
Alabama: Birmingham
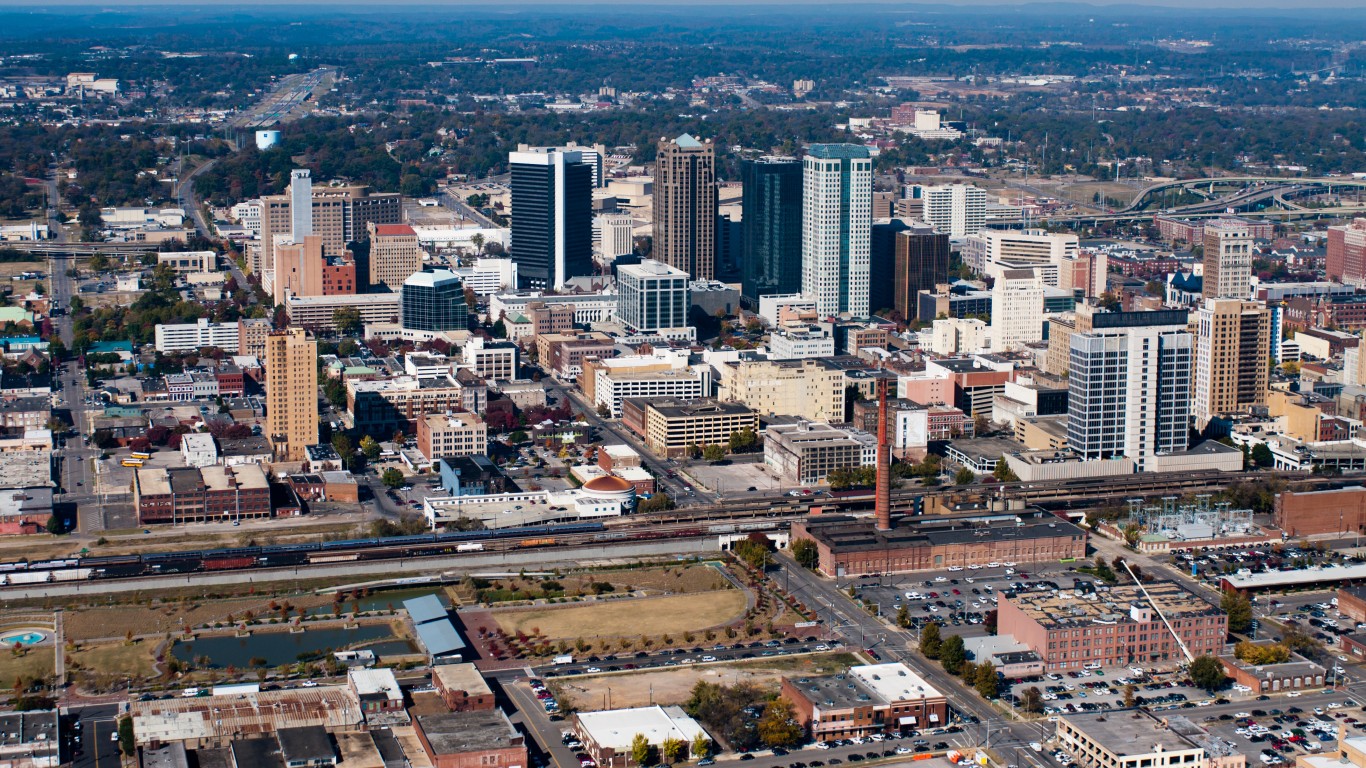
- Avg. time lost to traffic delays in 2022: 24 hours per commuter
- Overall national ranking: tied – 46th worst of 280 U.S. cities considered
- Change in traffic delays from 2021: +33%
- Avg. commute time in city: 22 minutes (State avg.: 25 minutes)
- Commuters who drive or carpool to work: 76,153; 92.8% of commuters
- Cities considered in state: 7
Arizona: Phoenix
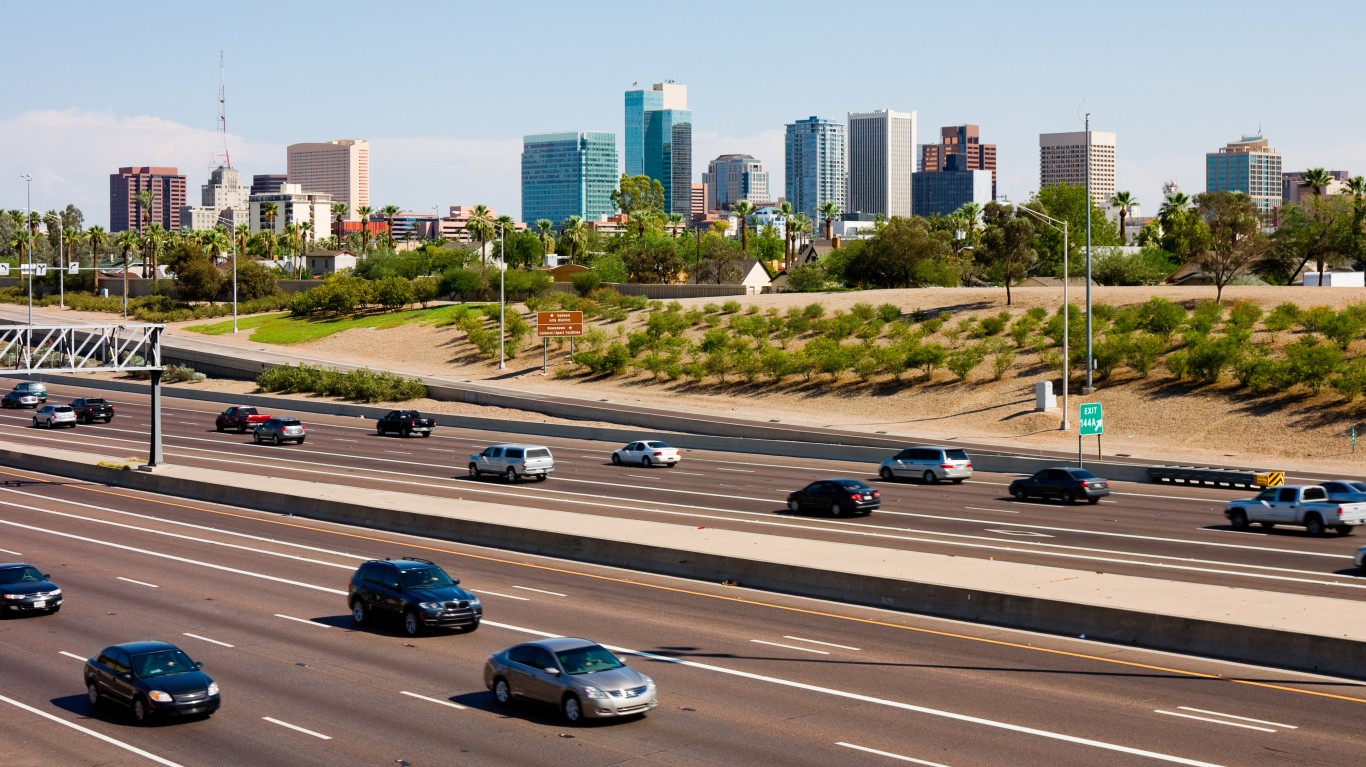
- Avg. time lost to traffic delays in 2022: 26 hours per commuter
- Overall national ranking: tied – 39th worst of 280 U.S. cities considered
- Change in traffic delays from 2021: +26%
- Avg. commute time in city: 26 minutes (State avg.: 26 minutes)
- Commuters who drive or carpool to work: 644,366; 93.0% of commuters
- Cities considered in state: 3
Arkansas: Little Rock
- Avg. time lost to traffic delays in 2022: 4 hours per commuter
- Overall national ranking: tied – 242nd worst of 280 U.S. cities considered
- Change in traffic delays from 2021: +20%
- Avg. commute time in city: 18 minutes (State avg.: 22 minutes)
- Commuters who drive or carpool to work: 86,748; 95.6% of commuters
- Cities considered in state: 2
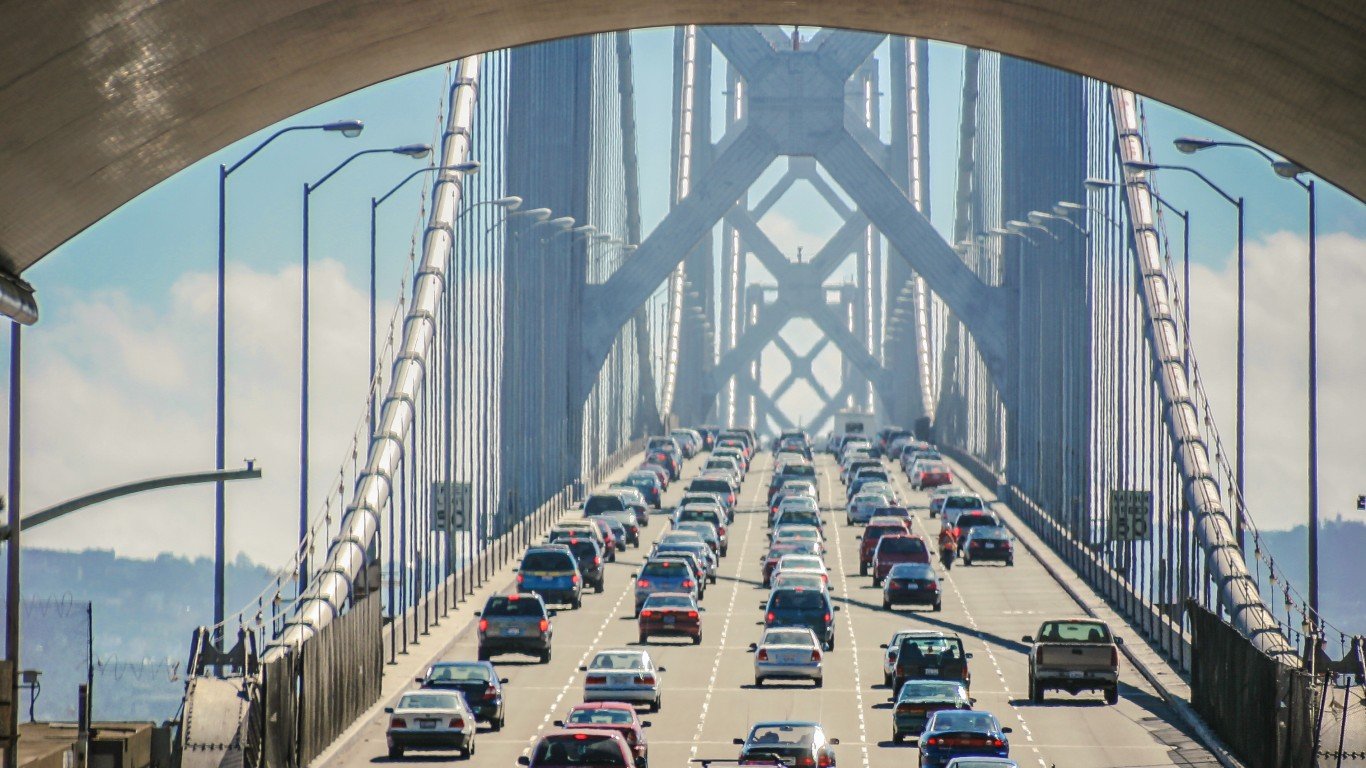
California: San Francisco
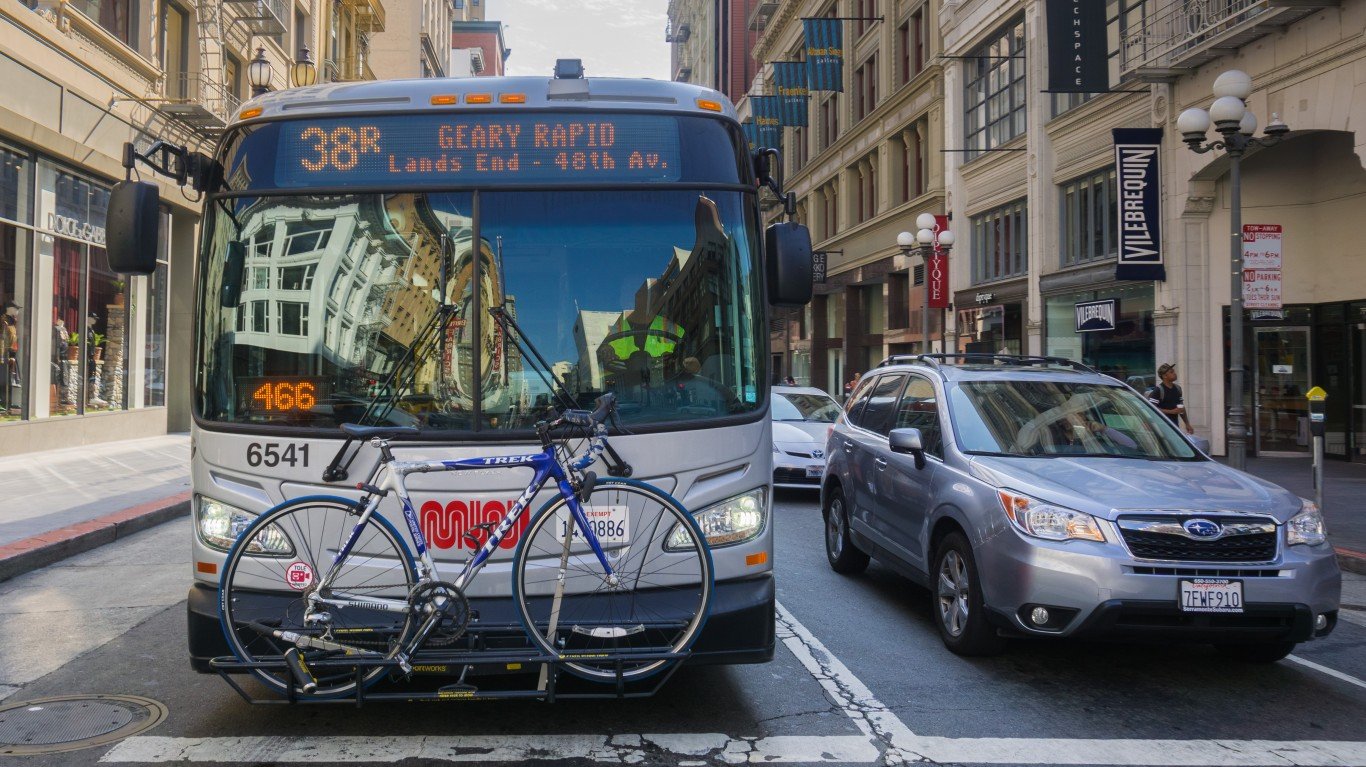
- Avg. time lost to traffic delays in 2022: 97 hours per commuter
- Overall national ranking: 6th worst of 280 U.S. cities considered
- Change in traffic delays from 2021: +52%
- Avg. commute time in city: 33 minutes (State avg.: 30 minutes)
- Commuters who drive or carpool to work: 179,667; 43.8% of commuters
- Cities considered in state: 30
Colorado: Denver
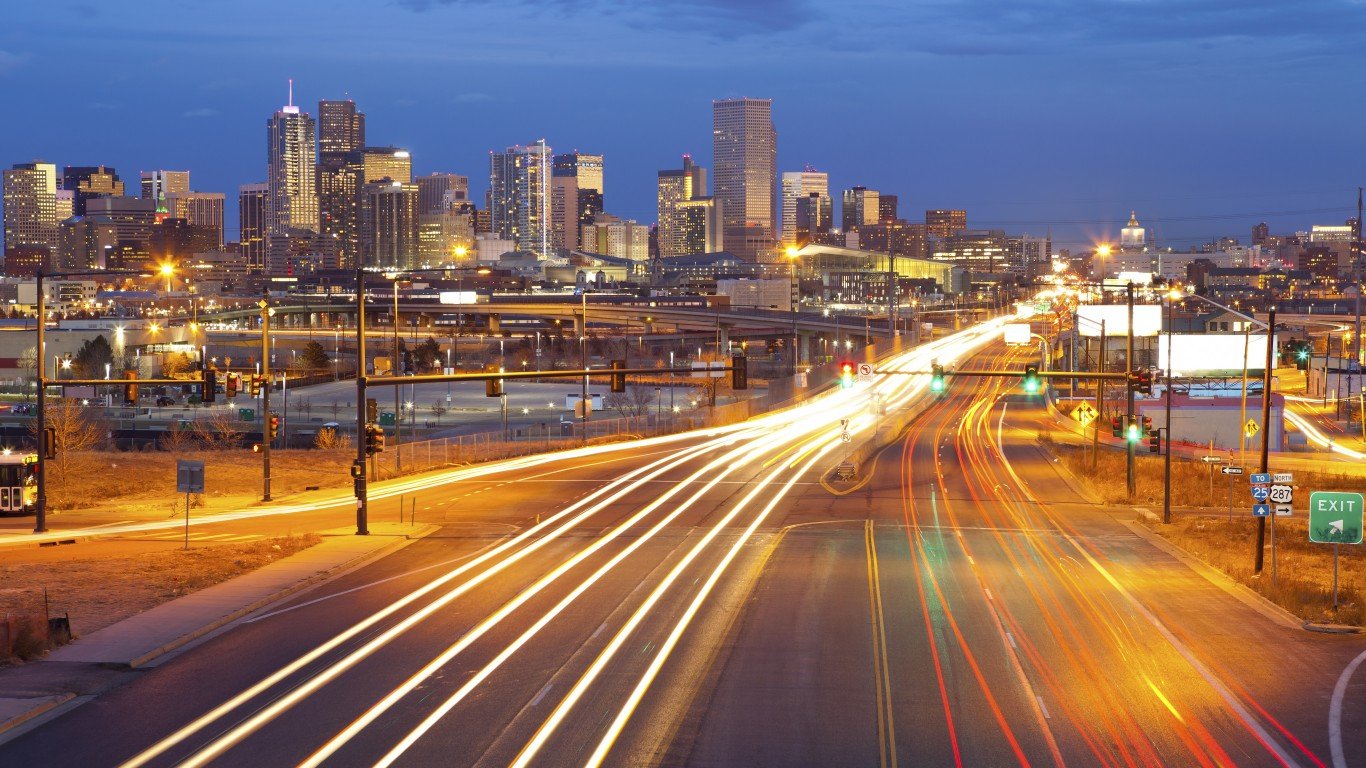
- Avg. time lost to traffic delays in 2022: 54 hours per commuter
- Overall national ranking: tied – 16th worst of 280 U.S. cities considered
- Change in traffic delays from 2021: +35%
- Avg. commute time in city: 26 minutes (State avg.: 26 minutes)
- Commuters who drive or carpool to work: 280,340; 84.0% of commuters
- Cities considered in state: 5
Connecticut: Stamford
- Avg. time lost to traffic delays in 2022: 73 hours per commuter
- Overall national ranking: 12th worst of 280 U.S. cities considered
- Change in traffic delays from 2021: +59%
- Avg. commute time in city: 28 minutes (State avg.: 27 minutes)
- Commuters who drive or carpool to work: 52,207; 80.0% of commuters
- Cities considered in state: 9
Delaware: Wilmington
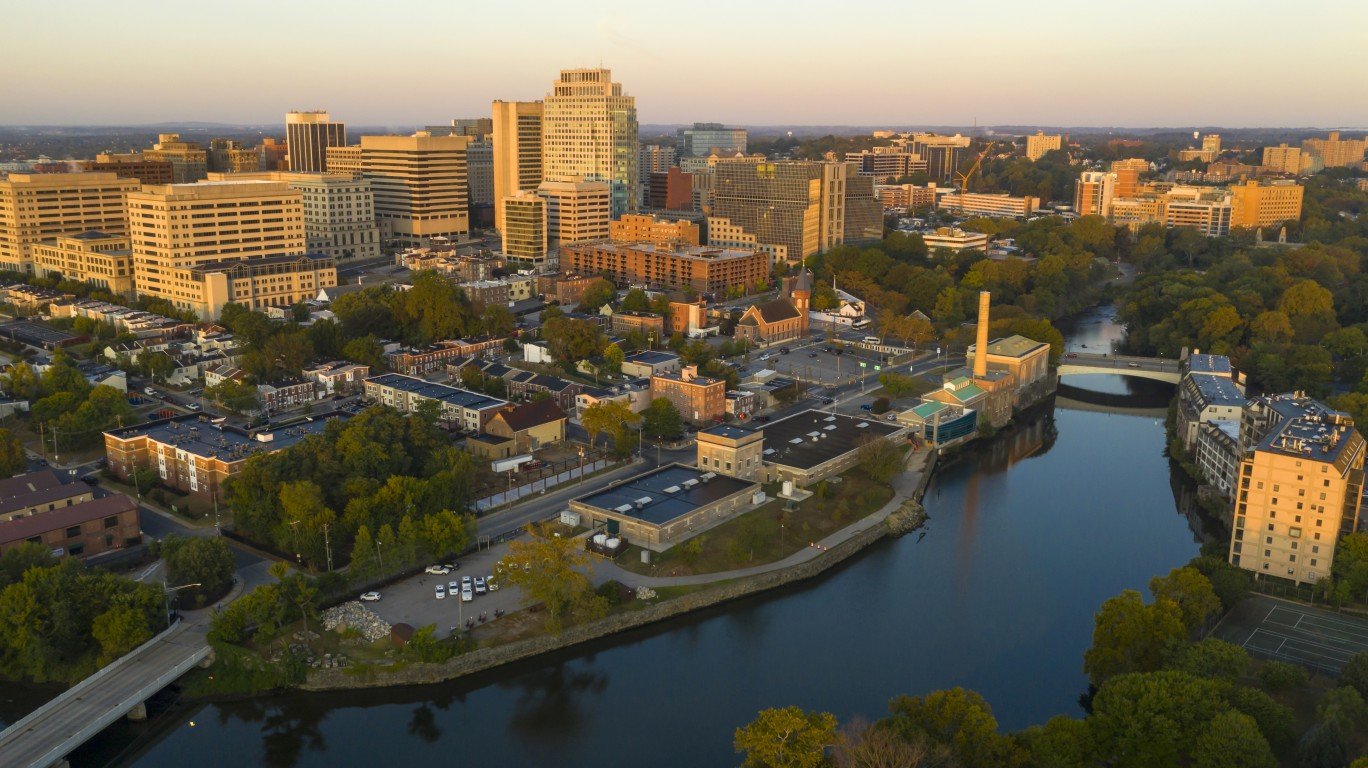
- Avg. time lost to traffic delays in 2022: 19 hours per commuter
- Overall national ranking: tied – 79th worst of 280 U.S. cities considered
- Change in traffic delays from 2021: +13%
- Avg. commute time in city: 23 minutes (State avg.: 26 minutes)
- Commuters who drive or carpool to work: 23,321; 79.4% of commuters
- Cities considered in state: 3
District of Columbia: Washington
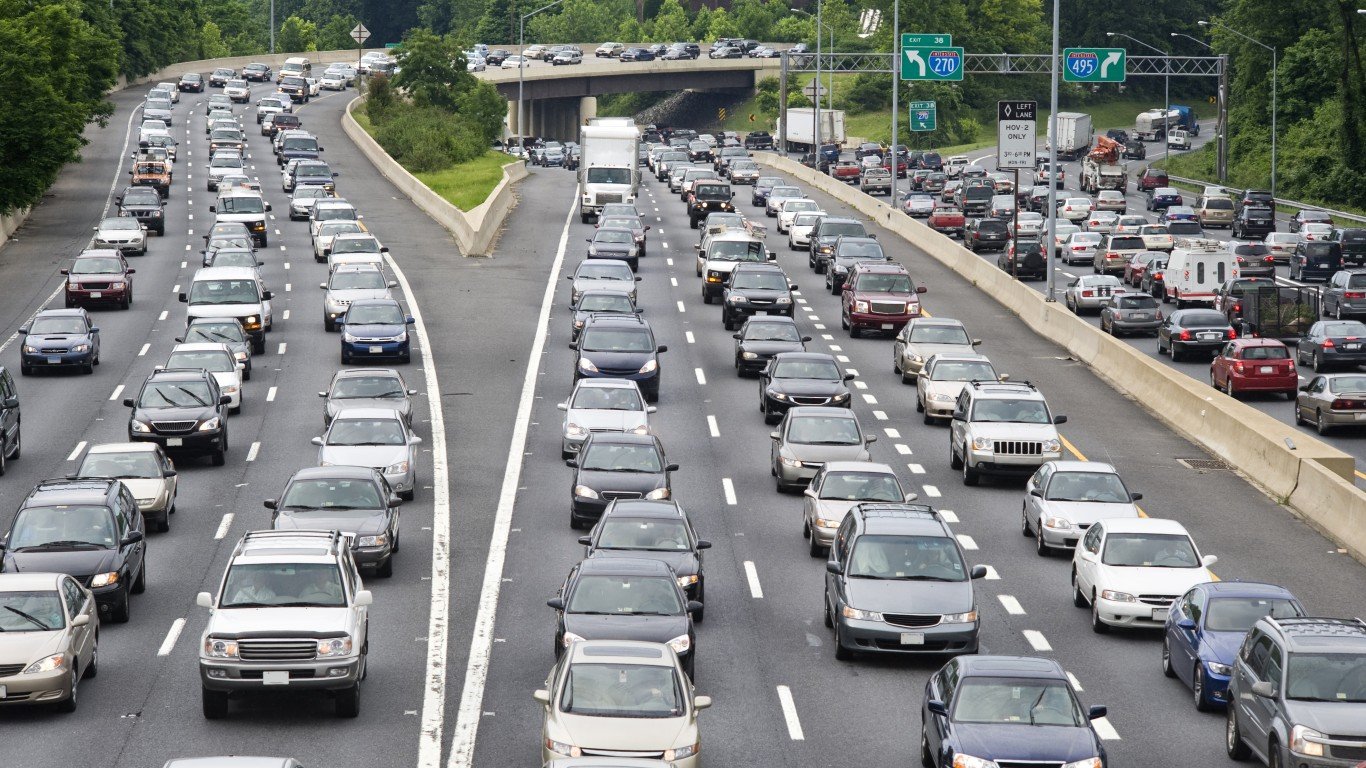
- Avg. time lost to traffic delays in 2022: 83 hours per commuter
- Overall national ranking: 8th worst of 280 U.S. cities considered
- Change in traffic delays from 2021: +88%
- Avg. commute time in city: 30 minutes
- Commuters who drive or carpool to work: 131,329; 44.2% of commuters
- Cities considered in region: 1
Because Washington is the only city in the District of Columbia, it ranks as having the worst traffic by default.
Florida: Miami
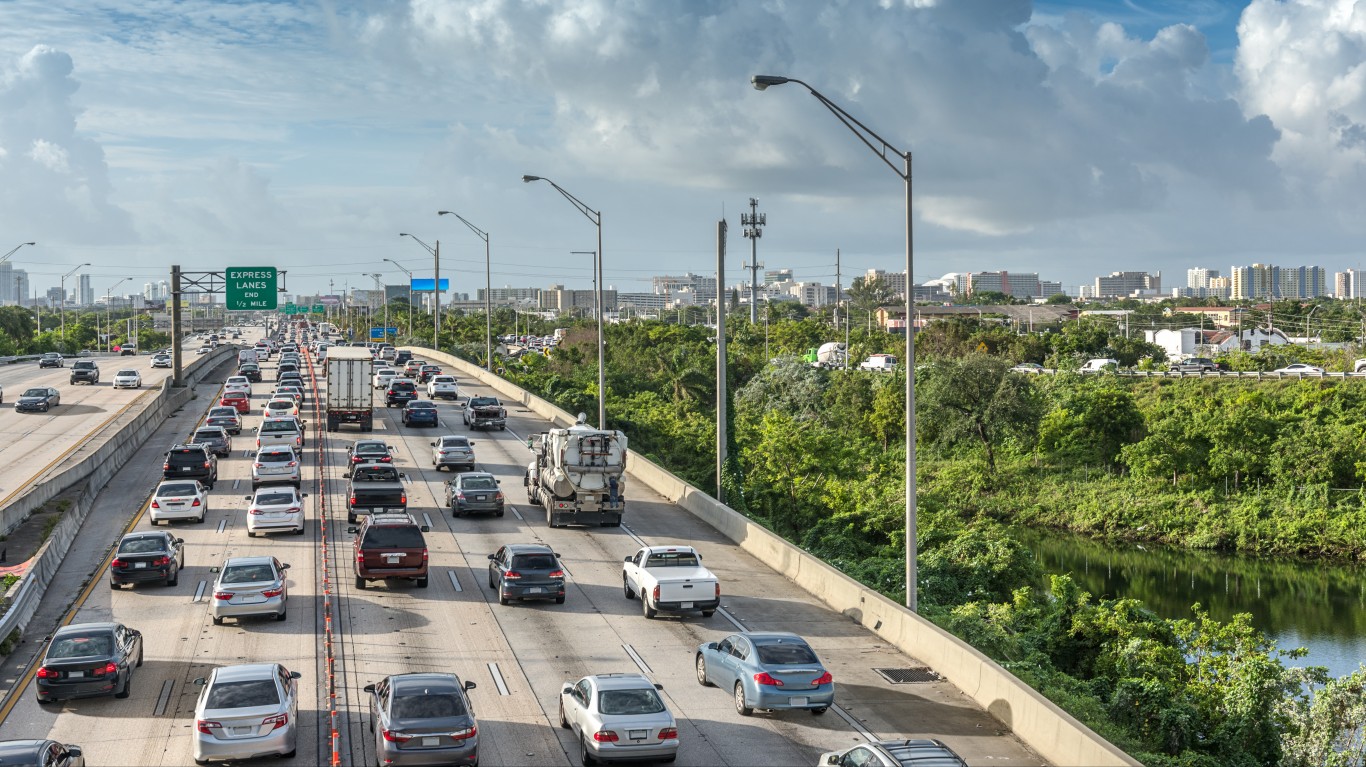
- Avg. time lost to traffic delays in 2022: 105 hours per commuter
- Overall national ranking: 5th worst of 280 U.S. cities considered
- Change in traffic delays from 2021: +59%
- Avg. commute time in city: 28 minutes (State avg.: 28 minutes)
- Commuters who drive or carpool to work: 165,042; 81.8% of commuters
- Cities considered in state: 22
Georgia: Atlanta
- Avg. time lost to traffic delays in 2022: 74 hours per commuter
- Overall national ranking: tied – 10th worst of 280 U.S. cities considered
- Change in traffic delays from 2021: +40%
- Avg. commute time in city: 28 minutes (State avg.: 29 minutes)
- Commuters who drive or carpool to work: 163,636; 79.4% of commuters
- Cities considered in state: 8
Hawaii: Hilo

- Avg. time lost to traffic delays in 2022: 29 hours per commuter
- Overall national ranking: tied – 33rd worst of 280 U.S. cities considered
- Change in traffic delays from 2021: +380%
- Avg. commute time in city: 19 minutes (State avg.: 27 minutes)
- Commuters who drive or carpool to work: 17,622; 94.6% of commuters
- Cities considered in state: 3
Idaho: Boise
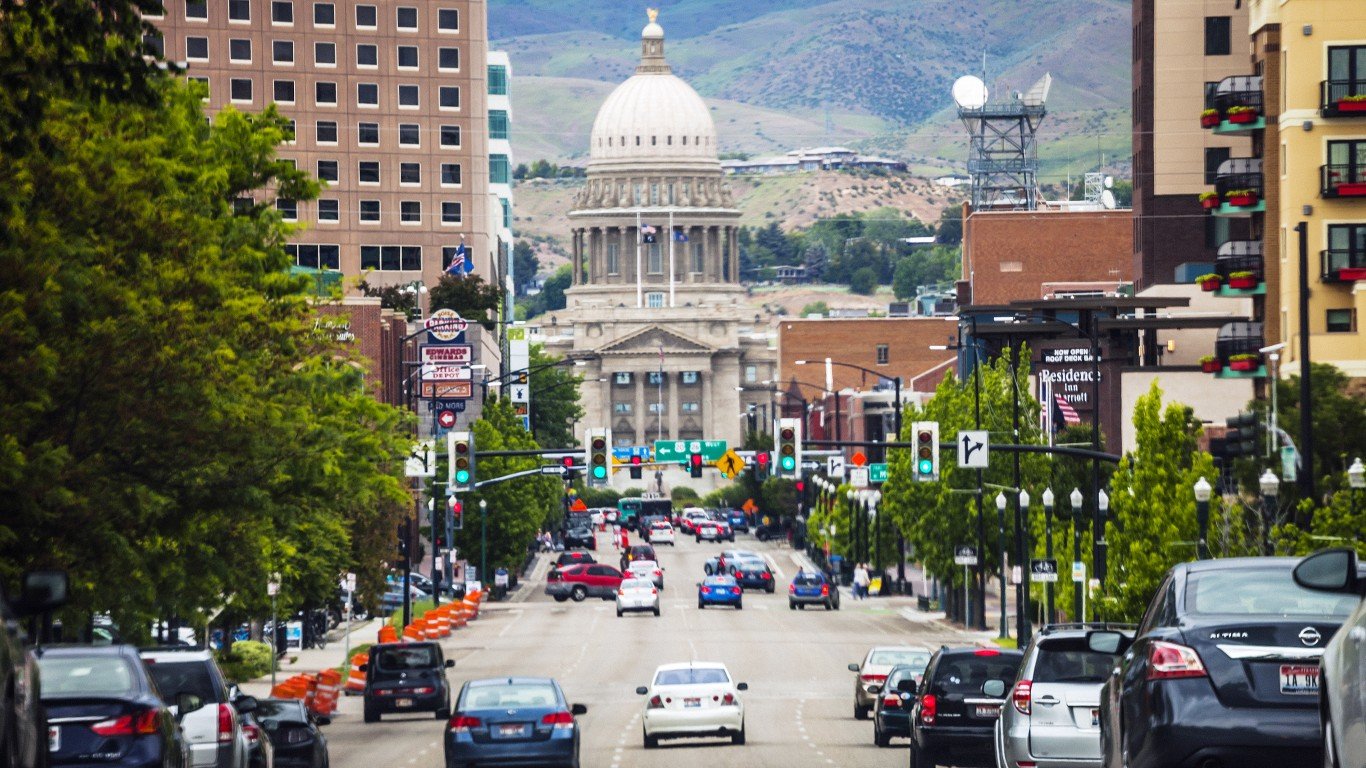
- Avg. time lost to traffic delays in 2022: 7 hours per commuter
- Overall national ranking: tied – 205th worst of 280 U.S. cities considered
- Change in traffic delays from 2021: +3%
- Avg. commute time in city: 19 minutes (State avg.: 21 minutes)
- Commuters who drive or carpool to work: 100,272; 91.4% of commuters
- Cities considered in state: 1
Because Boise is the only city with available data in Idaho, it ranks as having the worst traffic by default.
Illinois: Chicago
- Avg. time lost to traffic delays in 2022: 155 hours per commuter
- Overall national ranking: the worst of 280 U.S. cities considered
- Change in traffic delays from 2021: +49%
- Avg. commute time in city: 34 minutes (State avg.: 29 minutes)
- Commuters who drive or carpool to work: 743,250; 62.7% of commuters
- Cities considered in state: 7
Indiana: Indianapolis
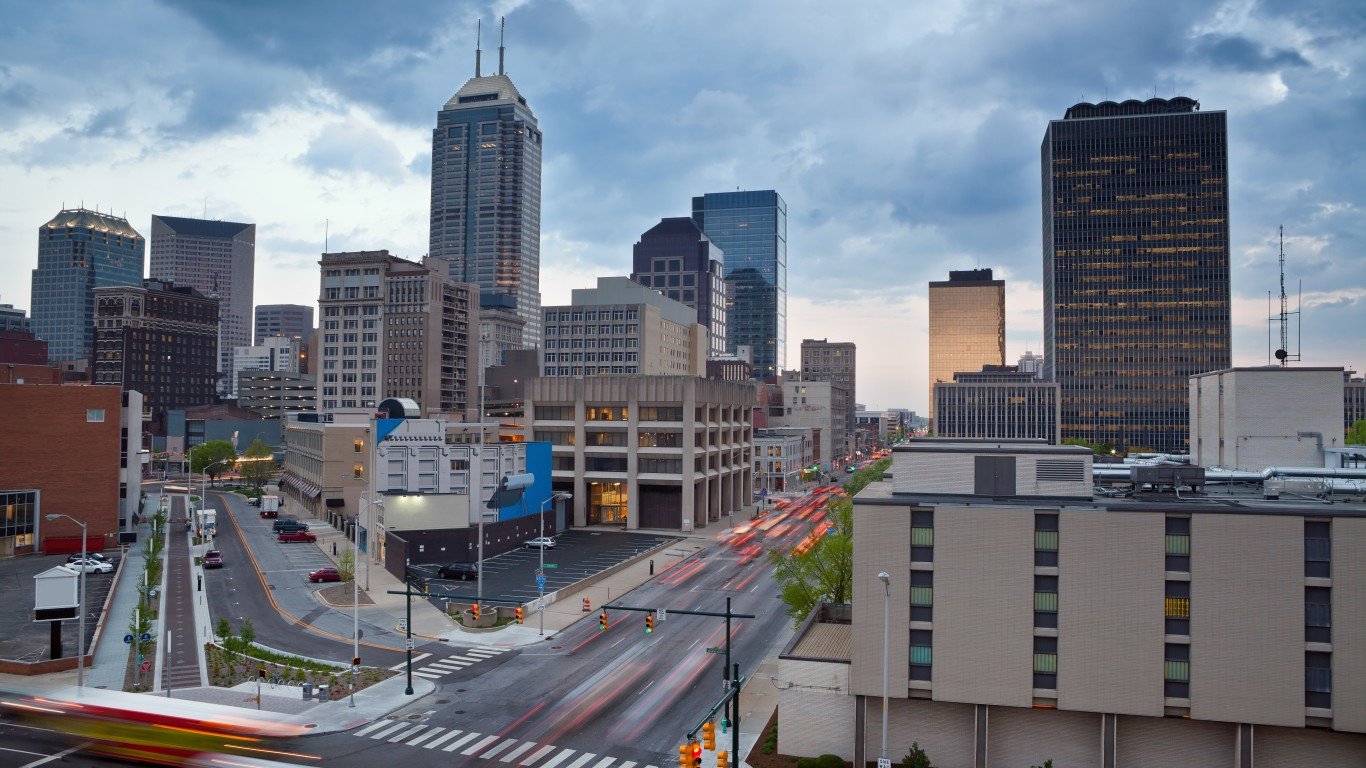
- Avg. time lost to traffic delays in 2022: 24 hours per commuter
- Overall national ranking: tied – 46th worst of 280 U.S. cities considered
- Change in traffic delays from 2021: +71%
- Avg. commute time in city: 24 minutes (State avg.: 24 minutes)
- Commuters who drive or carpool to work: 368,371; 94.8% of commuters
- Cities considered in state: 7
Iowa: Des Moines
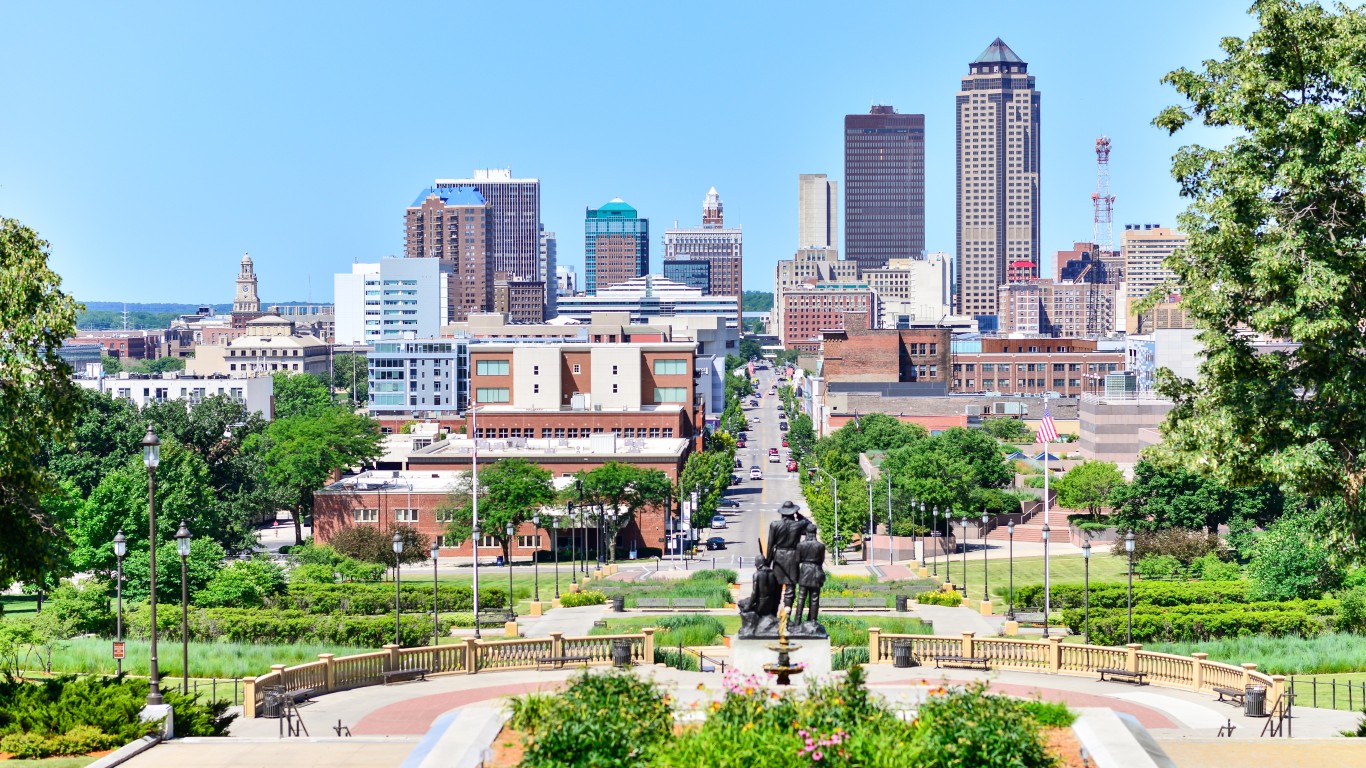
- Avg. time lost to traffic delays in 2022: 7 hours per commuter
- Overall national ranking: tied – 205th worst of 280 U.S. cities considered
- Change in traffic delays from 2021: +3%
- Avg. commute time in city: 19 minutes (State avg.: 20 minutes)
- Commuters who drive or carpool to work: 93,450; 93.7% of commuters
- Cities considered in state: 1
Because Des Moines is the only city with available data in Iowa, it ranks as having the worst traffic by default.
Kansas: Topeka
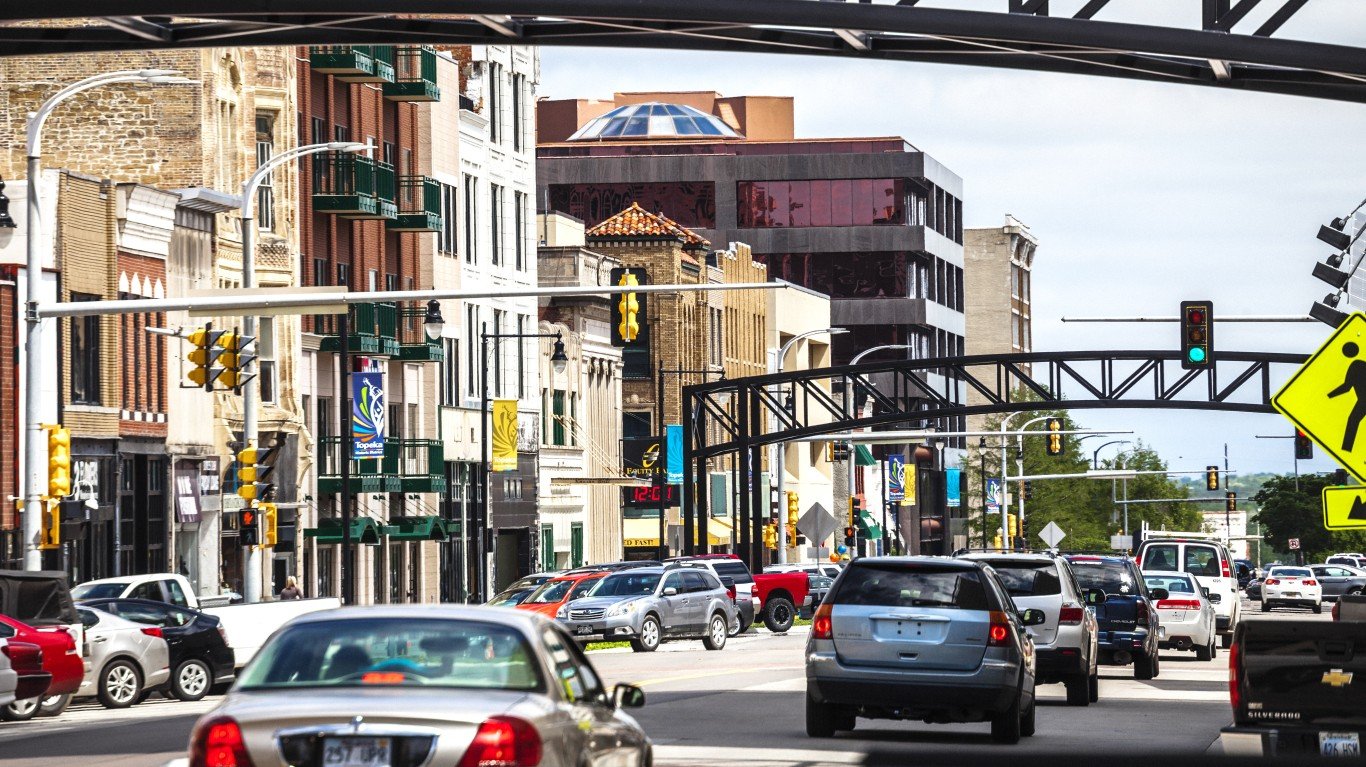
- Avg. time lost to traffic delays in 2022: 0 hours per commuter
- Overall national ranking: tied – 274th worst of 280 U.S. cities considered
- Change in traffic delays from 2021: +0%
- Avg. commute time in city: 17 minutes (State avg.: 20 minutes)
- Commuters who drive or carpool to work: 52,509; 95.8% of commuters
- Cities considered in state: 2
Kentucky: Lexington
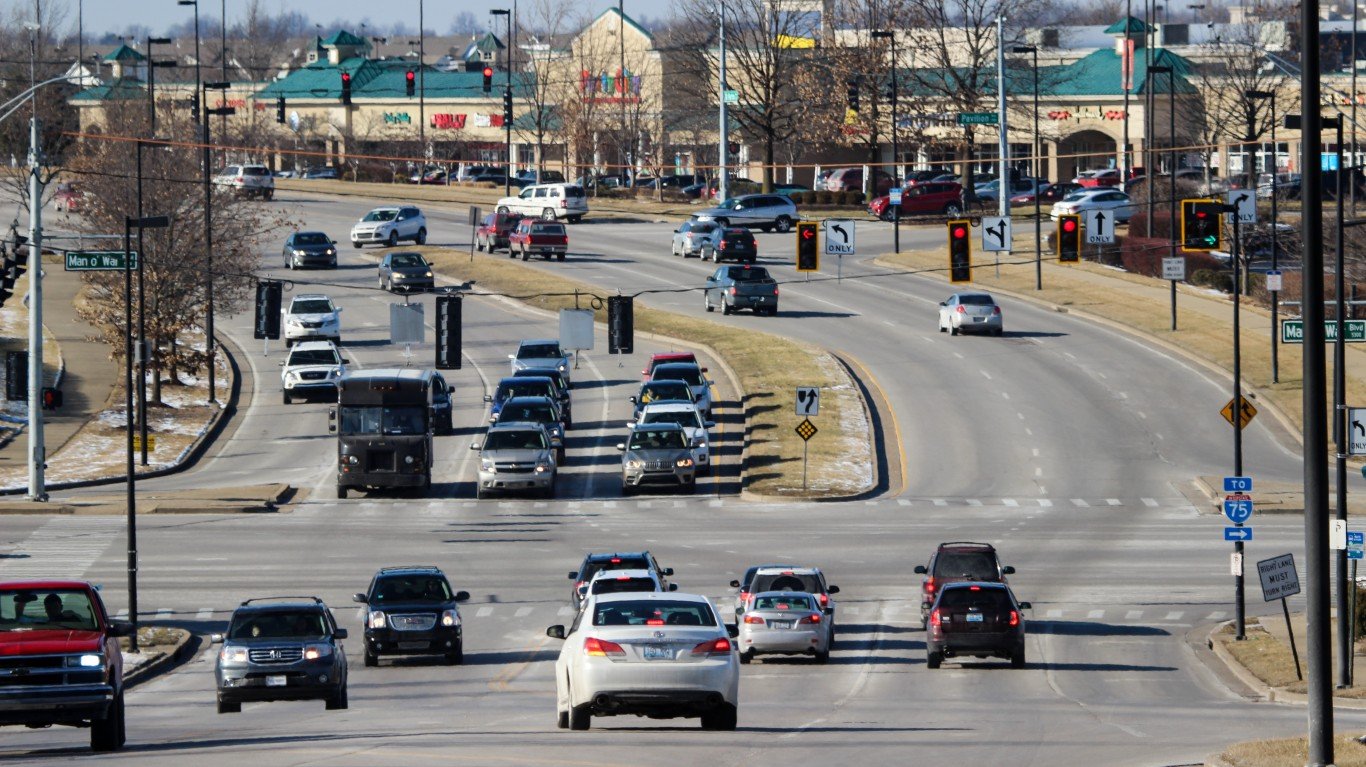
- Avg. time lost to traffic delays in 2022: 22 hours per commuter
- Overall national ranking: tied – 63rd worst of 280 U.S. cities considered
- Change in traffic delays from 2021: +27%
- Avg. commute time in city: 21 minutes (State avg.: 24 minutes)
- Commuters who drive or carpool to work: 140,129; 92.6% of commuters
- Cities considered in state: 2
Louisiana: New Orleans
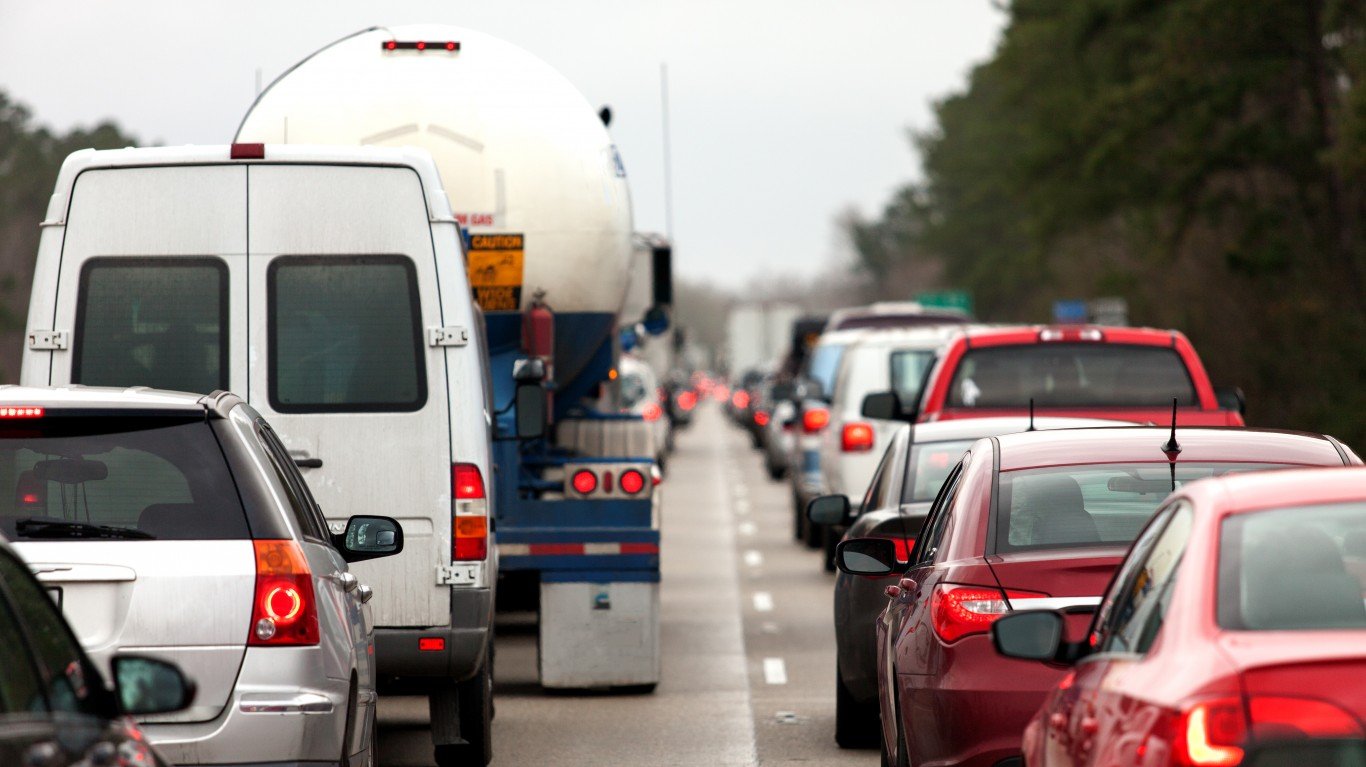
- Avg. time lost to traffic delays in 2022: 77 hours per commuter
- Overall national ranking: 9th worst of 280 U.S. cities considered
- Change in traffic delays from 2021: +22%
- Avg. commute time in city: 23 minutes (State avg.: 26 minutes)
- Commuters who drive or carpool to work: 128,457; 82.7% of commuters
- Cities considered in state: 3
Maine: Bangor

- Avg. time lost to traffic delays in 2022: 8 hours per commuter
- Overall national ranking: tied – 182nd worst of 280 U.S. cities considered
- Change in traffic delays from 2021: +5%
- Avg. commute time in city: 17 minutes (State avg.: 24 minutes)
- Commuters who drive or carpool to work: 12,365; 89.2% of commuters
- Cities considered in state: 2
Maryland: Baltimore
- Avg. time lost to traffic delays in 2022: 55 hours per commuter
- Overall national ranking: 15th worst of 280 U.S. cities considered
- Change in traffic delays from 2021: +49%
- Avg. commute time in city: 31 minutes (State avg.: 32 minutes)
- Commuters who drive or carpool to work: 179,149; 73.9% of commuters
- Cities considered in state: 6
Massachusetts: Boston
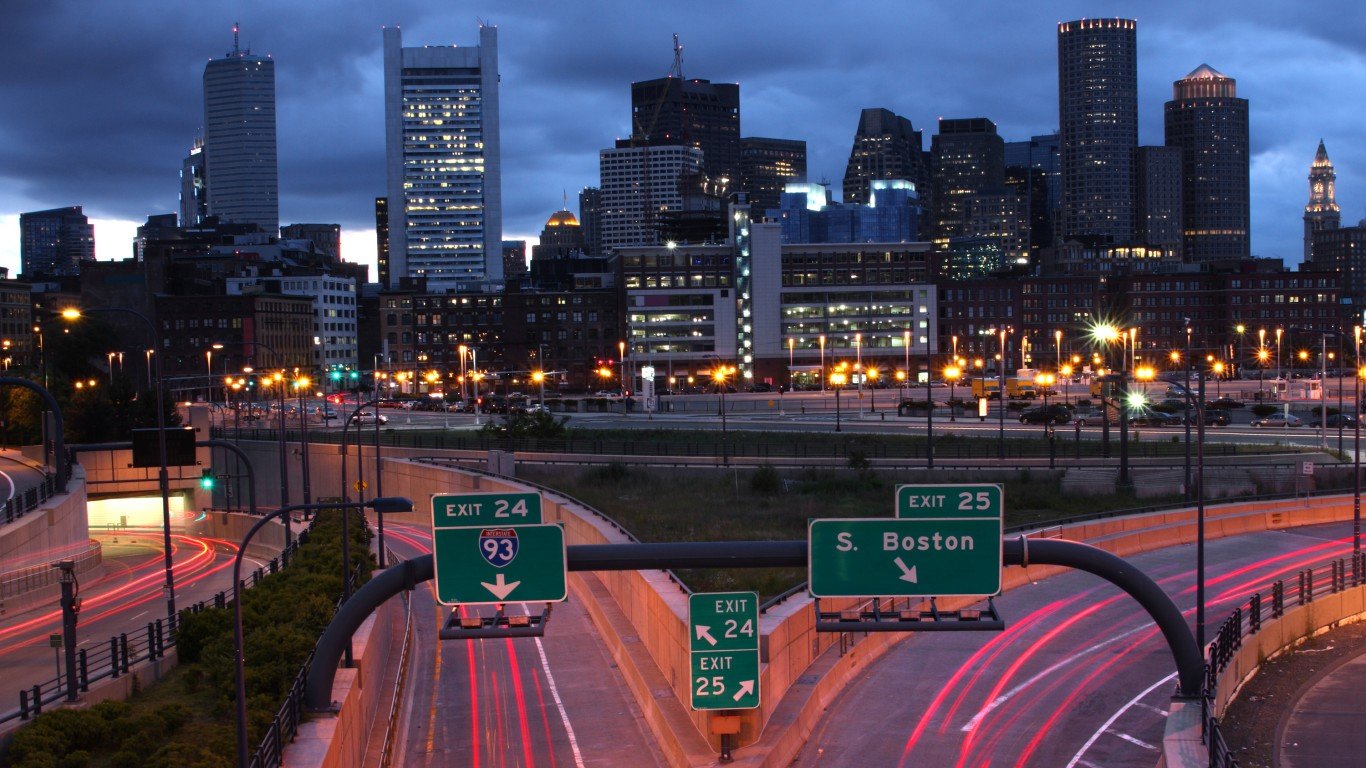
- Avg. time lost to traffic delays in 2022: 134 hours per commuter
- Overall national ranking: 2nd worst of 280 U.S. cities considered
- Change in traffic delays from 2021: +72%
- Avg. commute time in city: 31 minutes (State avg.: 30 minutes)
- Commuters who drive or carpool to work: 151,856; 47.3% of commuters
- Cities considered in state: 9
Michigan: Detroit
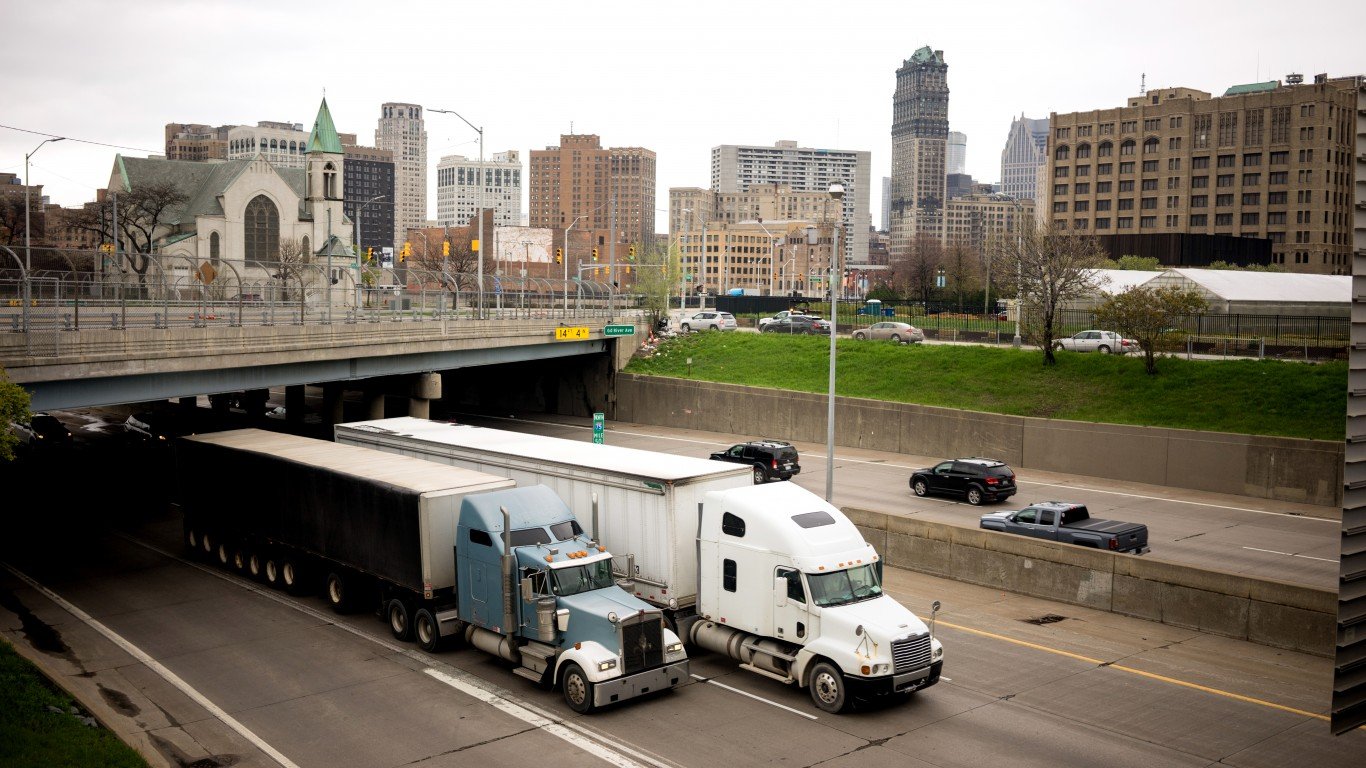
- Avg. time lost to traffic delays in 2022: 23 hours per commuter
- Overall national ranking: tied – 53rd worst of 280 U.S. cities considered
- Change in traffic delays from 2021: +75%
- Avg. commute time in city: 26 minutes (State avg.: 25 minutes)
- Commuters who drive or carpool to work: 178,700; 85.9% of commuters
- Cities considered in state: 7
Minnesota: Minneapolis
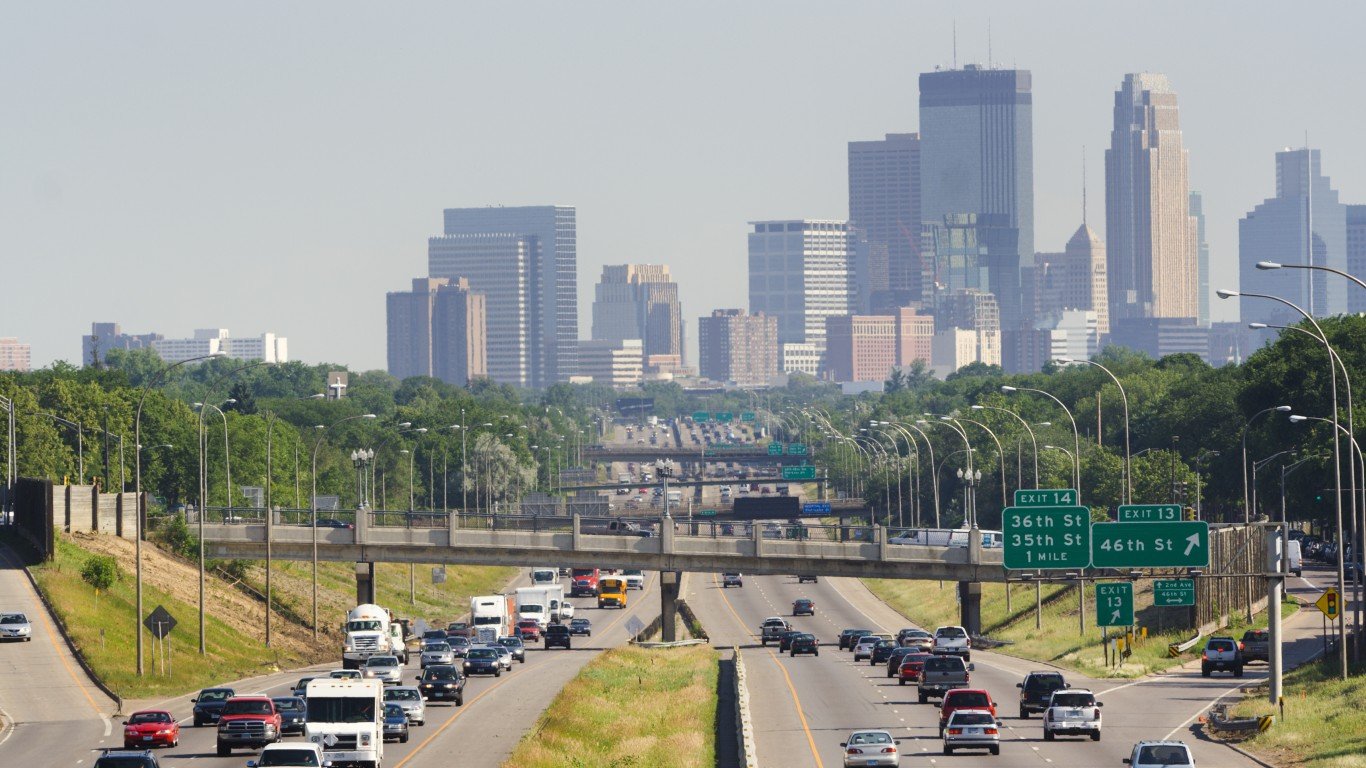
- Avg. time lost to traffic delays in 2022: 26 hours per commuter
- Overall national ranking: tied – 39th worst of 280 U.S. cities considered
- Change in traffic delays from 2021: +47%
- Avg. commute time in city: 23 minutes (State avg.: 24 minutes)
- Commuters who drive or carpool to work: 149,817; 74.4% of commuters
- Cities considered in state: 1
Because Minneapolis is the only city with available data in Minnesota, it ranks as having the worst traffic by default.
Mississippi: Jackson
- Avg. time lost to traffic delays in 2022: 4 hours per commuter
- Overall national ranking: tied – 242nd worst of 280 U.S. cities considered
- Change in traffic delays from 2021: -10%
- Avg. commute time in city: 21 minutes (State avg.: 25 minutes)
- Commuters who drive or carpool to work: 61,304; 97.1% of commuters
- Cities considered in state: 2
Missouri: St. Louis
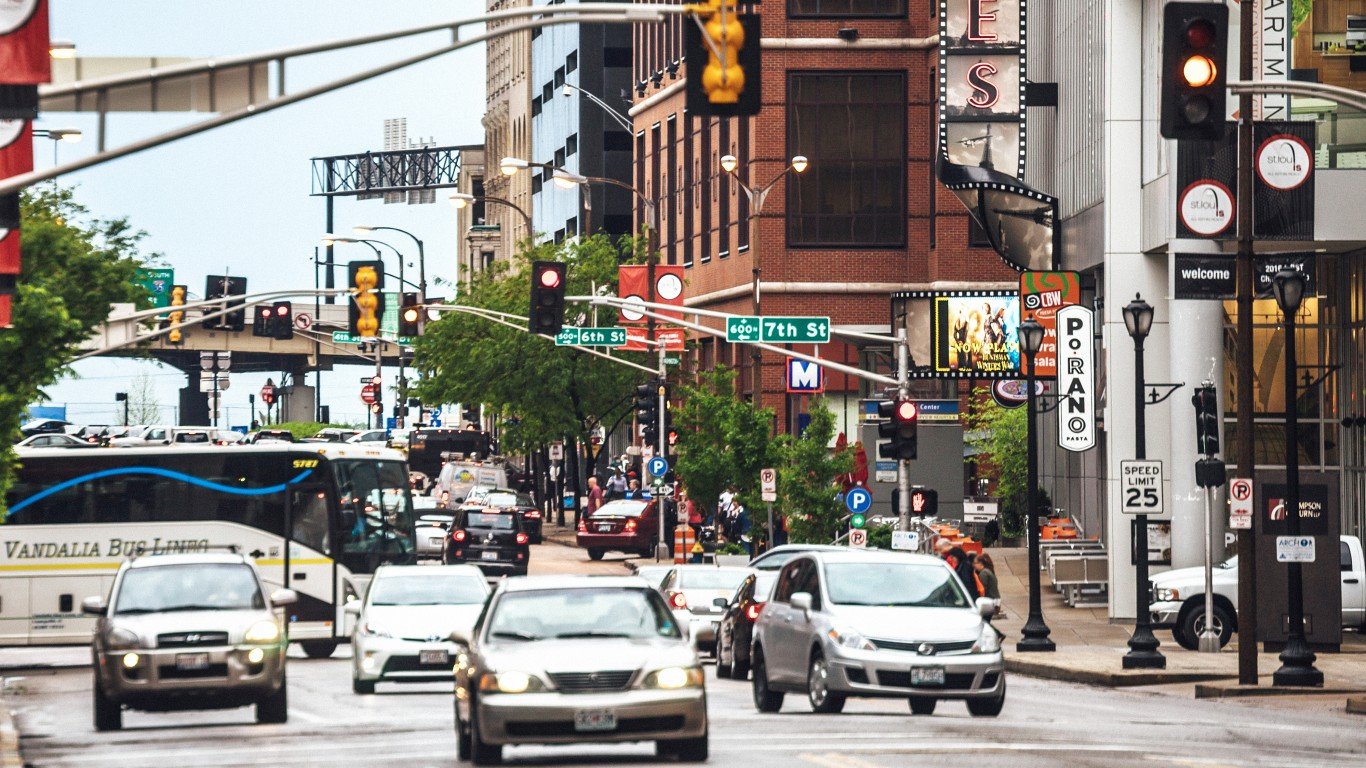
- Avg. time lost to traffic delays in 2022: 17 hours per commuter
- Overall national ranking: tied – 91st worst of 280 U.S. cities considered
- Change in traffic delays from 2021: +68%
- Avg. commute time in city: 23 minutes (State avg.: 24 minutes)
- Commuters who drive or carpool to work: 117,199; 85.5% of commuters
- Cities considered in state: 2
Montana: Missoula
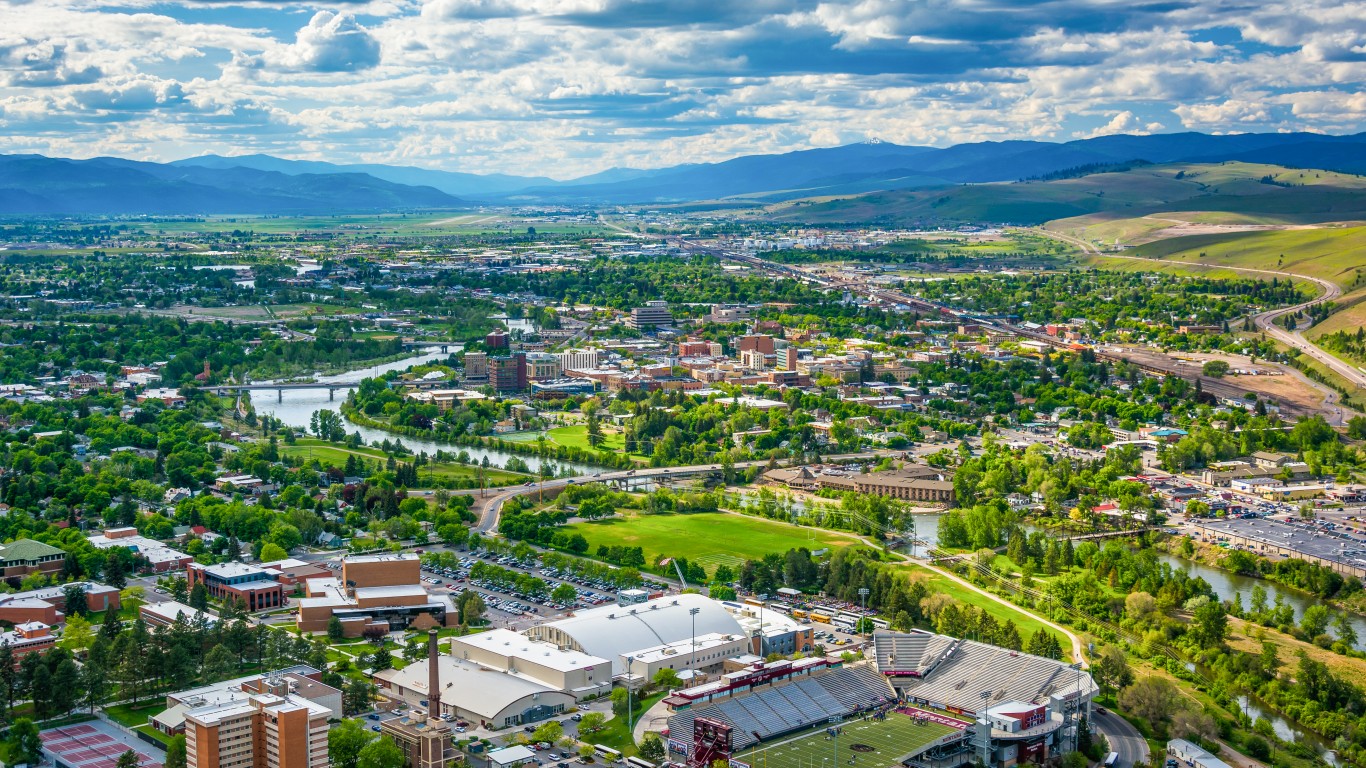
- Avg. time lost to traffic delays in 2022: 22 hours per commuter
- Overall national ranking: tied – 63rd worst of 280 U.S. cities considered
- Change in traffic delays from 2021: +20%
- Avg. commute time in city: 16 minutes (State avg.: 19 minutes)
- Commuters who drive or carpool to work: 32,765; 85.8% of commuters
- Cities considered in state: 4
Nebraska: Omaha
- Avg. time lost to traffic delays in 2022: 14 hours per commuter
- Overall national ranking: tied – 110th worst of 280 U.S. cities considered
- Change in traffic delays from 2021: +11%
- Avg. commute time in city: 19 minutes (State avg.: 19 minutes)
- Commuters who drive or carpool to work: 215,928; 94.9% of commuters
- Cities considered in state: 2
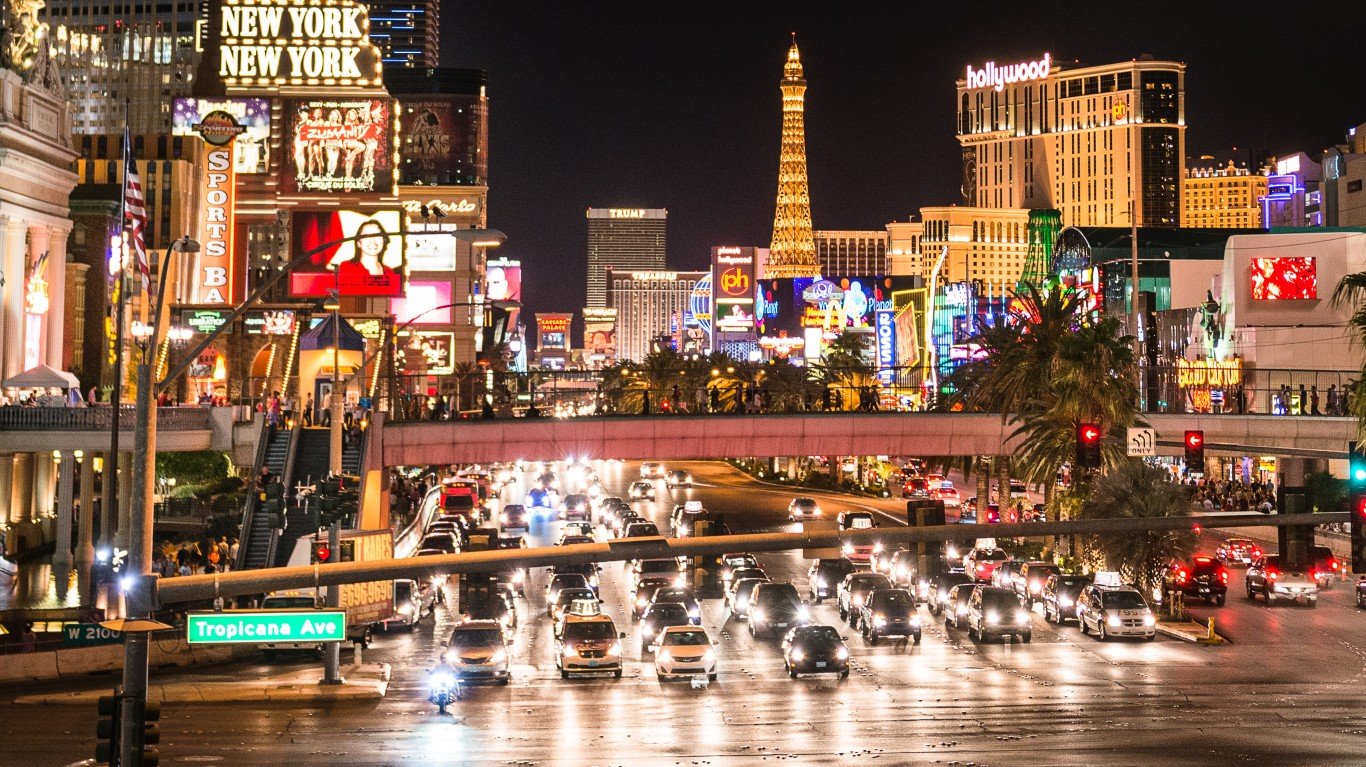
Nevada: Las Vegas
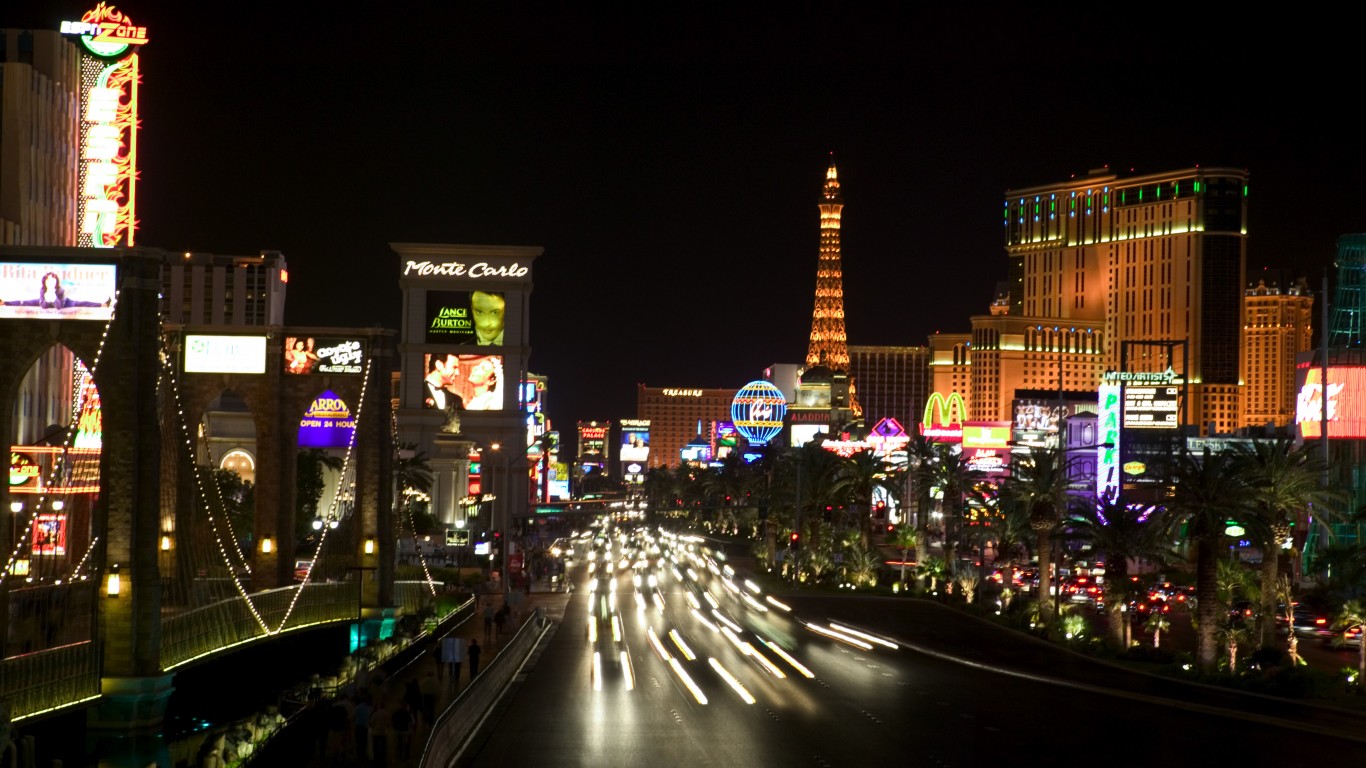
- Avg. time lost to traffic delays in 2022: 41 hours per commuter
- Overall national ranking: tied – 22nd worst of 280 U.S. cities considered
- Change in traffic delays from 2021: +46%
- Avg. commute time in city: 26 minutes (State avg.: 25 minutes)
- Commuters who drive or carpool to work: 243,916; 92.2% of commuters
- Cities considered in state: 3
New Hampshire: Manchester
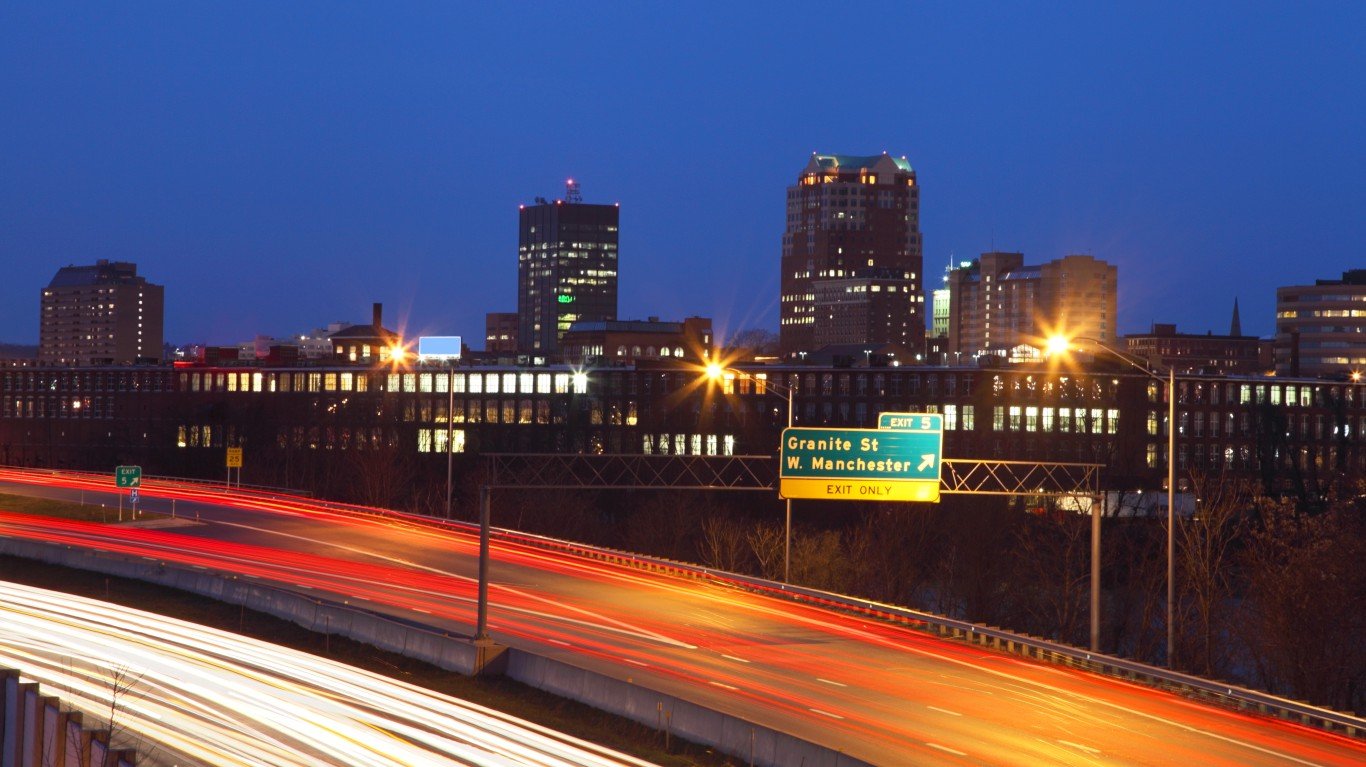
- Avg. time lost to traffic delays in 2022: 13 hours per commuter
- Overall national ranking: tied – 127th worst of 280 U.S. cities considered
- Change in traffic delays from 2021: +20%
- Avg. commute time in city: 24 minutes (State avg.: 27 minutes)
- Commuters who drive or carpool to work: 55,412; 95.1% of commuters
- Cities considered in state: 4
New Jersey: Ocean Township
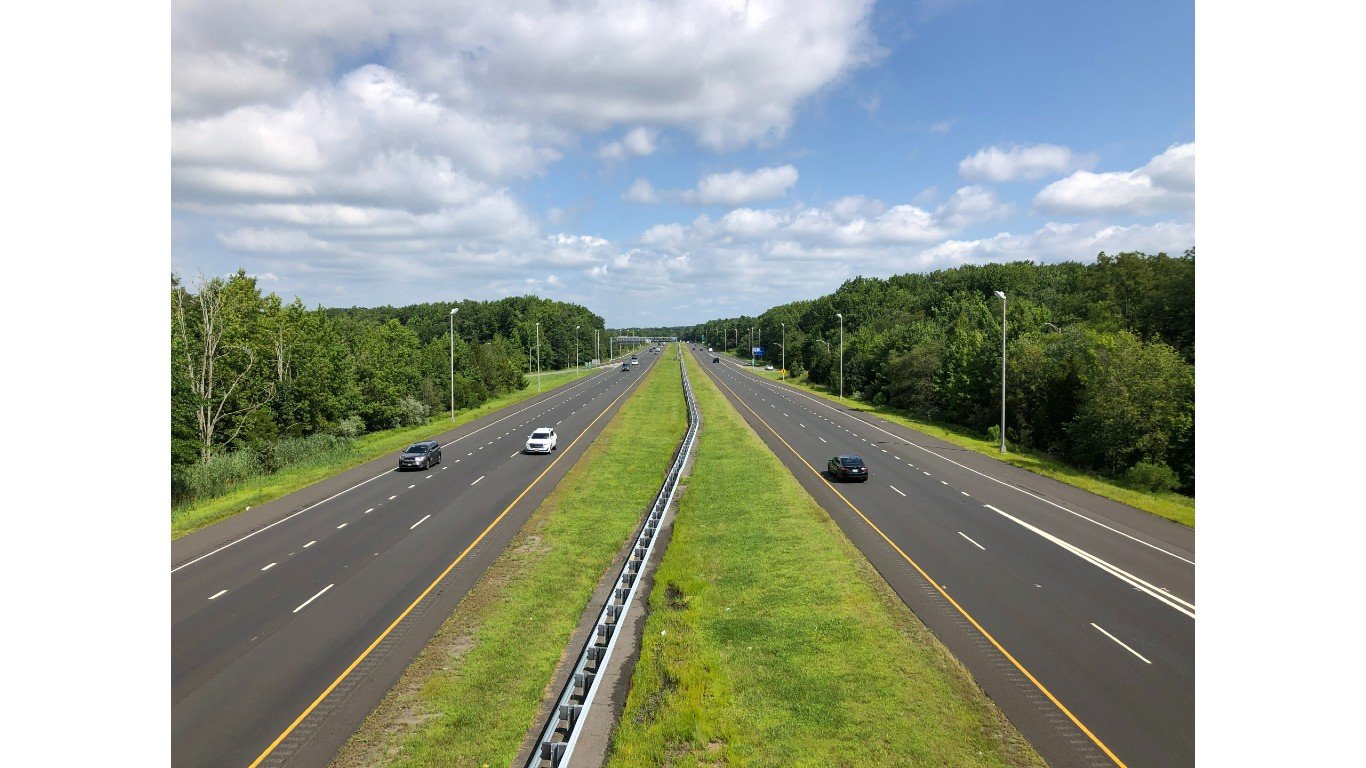
- Avg. time lost to traffic delays in 2022: 17 hours per commuter
- Overall national ranking: tied – 91st worst of 280 U.S. cities considered
- Change in traffic delays from 2021: +87%
- Avg. commute time in Monmouth County: 34 minutes (State avg.: 31 minutes)
- Commuters who drive or carpool to work in Monmouth County: 251,861; 88.6% of commuters
- Cities considered in state: 7
New Mexico: Albuquerque
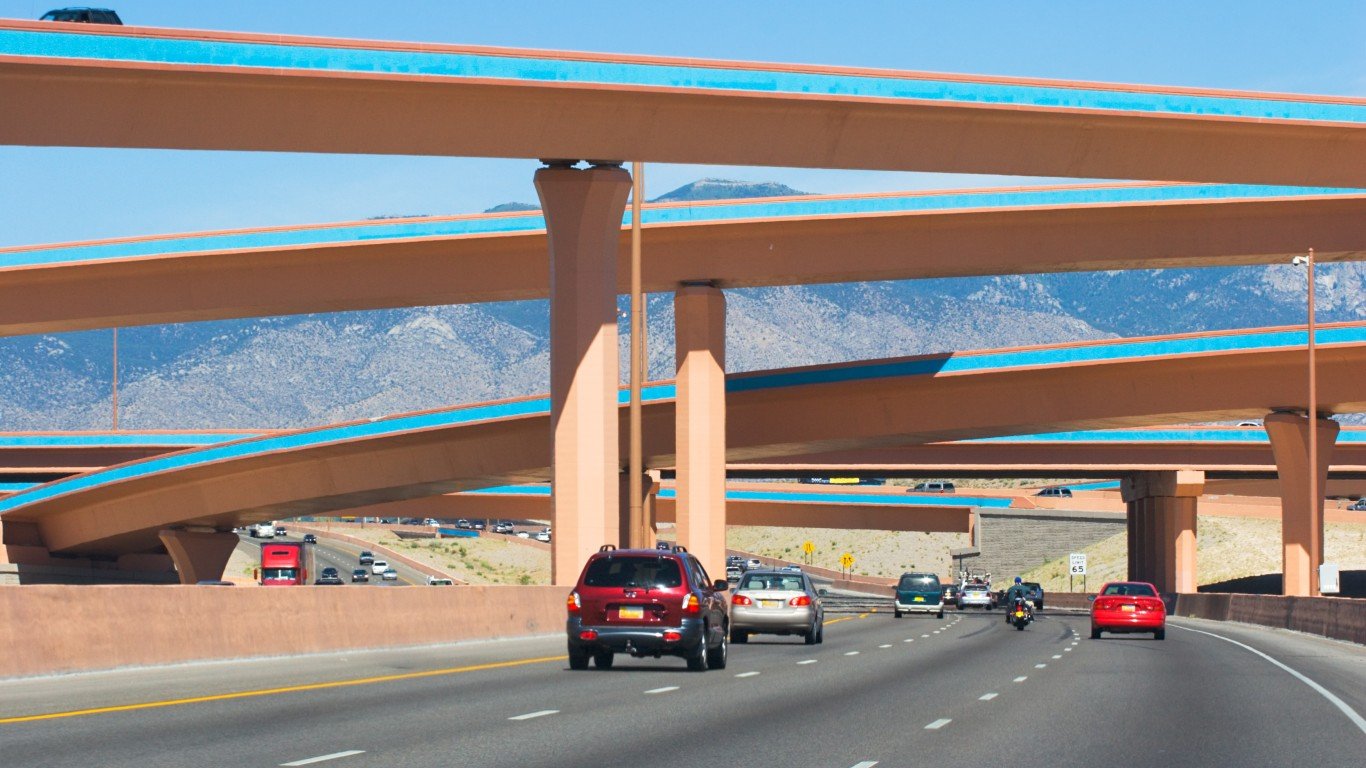
- Avg. time lost to traffic delays in 2022: 20 hours per commuter
- Overall national ranking: tied – 71st worst of 280 U.S. cities considered
- Change in traffic delays from 2021: +155%
- Avg. commute time in city: 22 minutes (State avg.: 23 minutes)
- Commuters who drive or carpool to work: 232,016; 94.3% of commuters
- Cities considered in state: 4
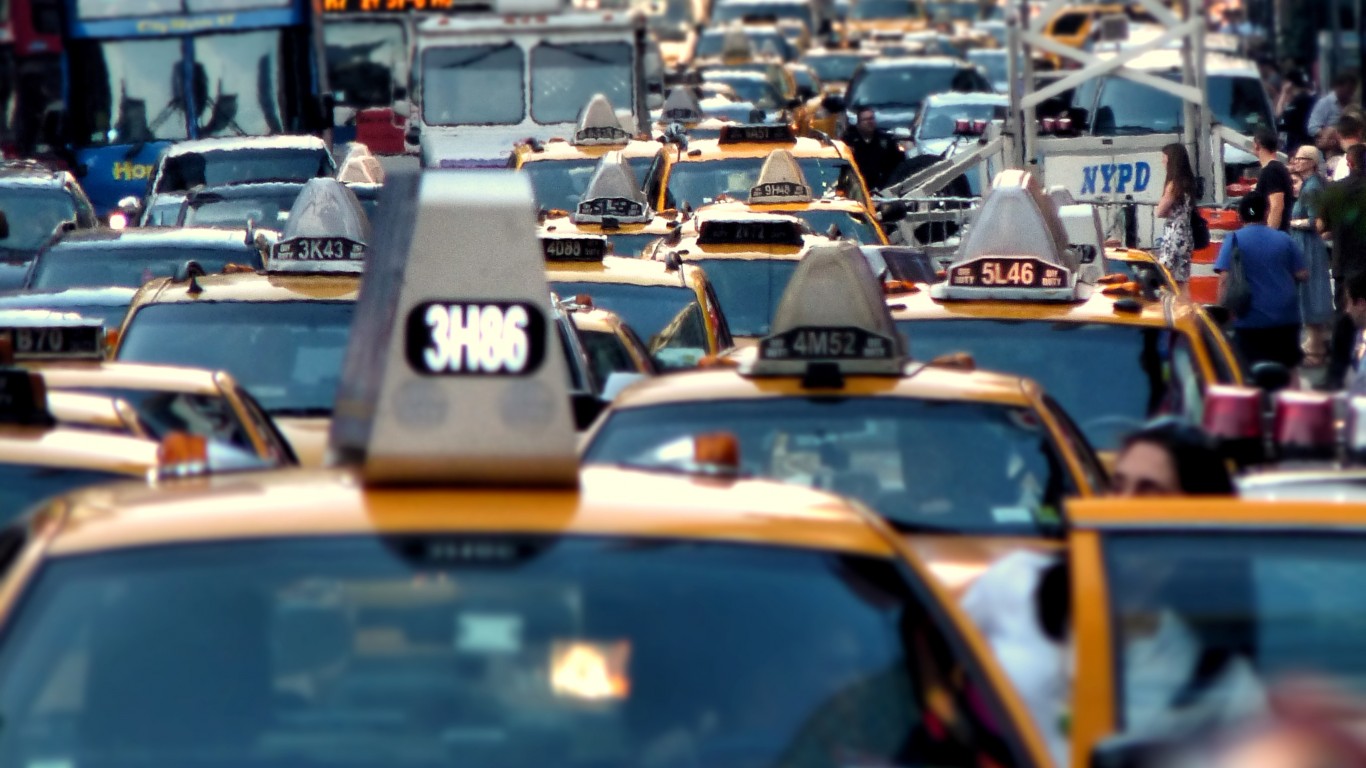
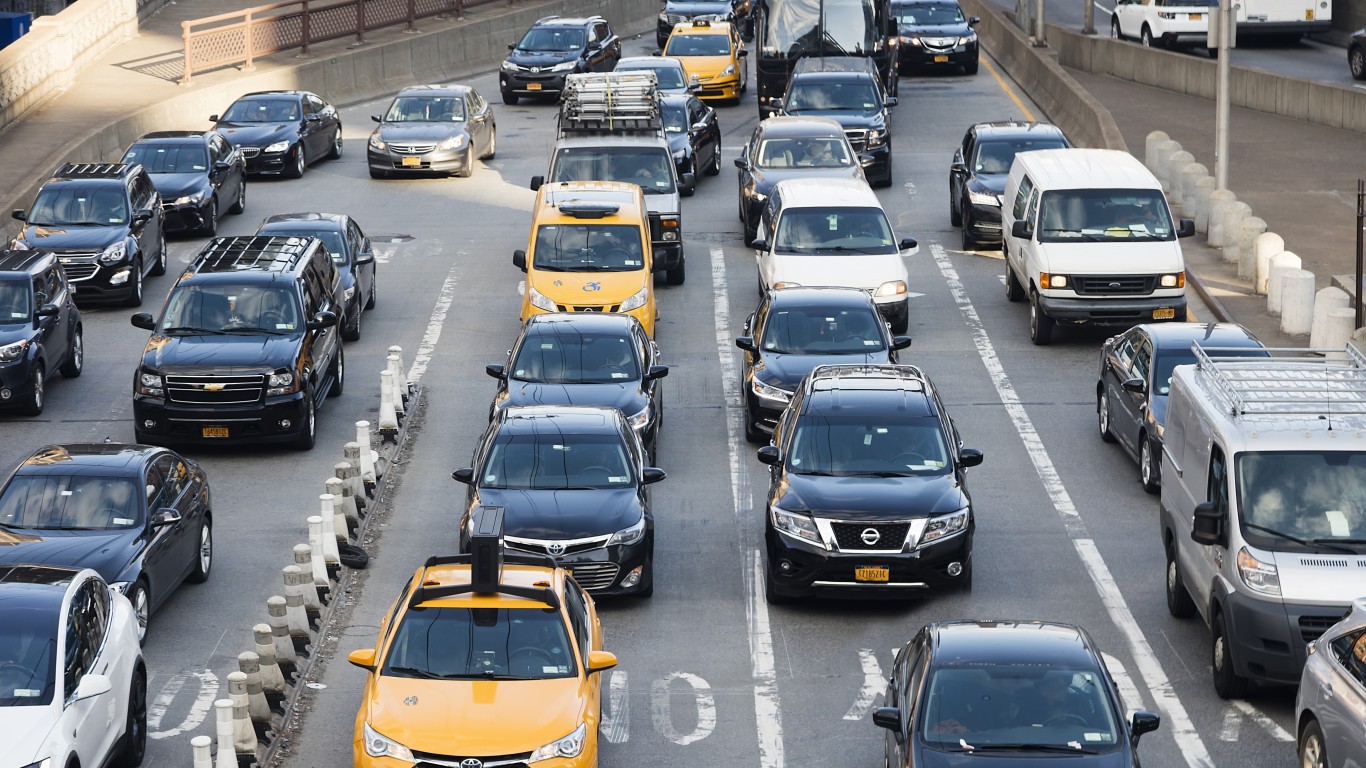
New York: New York City
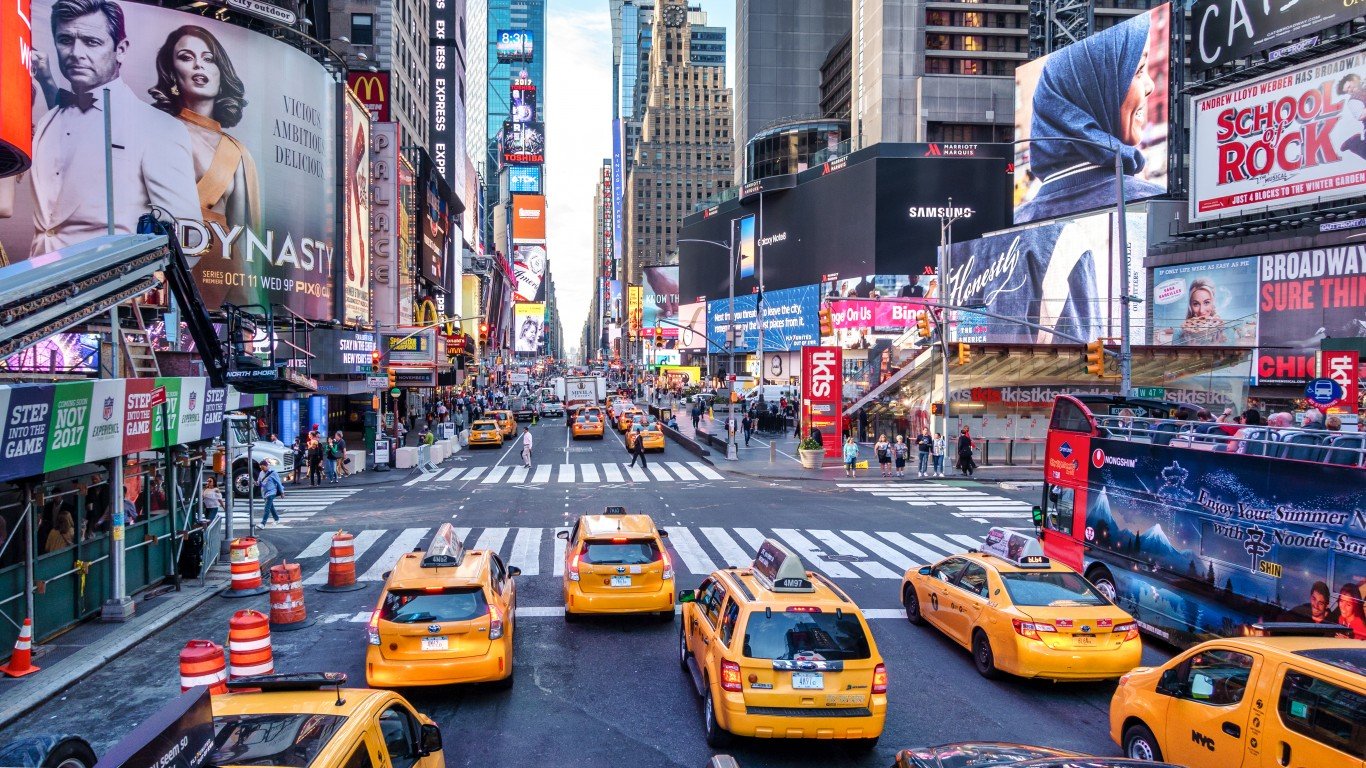
- Avg. time lost to traffic delays in 2022: 117 hours per commuter
- Overall national ranking: 3rd worst of 280 U.S. cities considered
- Change in traffic delays from 2021: +15%
- Avg. commute time in city: 41 minutes (State avg.: 33 minutes)
- Commuters who drive or carpool to work: 1,082,647; 30.0% of commuters
- Cities considered in state: 9
North Carolina: Charlotte
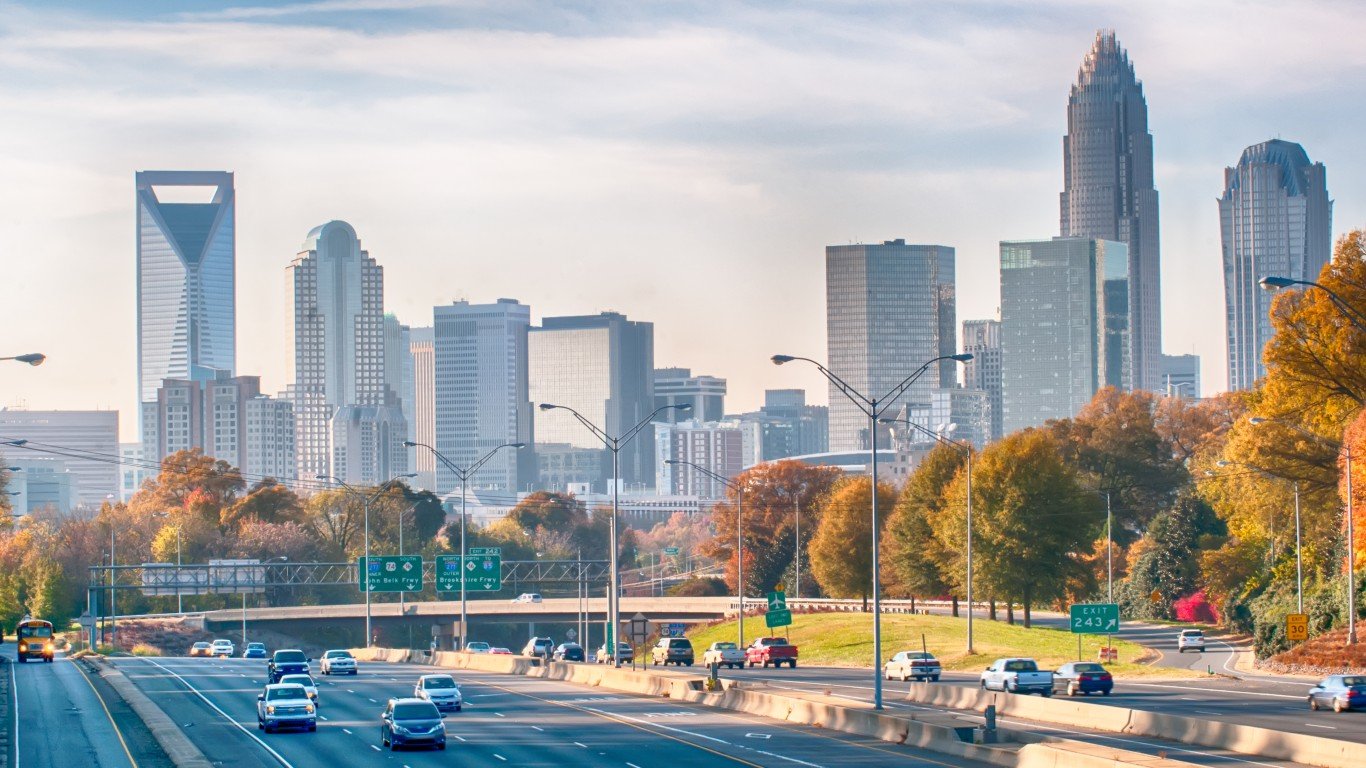
- Avg. time lost to traffic delays in 2022: 25 hours per commuter
- Overall national ranking: tied – 43rd worst of 280 U.S. cities considered
- Change in traffic delays from 2021: +48%
- Avg. commute time in city: 25 minutes (State avg.: 25 minutes)
- Commuters who drive or carpool to work: 354,197; 92.8% of commuters
- Cities considered in state: 9
North Dakota: Fargo
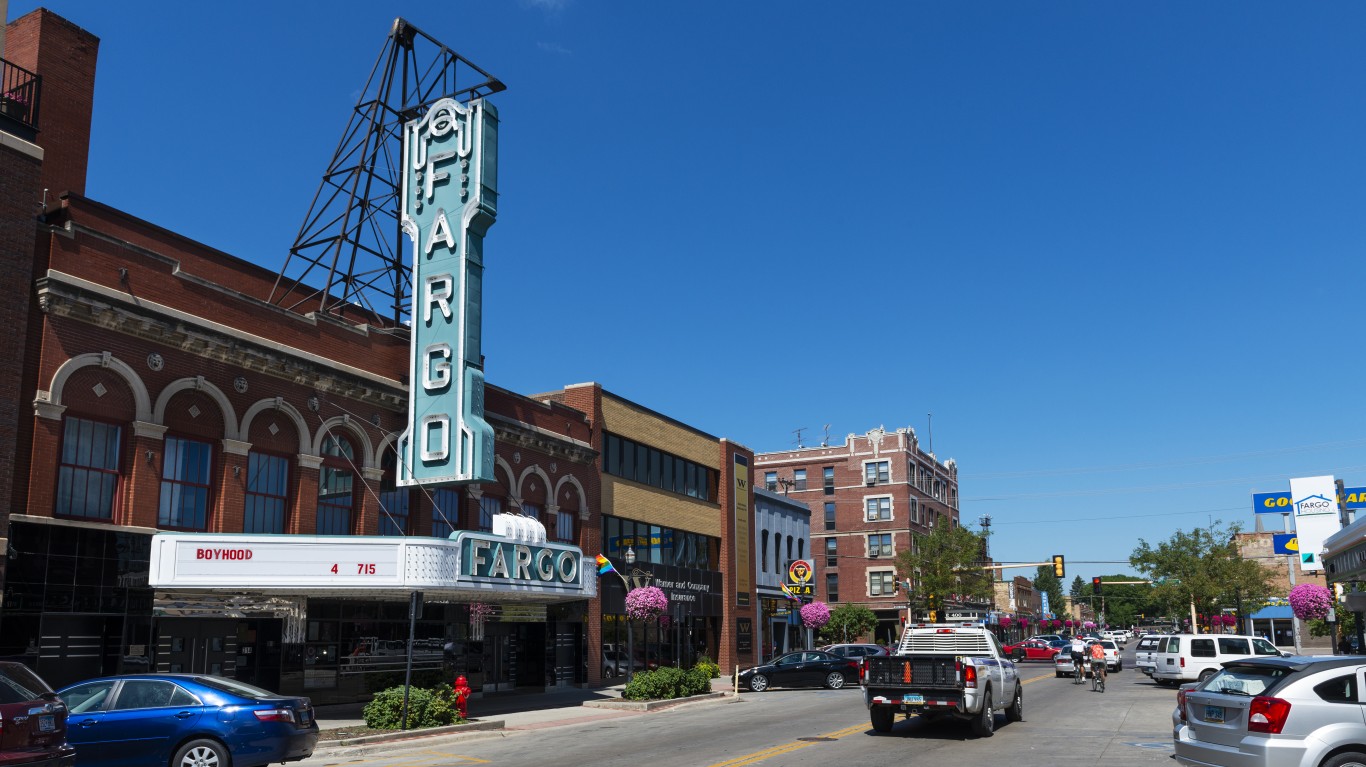
- Avg. time lost to traffic delays in 2022: 0 hours per commuter
- Overall national ranking: tied – 274th worst of 280 U.S. cities considered
- Change in traffic delays from 2021: +0%
- Avg. commute time in city: 16 minutes (State avg.: 18 minutes)
- Commuters who drive or carpool to work: 63,762; 92.4% of commuters
- Cities considered in state: 1
Because Fargo is the only city with available data in North Dakota, it ranks as having the worst traffic by default.
Ohio: Cleveland
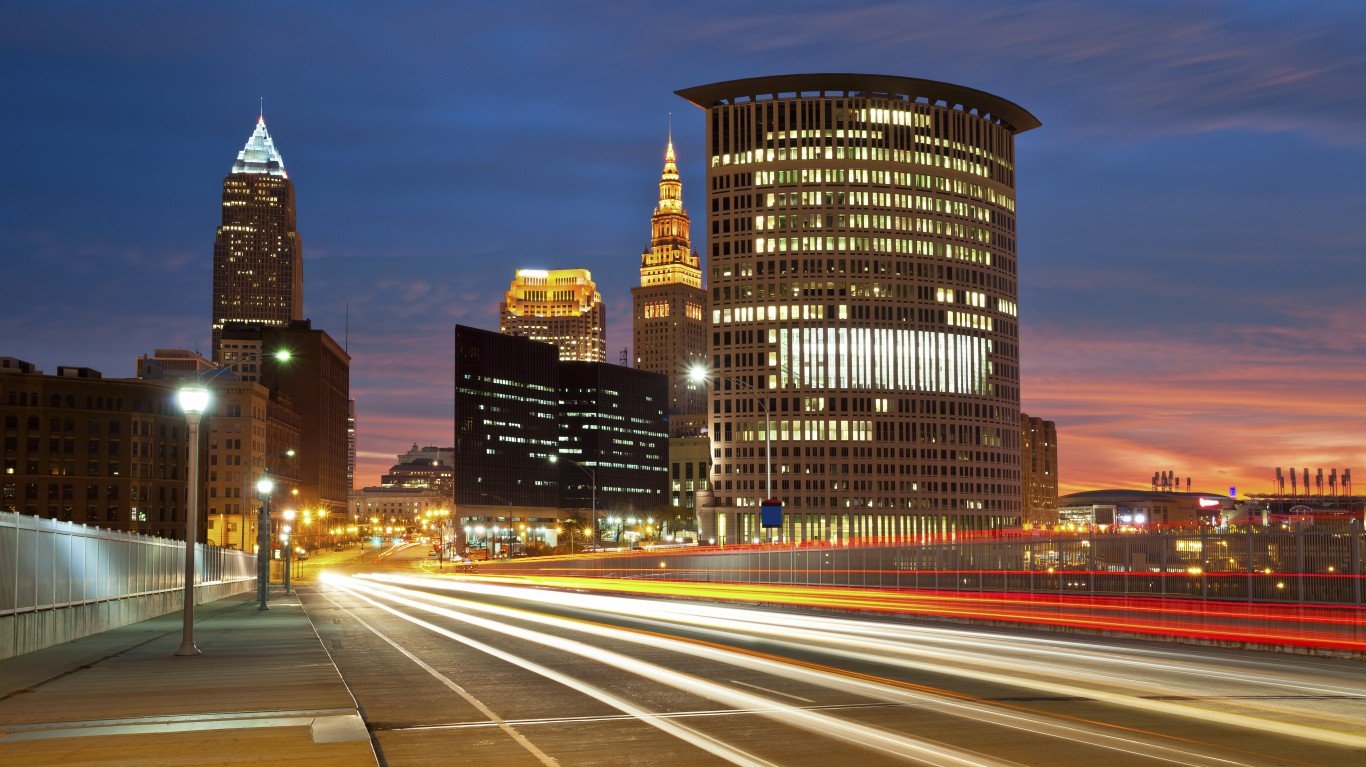
- Avg. time lost to traffic delays in 2022: 20 hours per commuter
- Overall national ranking: tied – 71st worst of 280 U.S. cities considered
- Change in traffic delays from 2021: +36%
- Avg. commute time in city: 23 minutes (State avg.: 24 minutes)
- Commuters who drive or carpool to work: 120,735; 84.3% of commuters
- Cities considered in state: 9
Oklahoma: Oklahoma City
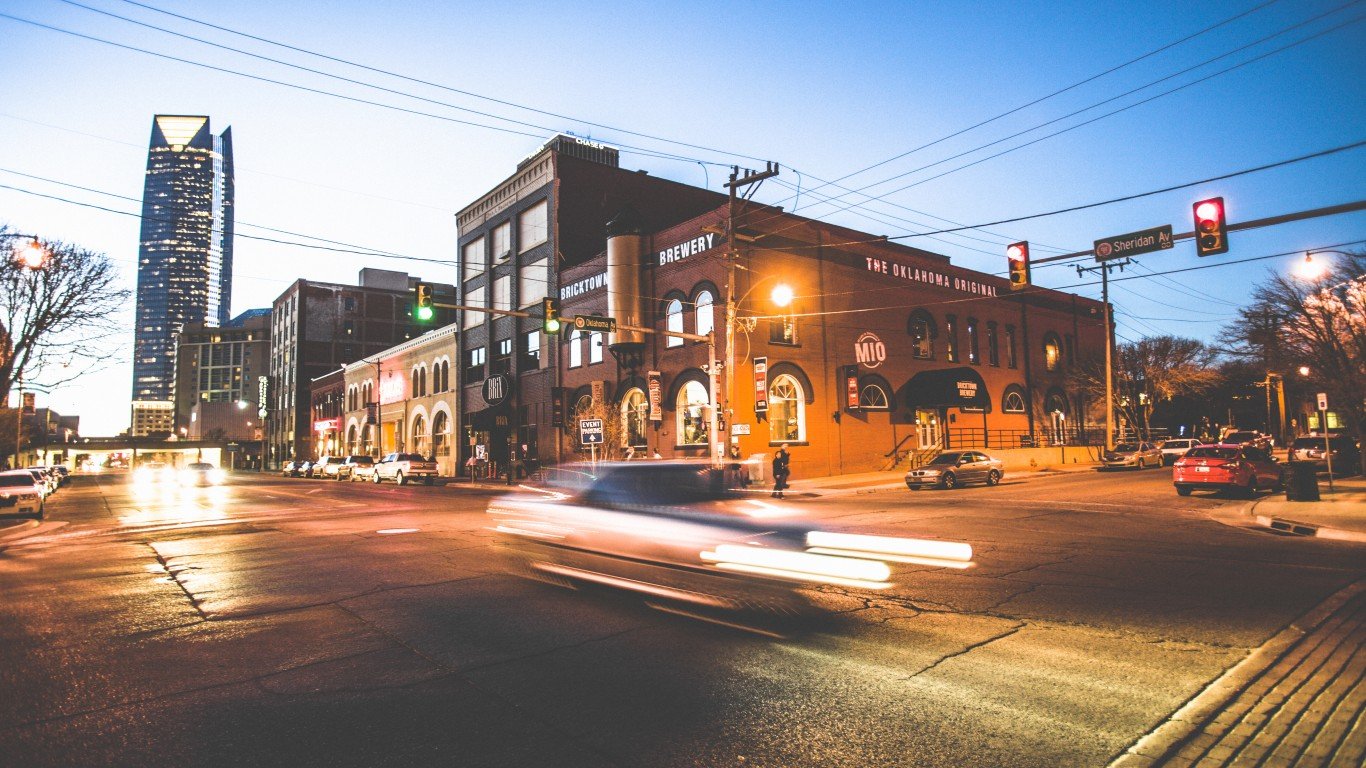
- Avg. time lost to traffic delays in 2022: 14 hours per commuter
- Overall national ranking: tied – 110th worst of 280 U.S. cities considered
- Change in traffic delays from 2021: +44%
- Avg. commute time in city: 22 minutes (State avg.: 22 minutes)
- Commuters who drive or carpool to work: 298,213; 96.2% of commuters
- Cities considered in state: 2
Oregon: Portland
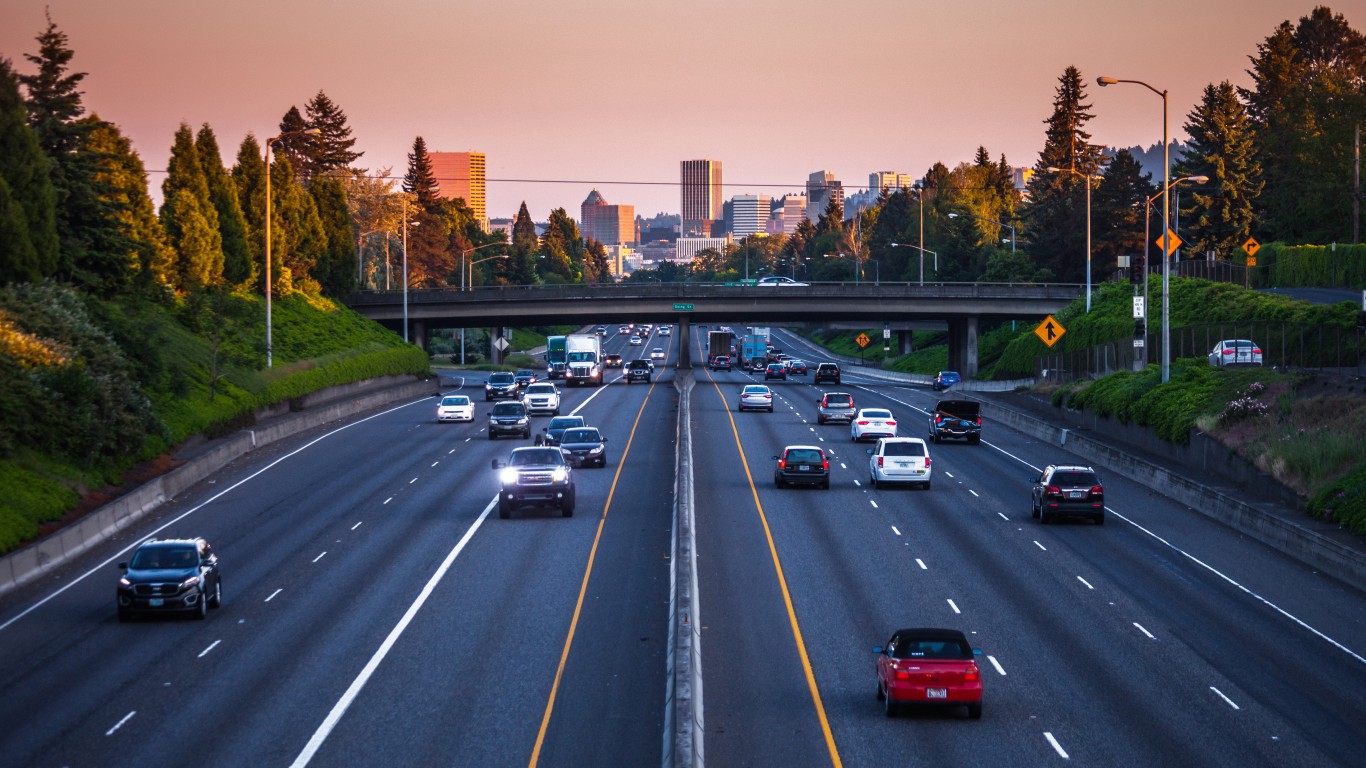
- Avg. time lost to traffic delays in 2022: 72 hours per commuter
- Overall national ranking: 13th worst of 280 U.S. cities considered
- Change in traffic delays from 2021: +50%
- Avg. commute time in city: 26 minutes (State avg.: 24 minutes)
- Commuters who drive or carpool to work: 220,404; 74.5% of commuters
- Cities considered in state: 4
Pennsylvania: Philadelphia
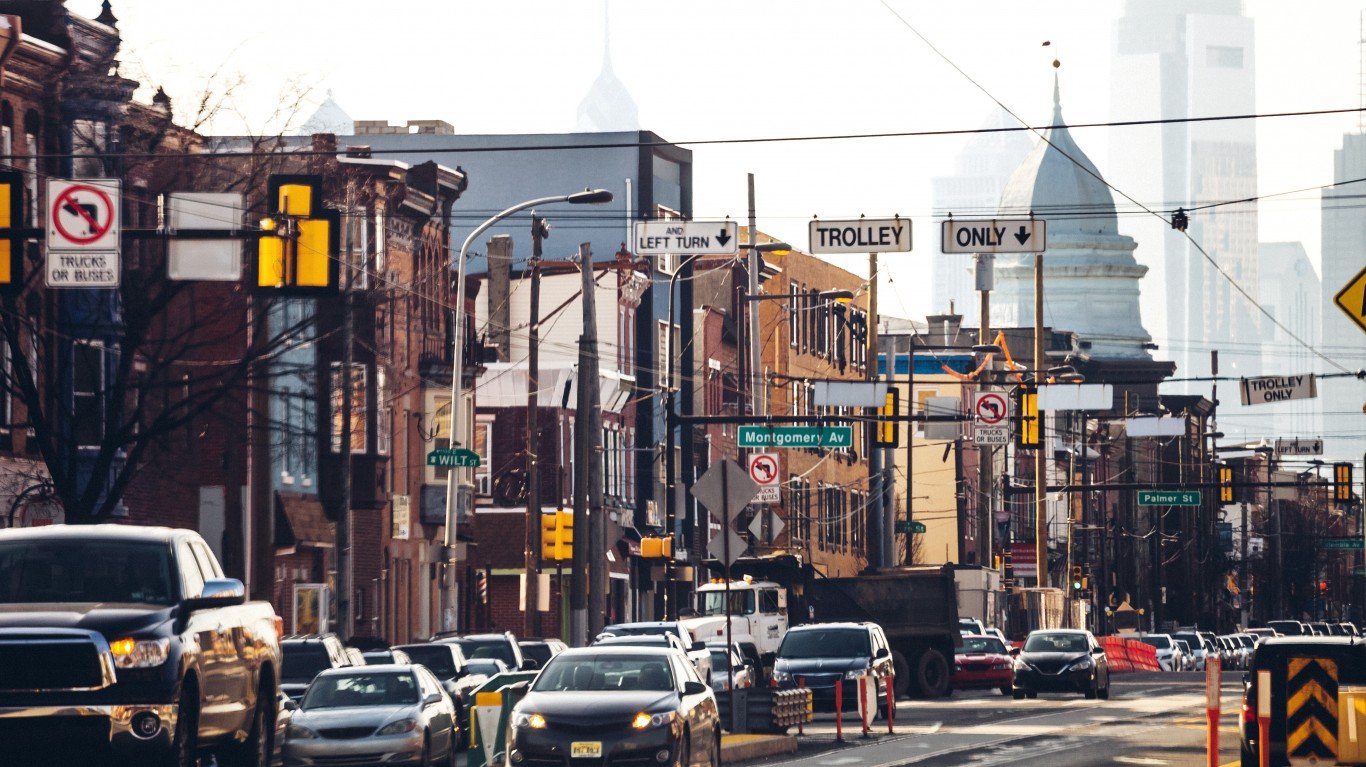
- Avg. time lost to traffic delays in 2022: 114 hours per commuter
- Overall national ranking: 4th worst of 280 U.S. cities considered
- Change in traffic delays from 2021: +27%
- Avg. commute time in city: 33 minutes (State avg.: 27 minutes)
- Commuters who drive or carpool to work: 399,184; 62.9% of commuters
- Cities considered in state: 13
Rhode Island: Providence
- Avg. time lost to traffic delays in 2022: 42 hours per commuter
- Overall national ranking: 21st worst of 280 U.S. cities considered
- Change in traffic delays from 2021: +11%
- Avg. commute time in city: 24 minutes (State avg.: 25 minutes)
- Commuters who drive or carpool to work: 65,447; 84.1% of commuters
- Cities considered in state: 1
Because Providence is the only city with available data in Rhode Island, it ranks as having the worst traffic by default.
South Carolina: Greenville
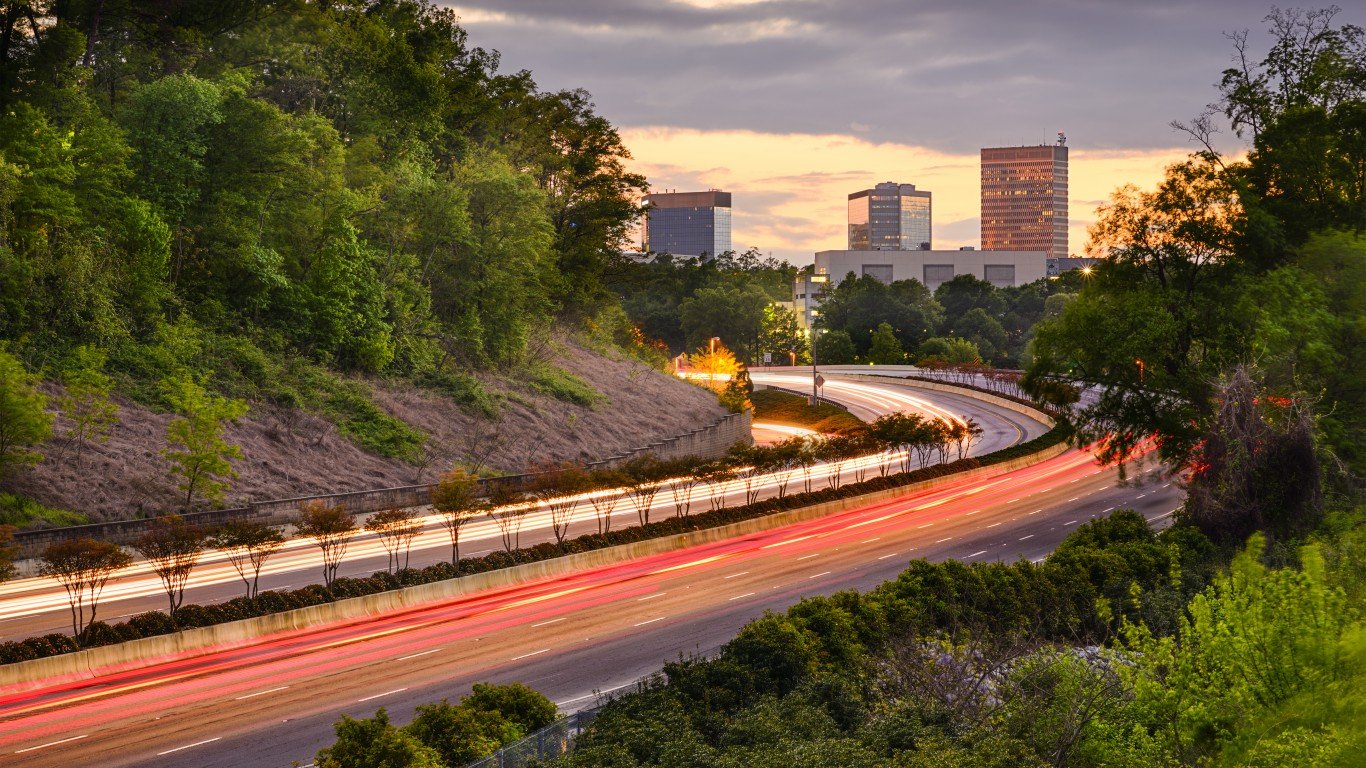
- Avg. time lost to traffic delays in 2022: 23 hours per commuter
- Overall national ranking: tied – 53rd worst of 280 U.S. cities considered
- Change in traffic delays from 2021: +34%
- Avg. commute time in city: 20 minutes (State avg.: 25 minutes)
- Commuters who drive or carpool to work: 31,735; 92.1% of commuters
- Cities considered in state: 6
Tennessee: Nashville
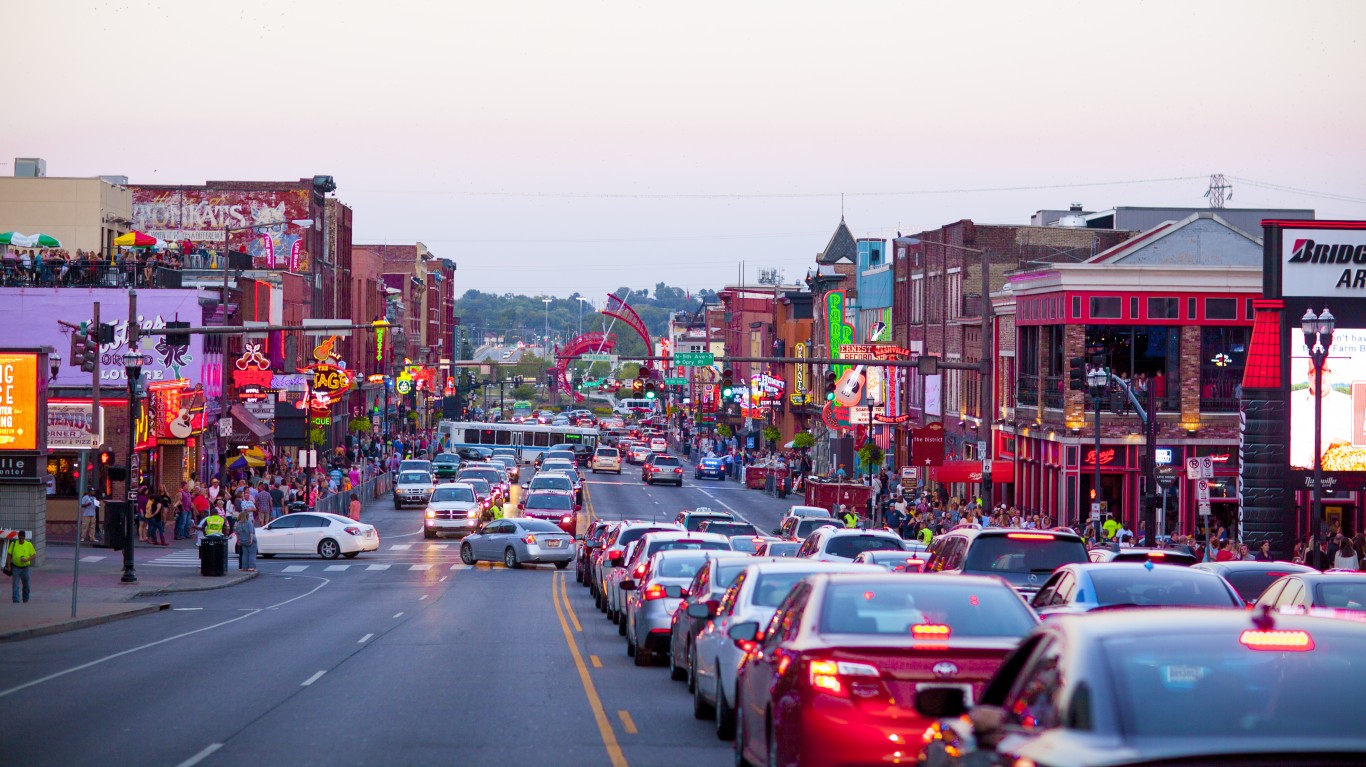
- Avg. time lost to traffic delays in 2022: 41 hours per commuter
- Overall national ranking: tied – 22nd worst of 280 U.S. cities considered
- Change in traffic delays from 2021: +155%
- Avg. commute time in city: 25 minutes (State avg.: 25 minutes)
- Commuters who drive or carpool to work: 305,799; 93.8% of commuters
- Cities considered in state: 6
Texas: Houston
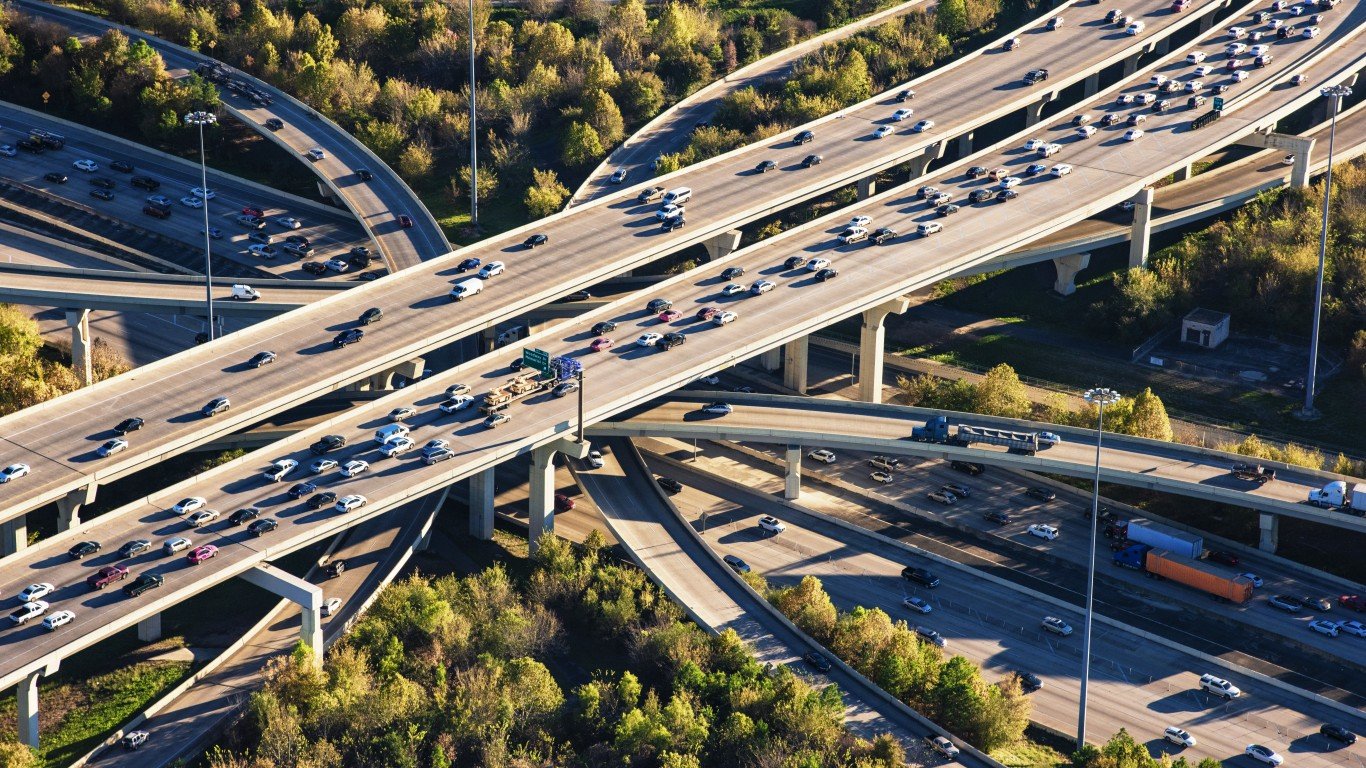
- Avg. time lost to traffic delays in 2022: 74 hours per commuter
- Overall national ranking: tied – 10th worst of 280 U.S. cities considered
- Change in traffic delays from 2021: +28%
- Avg. commute time in city: 28 minutes (State avg.: 27 minutes)
- Commuters who drive or carpool to work: 912,664; 91.0% of commuters
- Cities considered in state: 20
Utah: Ogden
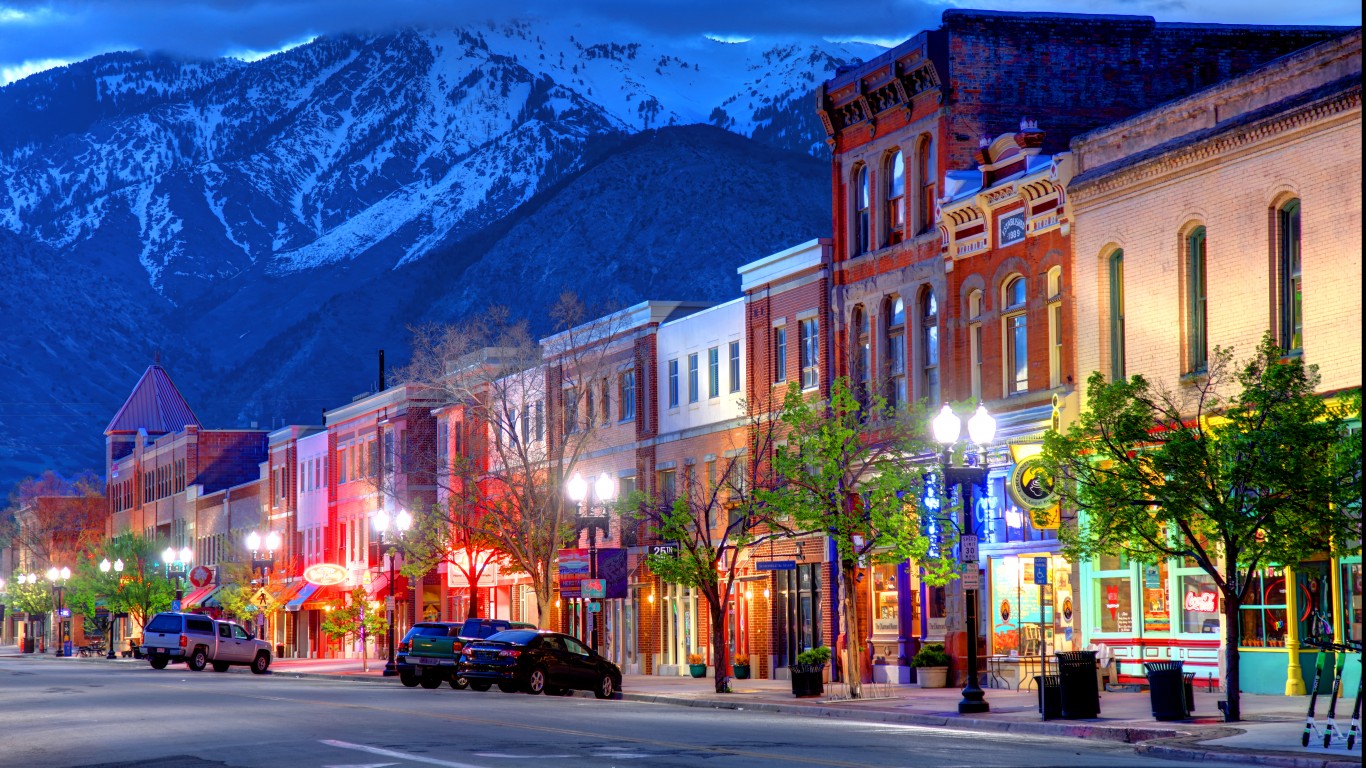
- Avg. time lost to traffic delays in 2022: 14 hours per commuter
- Overall national ranking: tied – 110th worst of 280 U.S. cities considered
- Change in traffic delays from 2021: +31%
- Avg. commute time in city: 21 minutes (State avg.: 22 minutes)
- Commuters who drive or carpool to work: 36,096; 93.0% of commuters
- Cities considered in state: 5
Virginia: Fredericksburg
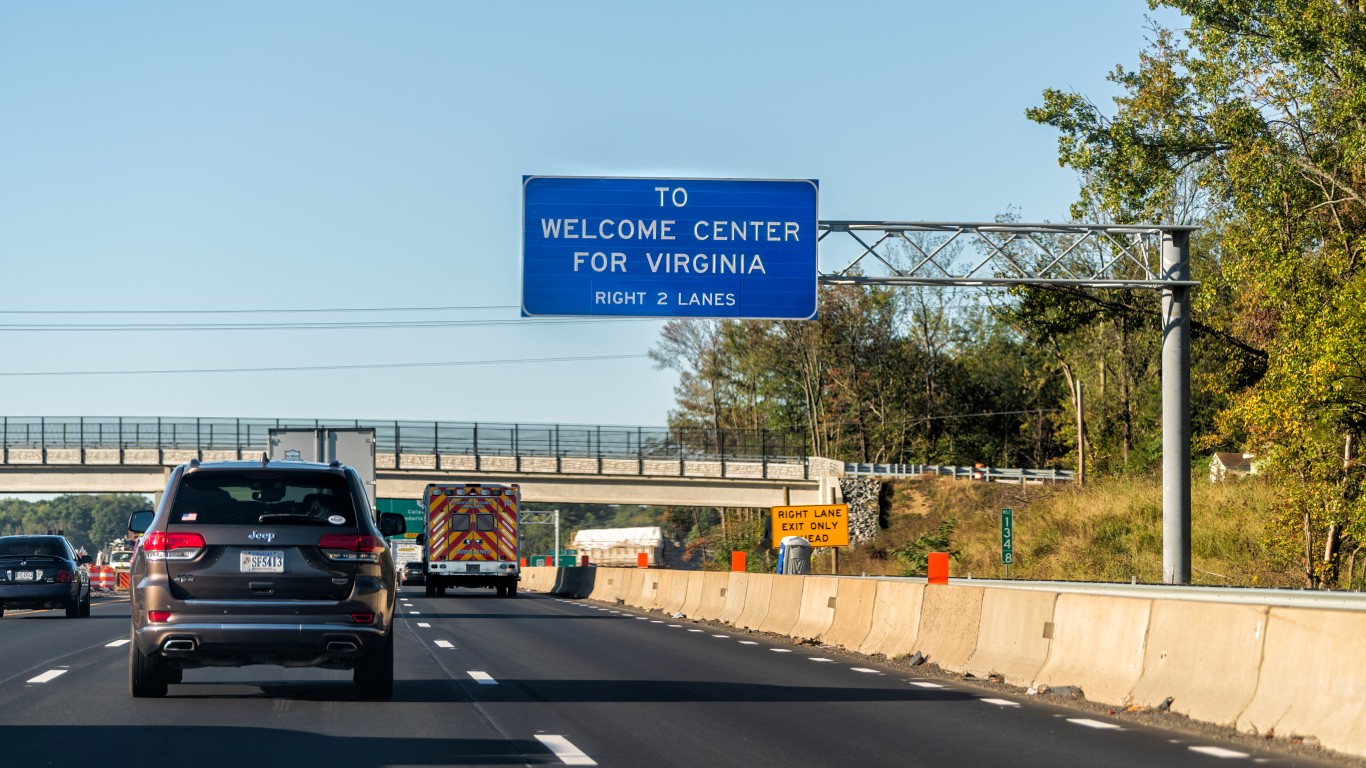
- Avg. time lost to traffic delays in 2022: 24 hours per commuter
- Overall national ranking: tied – 46th worst of 280 U.S. cities considered
- Change in traffic delays from 2021: +9%
- Avg. commute time in city: 30 minutes (State avg.: 28 minutes)
- Commuters who drive or carpool to work: 12,106; 87.6% of commuters
- Cities considered in state: 11
Washington: Seattle
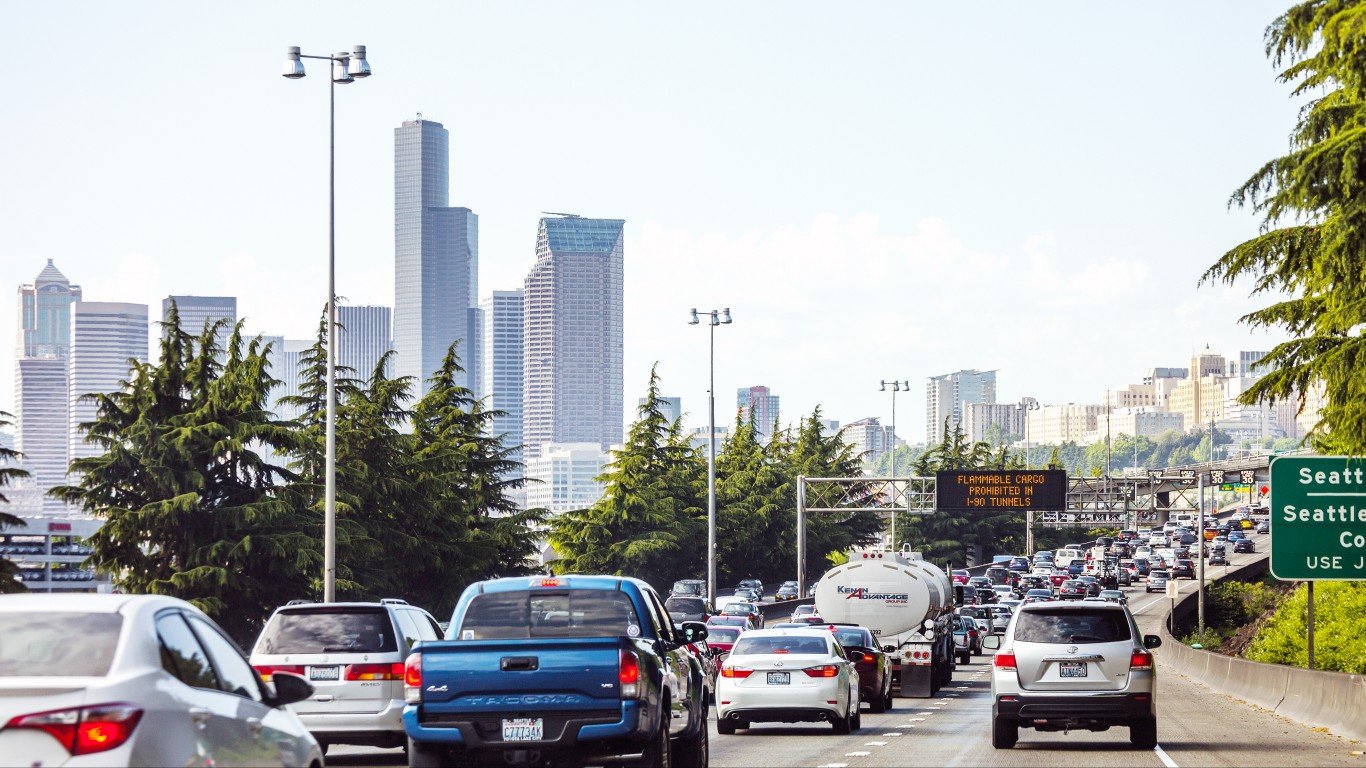
- Avg. time lost to traffic delays in 2022: 46 hours per commuter
- Overall national ranking: 20th worst of 280 U.S. cities considered
- Change in traffic delays from 2021: +52%
- Avg. commute time in city: 28 minutes (State avg.: 28 minutes)
- Commuters who drive or carpool to work: 204,468; 59.4% of commuters
- Cities considered in state: 7
West Virginia: Wheeling
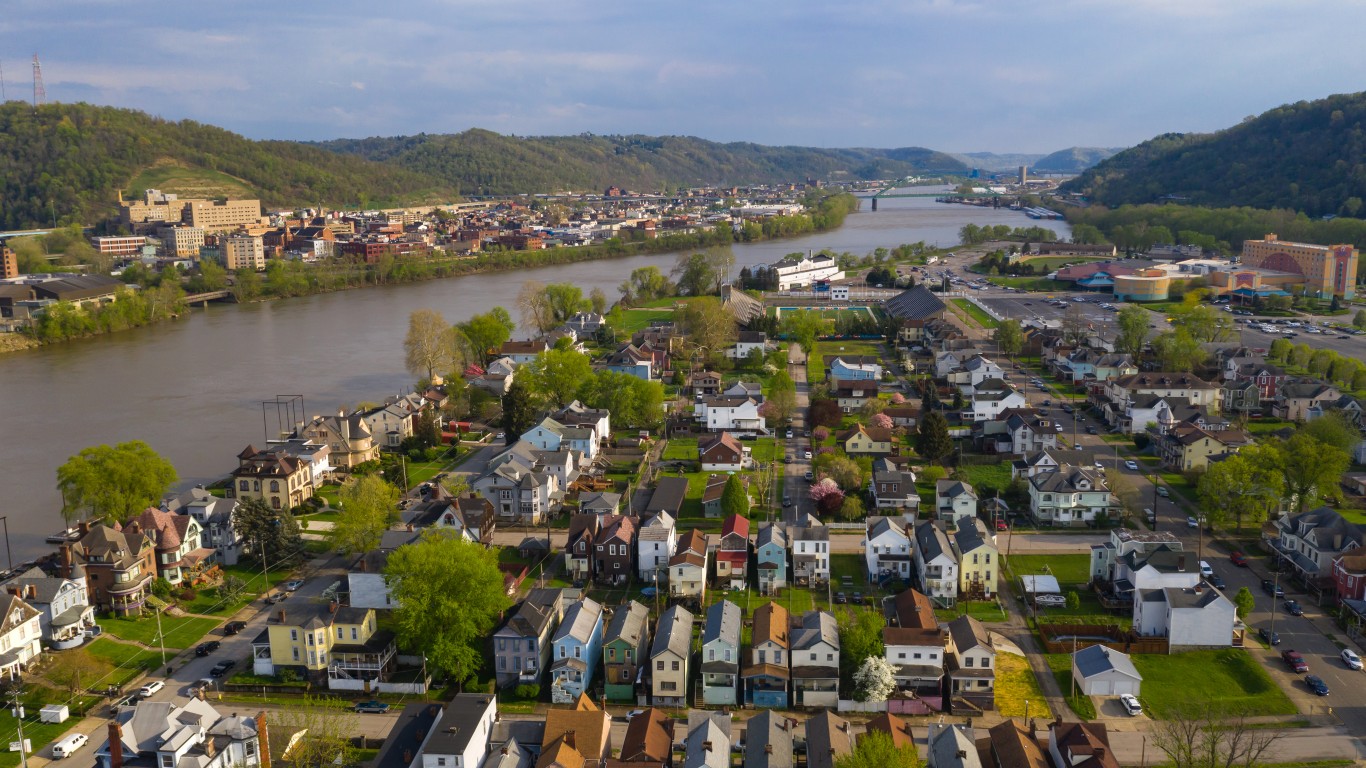
- Avg. time lost to traffic delays in 2022: 12 hours per commuter
- Overall national ranking: tied – 143rd worst of 280 U.S. cities considered
- Change in traffic delays from 2021: +33%
- Avg. commute time in city: 19 minutes (State avg.: 26 minutes)
- Commuters who drive or carpool to work: 9,738; 92.8% of commuters
- Cities considered in state: 2
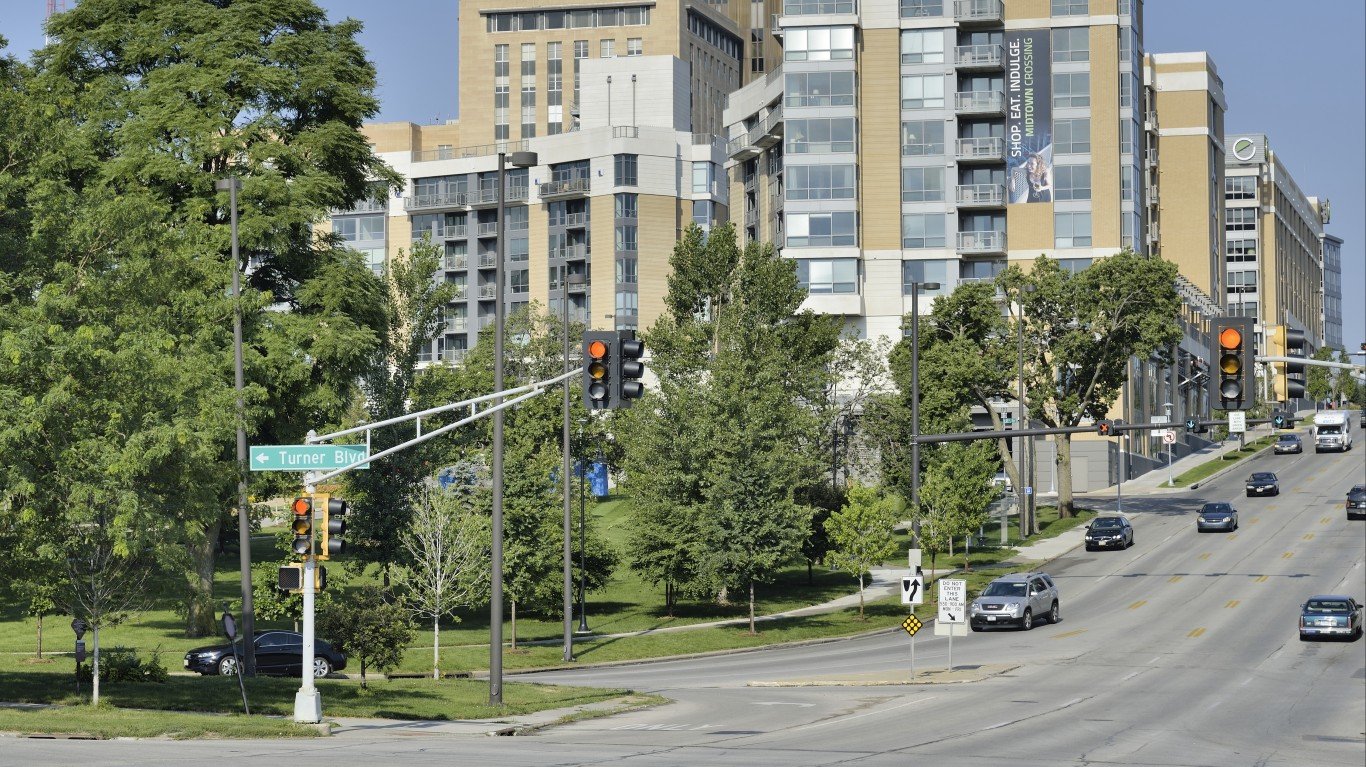
Wisconsin: Milwaukee
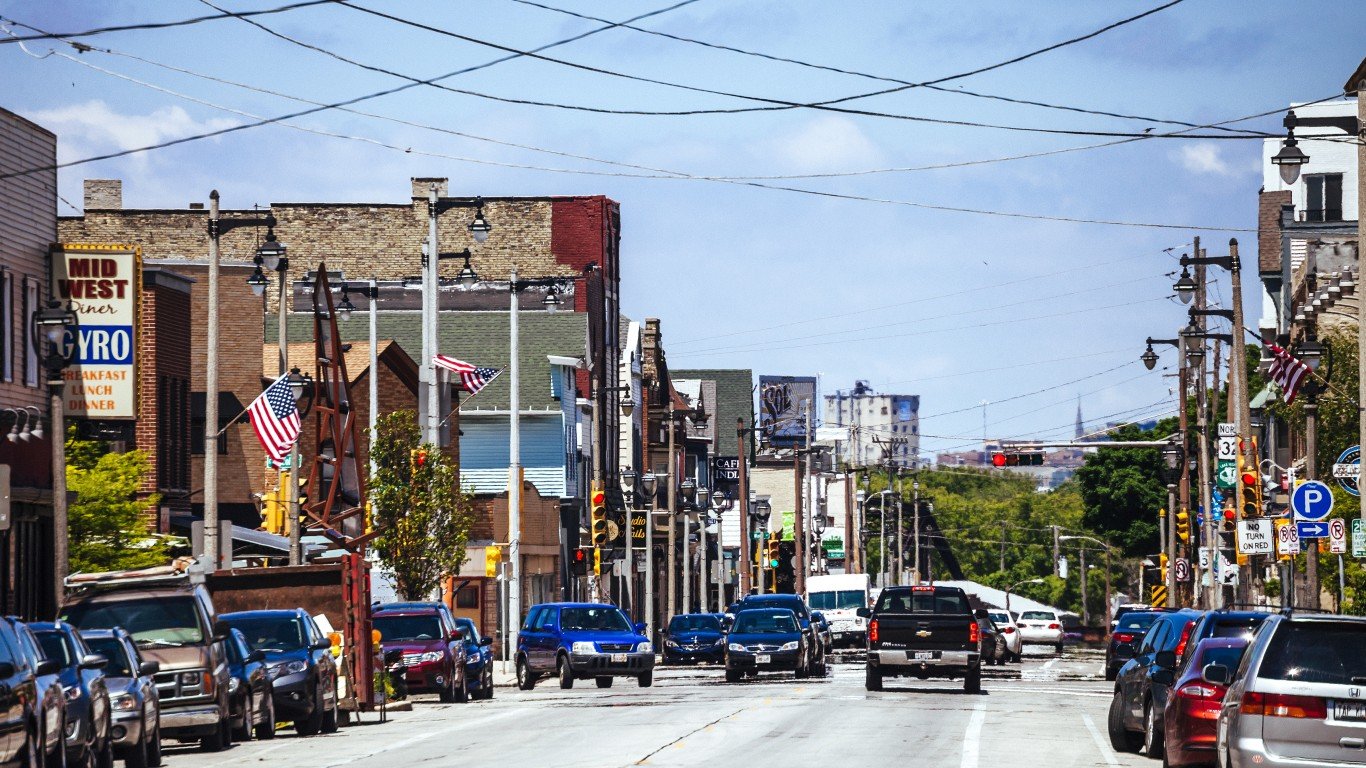
- Avg. time lost to traffic delays in 2022: 32 hours per commuter
- Overall national ranking: tied – 27th worst of 280 U.S. cities considered
- Change in traffic delays from 2021: +47%
- Avg. commute time in city: 22 minutes (State avg.: 22 minutes)
- Commuters who drive or carpool to work: 210,005; 87.5% of commuters
- Cities considered in state: 6
Methodology
24/7 Wall St. reviewed data from the 2022 Global Traffic Scorecard, from INRIX, a traffic data and analytics company to identify the city with the worst traffic in every state. We used the average time the typical commuter lost to traffic congestion in 2022 in the 280 U.S. cities with available data. Within each state, we identified the city with the most time lost to traffic congestion.
Alaska, South Dakota, Vermont, and Wyoming are not included on this list due to a lack of data. We did include Washington, D.C., however, which is one of six states or districts that is home to only one city with available data. In these places, which are noted, the city listed ranks as having the worst traffic by default.
Supplementary data on average commute time for those not working from home and the number and share of commuters who drive or carpool to work are five-year estimates from the U.S. Census Bureau’s 2021 American Community Survey. Due to a lack of ACS data at the city level for Ocean Township, New Jersey, we used data for Monmouth County, which is where Ocean Township is located.
Data on change in the average traffic delays from 2021 is also from INRIX.
Contact [email protected] for any questions or corrections.