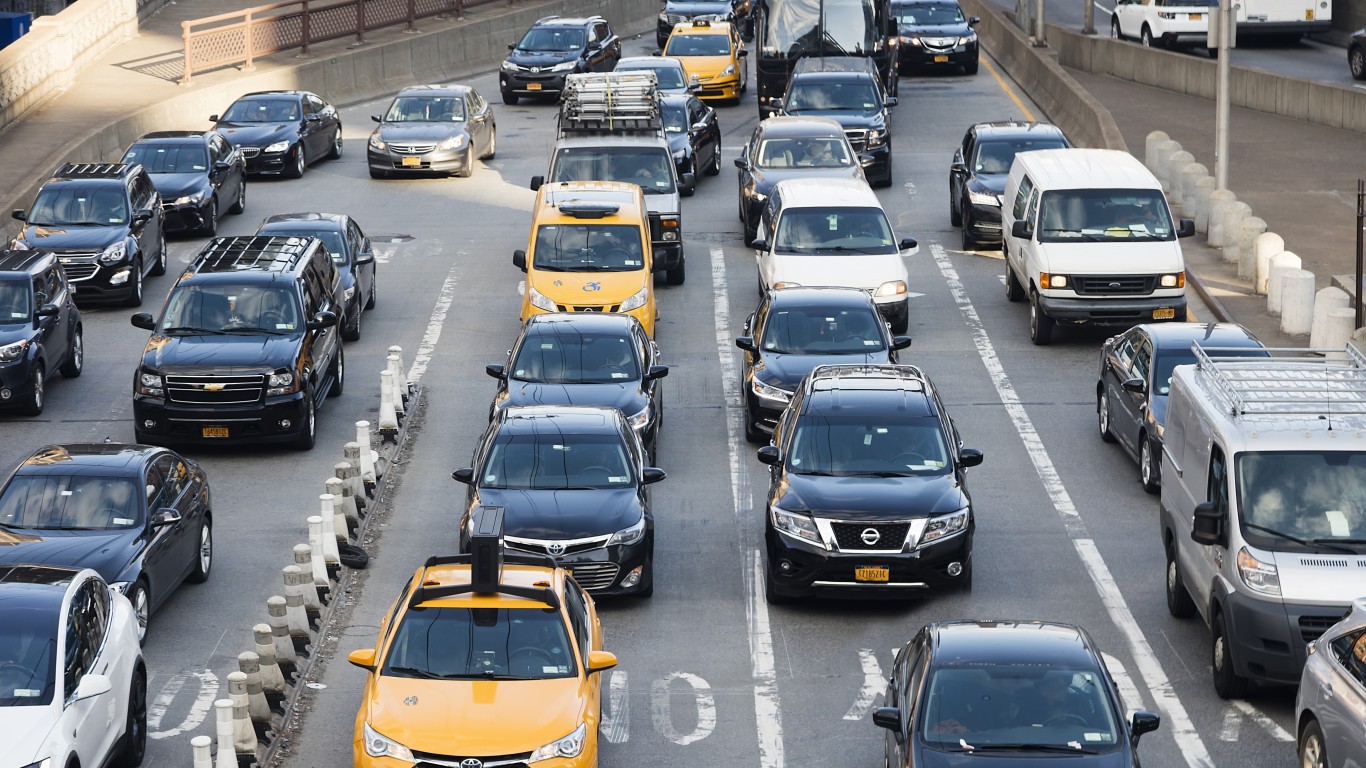
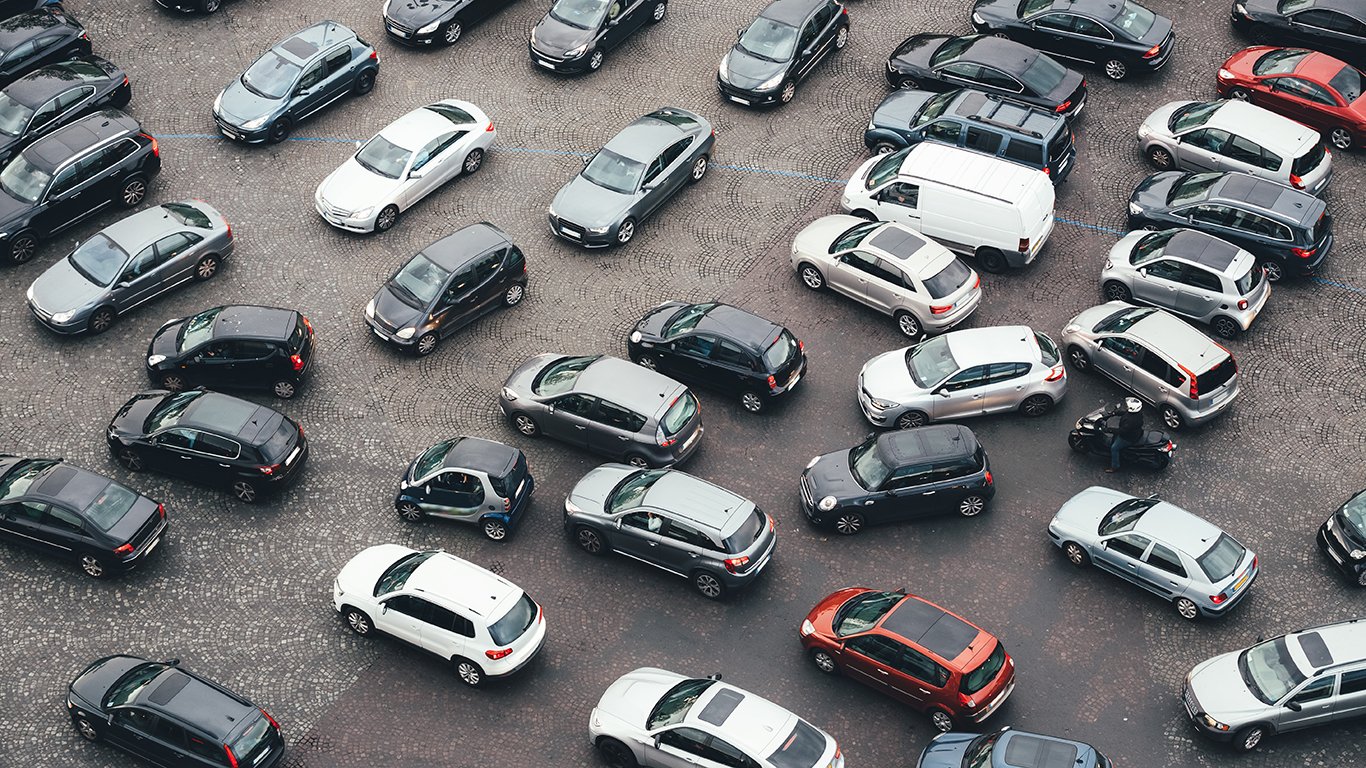
 Urban commuters collectively lost 6.9 billion hours, and 3.1 billion gallons of fuel to traffic delays last year. Excess fuel and lost productivity cost American commuters $160 billion in 2014, up from $114 billion in 2000, and $42 billion in 1982. According to a recent study, the problem is even worse in a handful of large urban areas.
The 2015 Urban Mobility Scorecard, a report released jointly by the Texas A&M Transportation Institute, and Inrix, a traffic data collection company, identified the Washington D.C. urban area as the most congested city in the country. The Los Angeles urban area, where the typical auto commuter spends an additional 80 hours behind the wheel in traffic, was a close second. Some of the country’s largest urban areas are more congested than ever.
Click here to see the cities with the worst traffic.
After a long recovery, jobs that had disappeared with the recession are returning to American cities. The workforce has largely returned to full strength, and the nation’s aging transportation infrastructure is not keeping up with demands of urban populations. In 1982, commuters in major urban areas lost an average of 18 hours annually due to traffic delays. By 2014, the number had more than doubled to an average of 42 hours.
Based on data from 1982 through last year, the researchers argued that “short of major economic problems, congestion will continue to increase if projects, programs, and policies are not expanded.”
Traffic congestion around major American cities also brings heavy costs. In contrast with the nationwide average yearly loss of $960 per auto commuter from delays, the congestion cost in all of the 10 most congested cities exceeded $1,300 per commuter. In the D.C. area, it was $1,834, nearly double the national average.
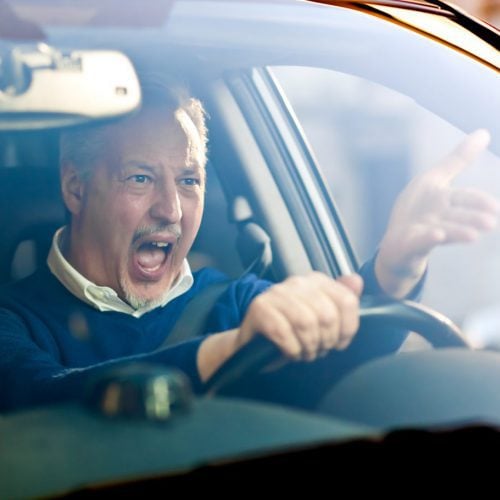
According to researchers at INRIX, the financial burden from traffic congestion is essentially a type of tax, and does not even fully capture the true cost of traffic delays. “The negative effect of uncertain or longer delivery times, missed meetings, business relocations and other congestion-related effects are not included.”
Generally speaking, the larger the city the worse the congestion. Eight of the 10 most congested urban areas have a population of over 3 million, including the areas home to the nation’s three largest cities, New York, Los Angeles, and Chicago. Though the cities with the worst congestion are spread throughout the country, four are located in California.
Many urban commuters avoid suffering through long waits in traffic by resorting alternative modes of transportation. In New York City for example, nearly a third of all commuters use public transportation, a larger share than those who drive, and a higher percentage than in any other U.S. city. Not every city has a reliable public alternative to driving, however. In Houston, Texas, the eighth most congested city and one notable for its sprawl, less than 3% of commuters use public transit.
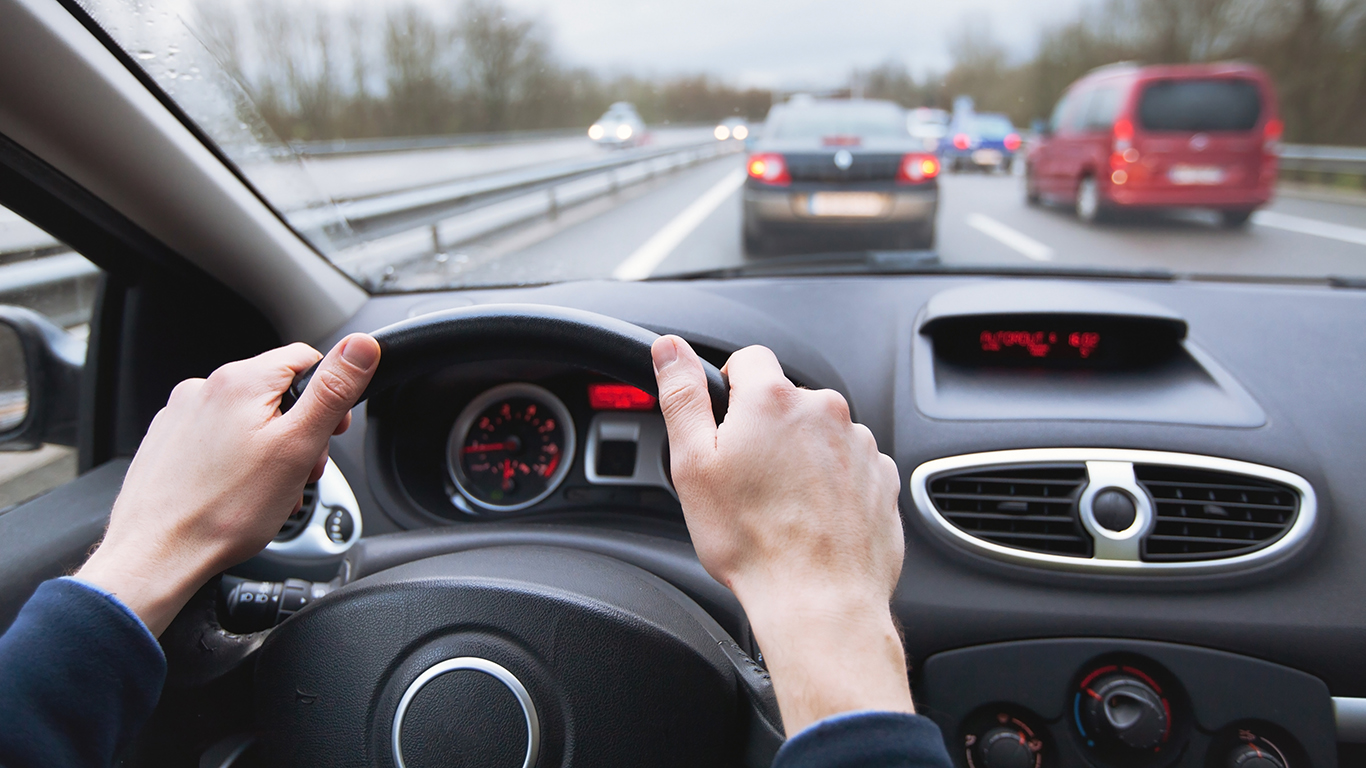
While commuters in the D.C. area suffered longer than anyone else, the effects of congestion can be measured in many ways. The study uses a measure called the Travel Time Index, or TTI, which is the “ratio of travel time in the peak period to travel time at free-flow conditions.” For example, an index of 1.30 indicates that what would be a 20-minute drive without traffic would take 26 minutes in a peak period.
To determine the 10 most congested cities in America, 24/7 Wall St. reviewed the highest estimated number of hours lost per auto commuter annually to traffic delays in 470 U.S. urban areas. Data was provided by the 2015 Urban Mobility Scorecard, a report released jointly by the Texas A&M Transportation Institute, and Inrix. Total hours lost to delays, total and per auto commuter excess fuel consumed, as well as estimated costs associated with congestion also came from the Scorecard. Average gas prices for the year, which were a component of the cost calculation, also came from Inrix and Texas A&M. The researchers also created three indices measuring the degree to which commuters needed to plan ahead for traffic delays (Freeway Planning Index), how long driving takes during peak hours versus normal hours (Freeway Travel Time Index), and the estimated level of stress during rush hours (Freeway Commuter Stress Index). used the estimated time lost to traffic delays annually per driver in major urban areas across the country. We also reviewed average commute times, the percentage of workers who used public transit, and the percentage of workers who walked to work from the U.S. Census Bureau’s 2013 American Community Survey.
These are the cities with the worst traffic.
10. Riverside-San Bernardino, CA
> Annual hours lost per commuter: 59
> Total annual hours of delay: 99.1 million
> Annual cost per commuter: $1,316
> Total congestion cost: $2.2 billion
The Riverside urban area trails just nine other traffic-plagued urban regions, with the average commuter delayed 59 hours each year. This exceeded the average yearly delay of 45 hours for cities with between 1 million and 3 million residents. While many residents of large cities — especially cities with the worst traffic — rely on public transportation to avoid traffic congestion, this is not the case in Riverside. The more than 1 million Riverside commuters who drive make up over half of all area residents. Periods of peak congestion vary considerably across large urban areas. The area’s daily rush hour extends to about 6.8 hours per day, second only to Los Angeles. The average cost of gas in the Riverside area was among the highest in the nation, further exacerbating the cost associated with traffic in the area.
9. Houston, TX
> Annual hours lost per commuter: 61
> Total annual hours of delay: 203.2 million
> Annual cost per commuter: $1,490
> Total congestion cost: $4.9 billion
Commuters in Houston not only face the worst traffic in Texas, but also some of the worst traffic in the country. Only three cities in the United States have a higher total monetary congestion cost than Houston. The heavy traffic cost drivers and the local economy $4.9 billion in added fuel costs and lost productivity due to delays. Not only is the congestion expensive, but also daily commuters in Texas’s largest city spend an additional 61 hours in their cars every year — nearly 10 more hours than what Houston commuters faced in 2011.
8. Chicago, IL-IN
> Annual hours lost per commuter: 61
> Total annual hours of delay: 302.6 million
> Annual cost per commuter: $1,445
> Total congestion cost: $7.2 billion
Roughly 8.7 million people live in the Chicago urban area, a larger population than all but two other U.S. urban regions. Nearly 3.5 million people drive to work. Five of the 20 most congested stretches of U.S. road are in the Chicago area, including I-90 and both the east and westbound I-94. Congestion is very costly for the city’s residents and its government. Because of travel disruptions such as accidents, weather, and other unpredictable events, drivers spend an additional 61 hours driving in the area. The delays cost just under $1,500 per driver, well above the nationwide average of $960 per-commuter.
7. Seattle, WA
> Annual hours lost per commuter: 63
> Total annual hours of delay: 139.8 million
> Annual cost per commuter: $1,491
> Total congestion cost: $3.3 billion
While rush hour traffic is bad in all large American cities, it is especially bad in Seattle. Drivers in the city spend an additional 63 hours behind the wheel every year due to congestion. The average driver buys 28 extra gallons of fuel annually due to lost fuel efficiency from slow travel speeds in traffic. Additional fuel and lost productivity cost Seattle $1,491 per commuter a year. With a Travel Time Index of 1.38, it takes a Seattle driver over 41 minutes in peak hours to travel what would take 30 minutes without traffic.
ALSO READ: The Healthiest Cities in Every State
6. Boston, MA-NH-RI
> Annual hours lost per commuter: 64
> Total annual hours of delay: 154.0 million
> Annual cost per commuter: $1,388
> Total congestion cost: $3.4 billion
Spanning three states in New England, the Boston urban area has some of the worst traffic congestion in the country. Congestion cost the capital of Massachusetts $1,388 per driver a year in lost productivity and added fuel costs due to traffic. In addition to the high monetary costs, area commuters spend an additional 64 hours behind the wheel every year on average. Drivers in only five other U.S. cities lose more time to congestion than Bostonians.
5. San Jose, CA
> Annual hours lost per commuter: 67
> Total annual hours of delay: 104.6 million
> Annual cost per commuter: $1,422
> Total congestion cost: $2.2 billion
San Jose is one of only two highly congested urban areas with population of less than 3 million. Even with a smaller population, San Jose’s travel index of 1.38 is tied for third highest in the country and higher than the average index of 1.32 for urban areas with over 3 million people,which tend to have worse traffic than smaller urban areas. According to the area’s travel index, a distance that would only take a driver 20 minutes to travel with no congestion takes nearly 28 minutes during peak travel hours. Congestion on the area’s roadways cost drivers and the city a collective $2.2 billion annually in both fuel costs and lost productivity.
ALSO READ: The Most Expensive States to Drive
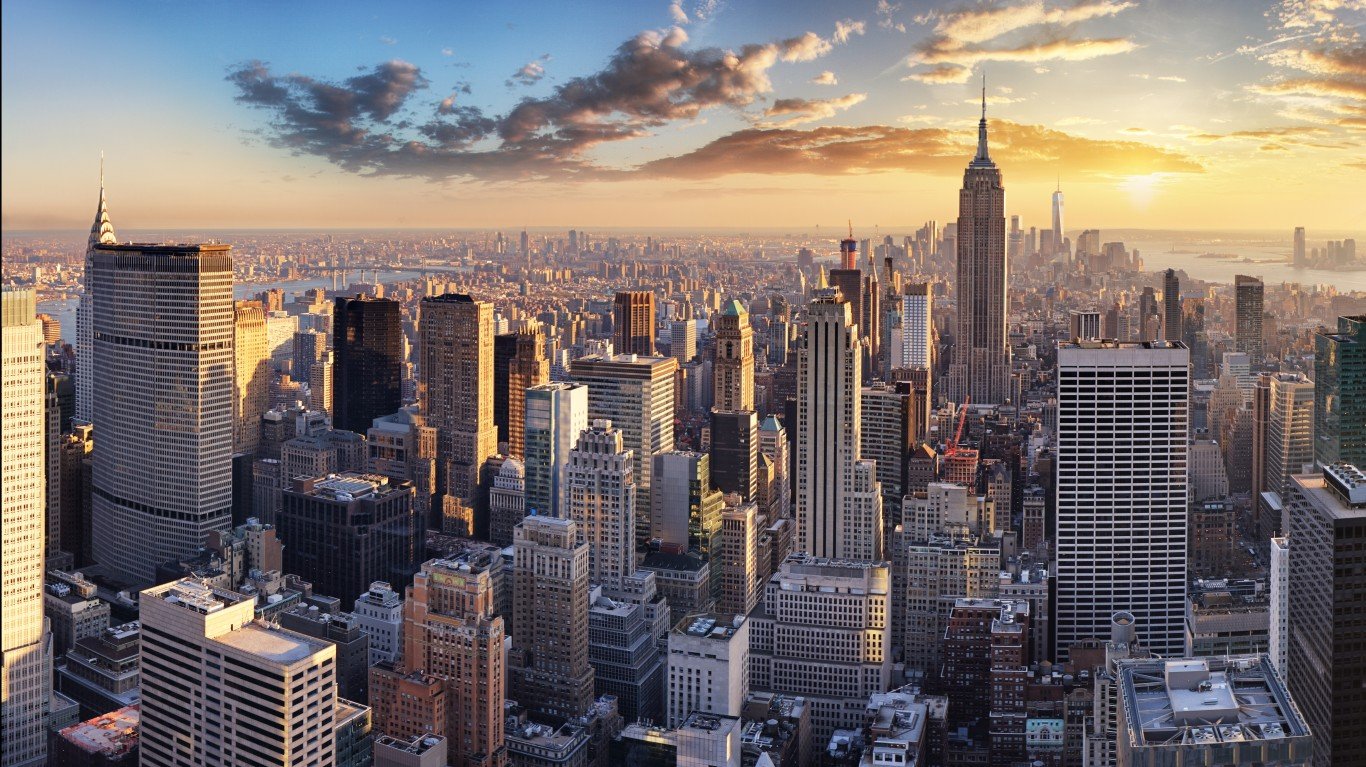
4. New York-Newark, NY-NJ-CT
> Annual hours lost per commuter: 74
> Total annual hours of delay: 628.2 million
> Annual cost per commuter: $1,739
> Total congestion cost: $14.7 billion
The New York urban area is the most populous in the nation, and is home to over 19 million people. Partially as a result, both delays due to traffic and congestion costs are highest in the country. Auto commuters lose more than 628 million hours to delays each year, costing roughly $14.7 billion, the highest added driving time and the most costly traffic system among U.S. cities. Four of the nation’s 20 most congested stretches of road are in the New York City area, including the northbound I-678, and both directions of I-495.
Most New York residents choose to avoid traffic. Just over 27% of the area’s population commutes by car, the lowest share among the 101 cities the TTI reviewed. And 32.6% of workers use public transit, the largest share nationwide.
3. San Francisco-Oakland, CA
> Annual hours lost per commuter: 78
> Total annual hours of delay: 146.0 million
> Annual cost per commuter: $1,675
> Total congestion cost: $3.1 billion
California is home to four of the most congested urban areas in the country, including San Francisco-Oakland. Drivers in the Bay Area lose a collective 146 million hours annually to roadway congestion. Between fuel and lost productivity, roadway traffic costs the city and its drivers an additional $1,675 per driver every year. Perhaps as a result, over 18% of area commuters use public transportation to get to work, the second highest share in the country after New York. An additional 5.3% of Bay Area residents walk to work, the sixth highest share of the nation’s urban areas.
ALSO READ: The Most Dangerous Cars in America
2. Los Angeles-Long Beach-Anaheim, CA
> Annual hours lost per commuter: 80
> Total annual hours of delay: 622.5 million
> Annual cost per commuter: $1,711
> Total congestion cost: $13.3 billion
US-101 south and northbound, and I-10 eastbound — all in the Los Angeles area — led the nation’s most congested corridors. Half of the 20 worst roads for traffic are in Los Angeles-Long Beach-Anaheim. A typical Los Angeles area commuter spends an estimated additional 80 hours in traffic per year due to delays, slightly less than auto commuters in Washington D.C. However, traffic conditions are more unpredictable in the LA area, which may cause more stress even than in the D.C. area. The area’s traffic system is congested nearly eight hours during a typical day, the longest rush hour compared with other U.S. cities.
1. Washington DC-VA-MD
> Annual hours lost per commuter: 82
> Total annual hours of delay: 204.4 million
> Annual cost per commuter: $1,834
> Total congestion cost: $4.6 billion
Washington D.C. commuters waste more time in traffic than residents of any other city. A typical area commuter spends an additional 82 hours behind the wheel each year due to traffic delays. As in most traffic-plagued cities, drivers in the nation’s capital spent less than half that time in traffic in 1982. Like some other congested cities, the Washington D.C. area’s population also tends to use public transit. In 2013, 16.5% of workers used public transportation, the third highest share nationwide. Given the estimated annual costs of sitting in traffic, this is not particularly surprising. Excess fuel consumed and lost productivity due to congestion cost each commuter $1,834 per year on average, the highest such cost among all U.S. cities reviewed.
Contact [email protected] for any questions or corrections.