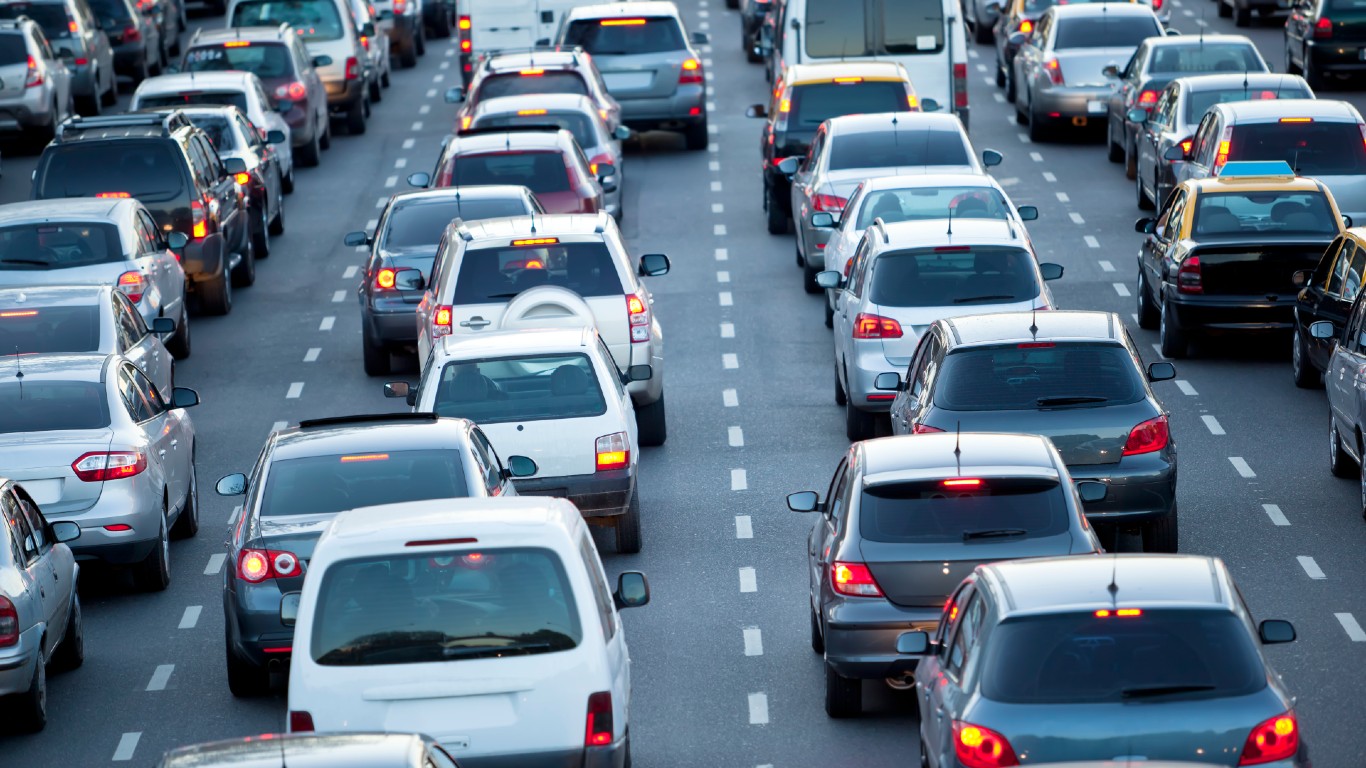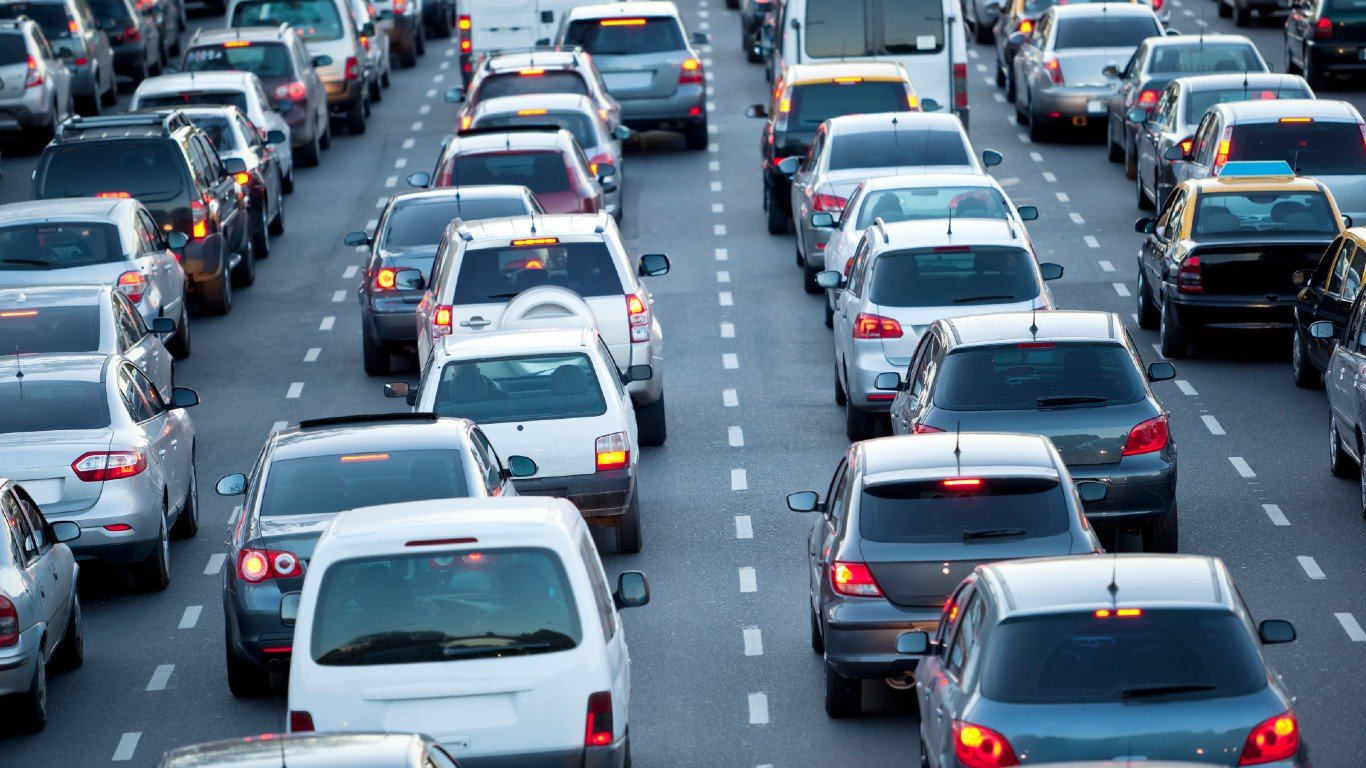
During the COVID-19 pandemic, American motorists have decreased their amount of driving precipitously as they worked remotely instead of commuting and stayed at home instead of going out to restaurants, shows, and sporting events. Counterintuitively, however, that has not resulted in safer roads.
To find the most dangerous city for driving, RV rental company Outdoorsy researchers created a composite index, combining relative likelihood of a collision, total motor vehicle fatalities, and share of fatal collisions involving a drunk driver. According to the results, Dallas ranks as the city with the most dangerous roads, beating out Baton Rouge, Louisiana, and San Bernardino, California, in second and third places, respectively.
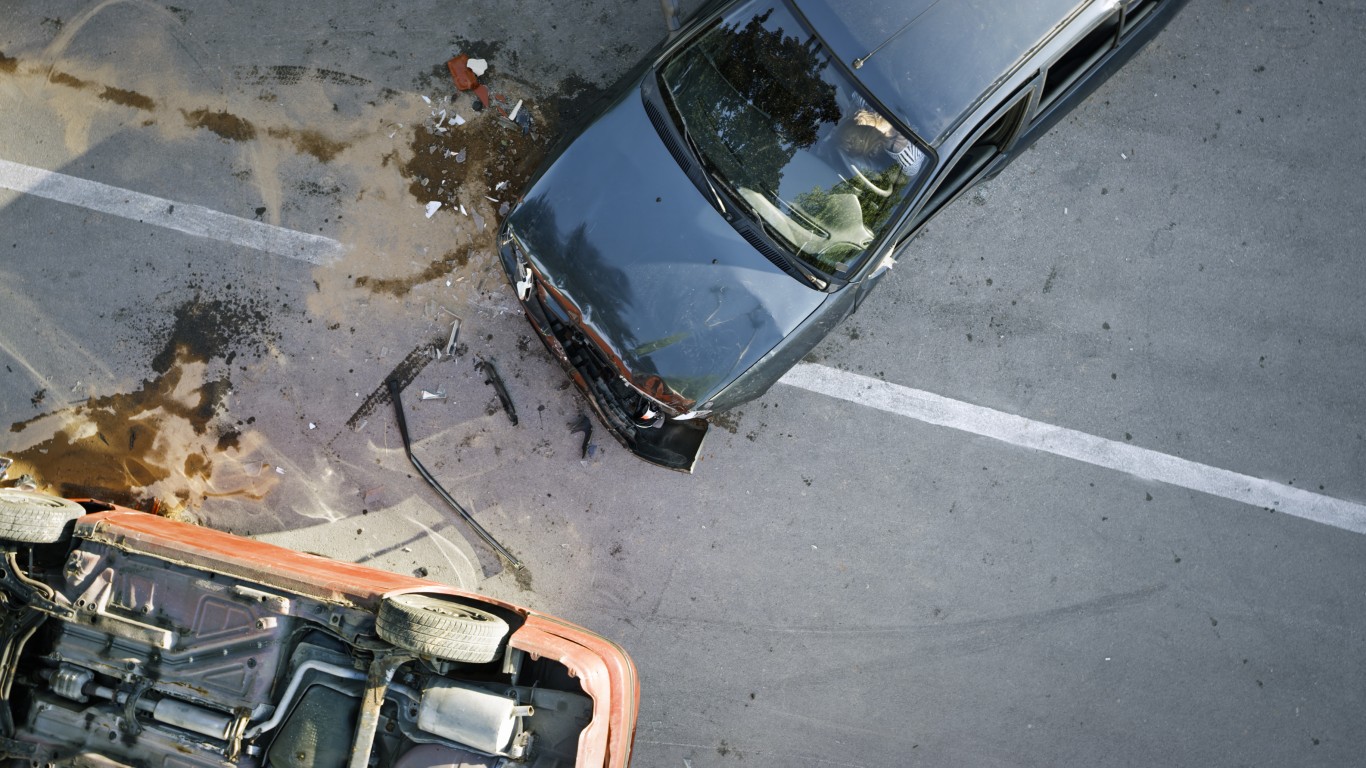
“Unfortunately, the pandemic and the resulting economic dislocations and stay-at-home orders have been accompanied by a sharp increase in risky driving and fatal crashes,” wrote the National Highway Traffic Safety Administration (NHTSA) in January, in ”An Open Letter to the Driving Public.”
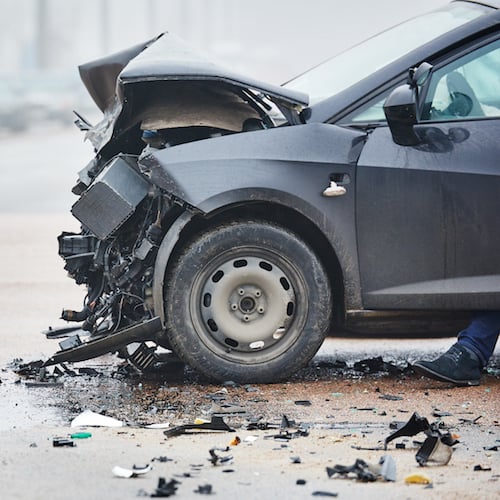
Before 2020, driving was already risky enough. In 2019, road accidents killed more than 36,000 people in the U.S. and injured more than 2.7 million, according to NHTSA.
Preliminary data for 2020, the agency said, suggests a sharp increase in risky behavior behind the wheel and more fatal crashes. People were driving faster in select metropolitan areas, were driving while impaired by drugs or alcohol, and were not wearing seat belts. (In April of last year, double the usual number of people were thrown from their vehicles during crashes.)
Some U.S. cities are more perilous than others. In addition to differences in driver behavior, this may be due to the fact that speed limits and other traffic safety laws vary from state to state, and the fact that road maintenance is better in some places than others.
This ranking of America’s most dangerous cities for drivers as of 2019 is based on information collated from both governmental and private sources by the RV rental company Outdoorsy.
Researchers analyzed data from the National Highway Traffic Safety Administration’s Fatality Analysis Reporting System, Allstate America’s Best Drivers Report 2019, and the U.S. Census Bureau. Only major American cities with data available from all three data sources were included, and in the event of a tie, the city with the longest period between collisions ranked better.
Click here to see the most dangerous cities for driving.
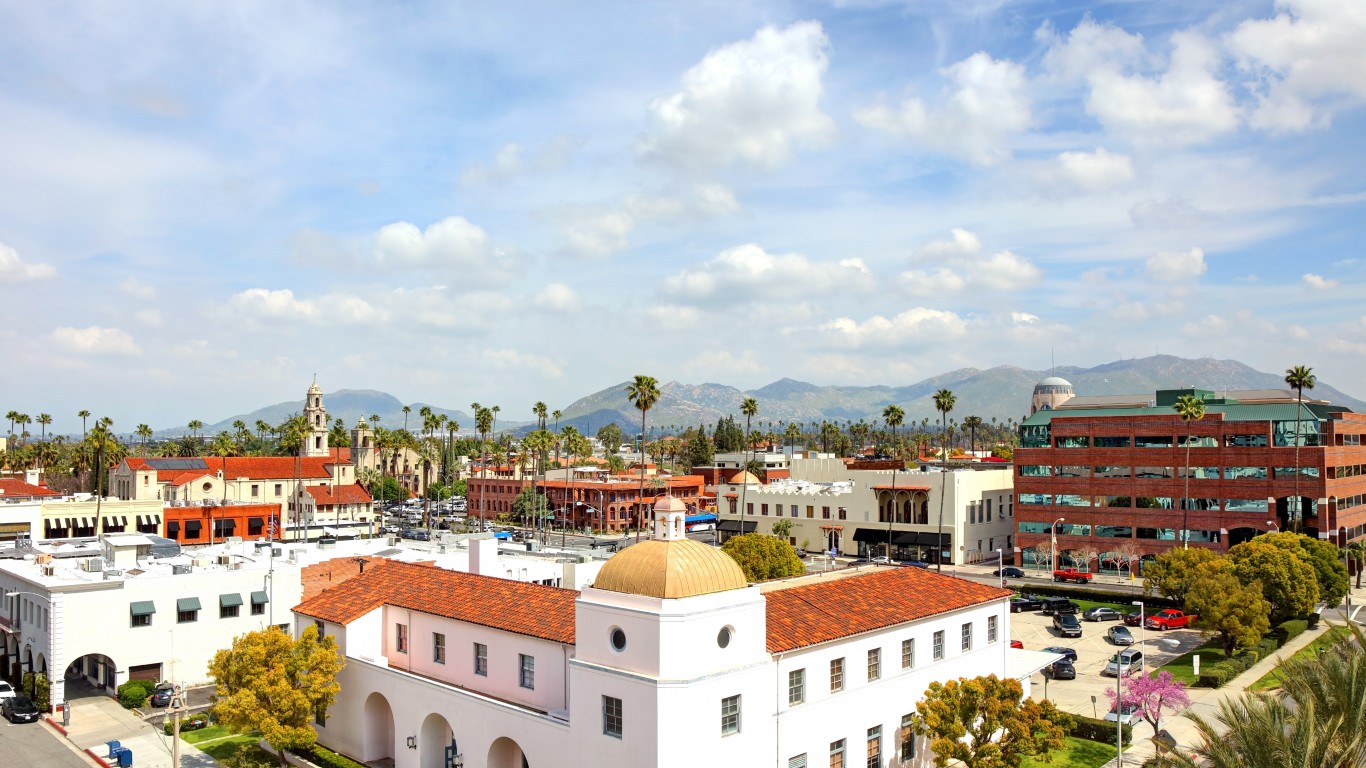
25. Riverside, California
> Avg. time between collisions: 8.3 years
> Likelihood of collision compared to US avg.: +28.2% — #63 out of 194 cities
> Motor vehicle fatalities per 100k: 9.2 — #69 out of 194 cities
> Population: 331,369
[in-text-ad]

24. Lancaster, California
> Avg. time between collisions: 9.1 years
> Likelihood of collision compared to US avg.: +16.3% — #98 out of 194 cities
> Motor vehicle fatalities per 100k: 13.8 — #24 out of 194 cities
> Population: 157,604
[recirclink id=837738]

23. Savannah, Georgia
> Avg. time between collisions: 7.7 years
> Likelihood of collision compared to US avg.: +37.8% — #42 out of 194 cities
> Motor vehicle fatalities per 100k: 12.1 — #35 out of 194 cities
> Population: 144,457
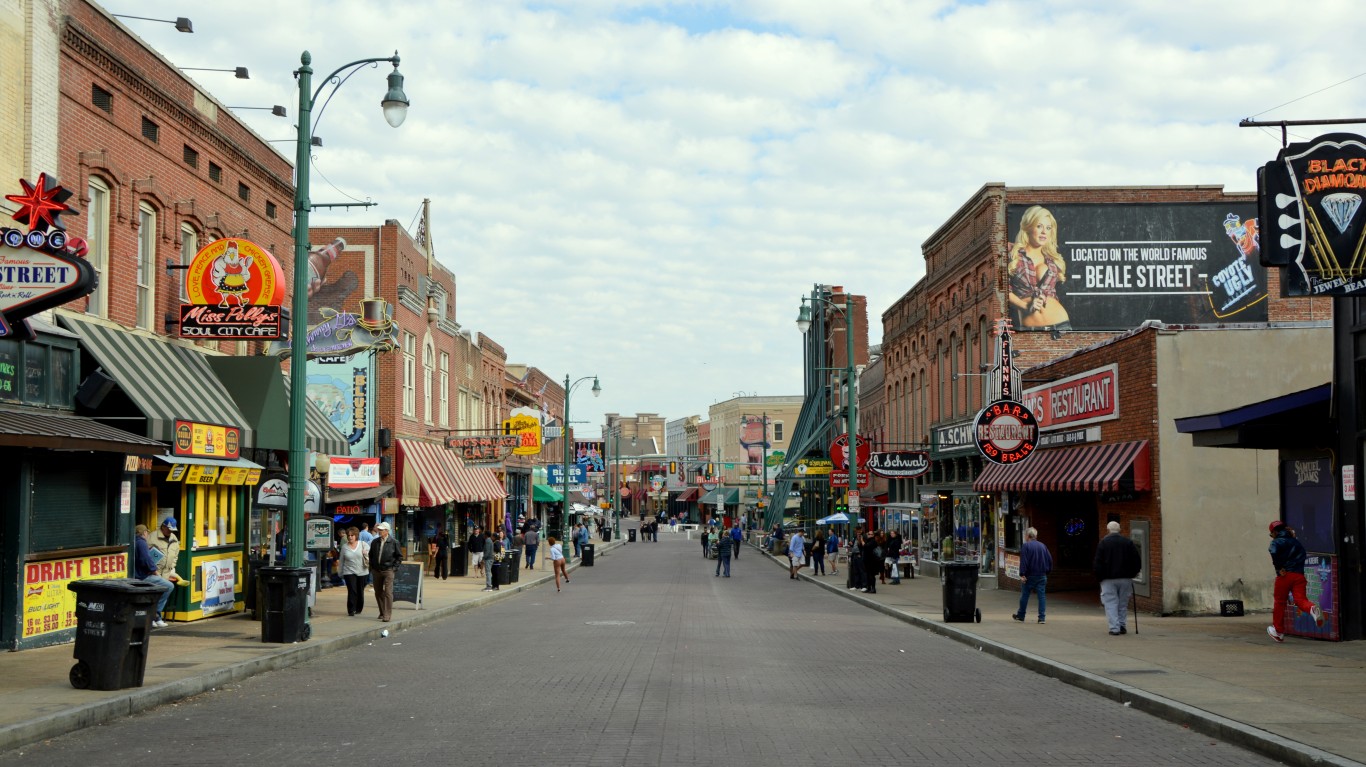
22. Memphis, Tennessee
> Avg. time between collisions: 9.1 years
> Likelihood of collision compared to US avg.: +16.9% — #96 out of 194 cities
> Motor vehicle fatalities per 100k: 17.6 — #10 out of 194 cities
> Population: 651,088
[in-text-ad-2]

21. Jackson, Mississippi
> Avg. time between collisions: 9.7 years
> Likelihood of collision compared to US avg.: +8.8% — #125 out of 194 cities
> Motor vehicle fatalities per 100k: 18.9 — #7 out of 194 cities
> Population: 160,532

20. Irving, Texas
> Avg. time between collisions: 7.0 years
> Likelihood of collision compared to US avg.: +50.8% — #20 out of 194 cities
> Motor vehicle fatalities per 100k: 6.4 — #124 out of 194 cities
> Population: 239,779
[in-text-ad]
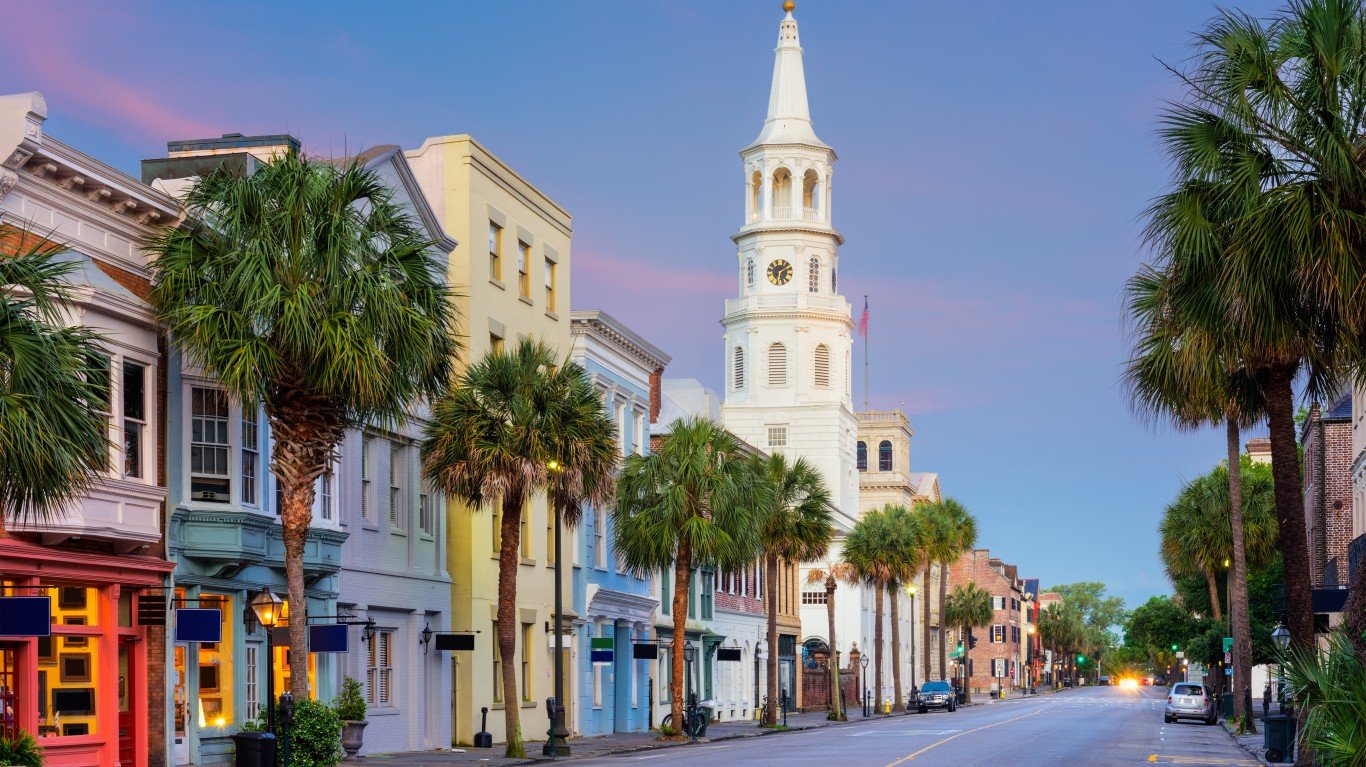
19. Charleston, South Carolina
> Avg. time between collisions: 9.4 years
> Likelihood of collision compared to US avg.: +12.7% — #115 out of 194 cities
> Motor vehicle fatalities per 100k: 21.7 — #2 out of 194 cities
> Population: 143,151
[recirclink id=683094]

18. Modesto, California
> Avg. time between collisions: 7.9 years
> Likelihood of collision compared to US avg.: +34.3% — #46 out of 194 cities
> Motor vehicle fatalities per 100k: 9.2 — #69 out of 194 cities
> Population: 215,196
17. Mesquite, Texas
> Avg. time between collisions: 7.6 years
> Likelihood of collision compared to US avg.: +38.4% — #40 out of 194 cities
> Motor vehicle fatalities per 100k: 8.7 — #76 out of 194 cities
> Population: 140,795
[in-text-ad-2]

16. Arlington, Texas
> Avg. time between collisions: 7.6 years
> Likelihood of collision compared to US avg.: +40.0% — #36 out of 194 cities
> Motor vehicle fatalities per 100k: 6.9 — #110 out of 194 cities
> Population: 398,860

15. Sacramento, California
> Avg. time between collisions: 7.6 years
> Likelihood of collision compared to US avg.: +40.0% — #36 out of 194 cities
> Motor vehicle fatalities per 100k: 11.2 — #48 out of 194 cities
> Population: 513,620
[in-text-ad]

14. St. Louis, Missouri
> Avg. time between collisions: 8.6 years
> Likelihood of collision compared to US avg.: +22.4% — #81 out of 194 cities
> Motor vehicle fatalities per 100k: 18.3 — #8 out of 194 cities
> Population: 300,576
[recirclink id=847663]

13. Charlotte, North Carolina
> Avg. time between collisions: 7.8 years
> Likelihood of collision compared to US avg.: +36.0% — #45 out of 194 cities
> Motor vehicle fatalities per 100k: 10.4 — #58 out of 194 cities
> Population: 885,707

12. Austin, Texas
> Avg. time between collisions: 7.6 years
> Likelihood of collision compared to US avg.: +39.2% — #38 out of 194 cities
> Motor vehicle fatalities per 100k: 8.4 — #79 out of 194 cities
> Population: 979,263
[in-text-ad-2]

11. San Antonio, Texas
> Avg. time between collisions: 8.2 years
> Likelihood of collision compared to US avg.: +29.0% — #59 out of 194 cities
> Motor vehicle fatalities per 100k: 9.7 — #67 out of 194 cities
> Population: 1,547,250

10. Cleveland, Ohio
> Avg. time between collisions: 8.9 years
> Likelihood of collision compared to US avg.: +19.0% — #89 out of 194 cities
> Motor vehicle fatalities per 100k: 12.3 — #33 out of 194 cities
> Population: 380,989
[in-text-ad]

9. Cincinnati, Ohio
> Avg. time between collisions: 7.2 years
> Likelihood of collision compared to US avg.: +47.6% — #27 out of 194 cities
> Motor vehicle fatalities per 100k: 8.7 — #76 out of 194 cities
> Population: 303,954
[recirclink id=826988]

8. Houston, Texas
> Avg. time between collisions: 7.7 years
> Likelihood of collision compared to US avg.: +38.1% — #41 out of 194 cities
> Motor vehicle fatalities per 100k: 10.1 — #63 out of 194 cities
> Population: 2,316,797

7. Detroit, Michigan
> Avg. time between collisions: 8.6 years
> Likelihood of collision compared to US avg.: +22.9% — #79 out of 194 cities
> Motor vehicle fatalities per 100k: 16.1 — #16 out of 194 cities
> Population: 670,052
[in-text-ad-2]

6. Fort Worth, Texas
> Avg. time between collisions: 8.2 years
> Likelihood of collision compared to US avg.: +29.7% — #58 out of 194 cities
> Motor vehicle fatalities per 100k: 11.5 — #45 out of 194 cities
> Population: 913,656
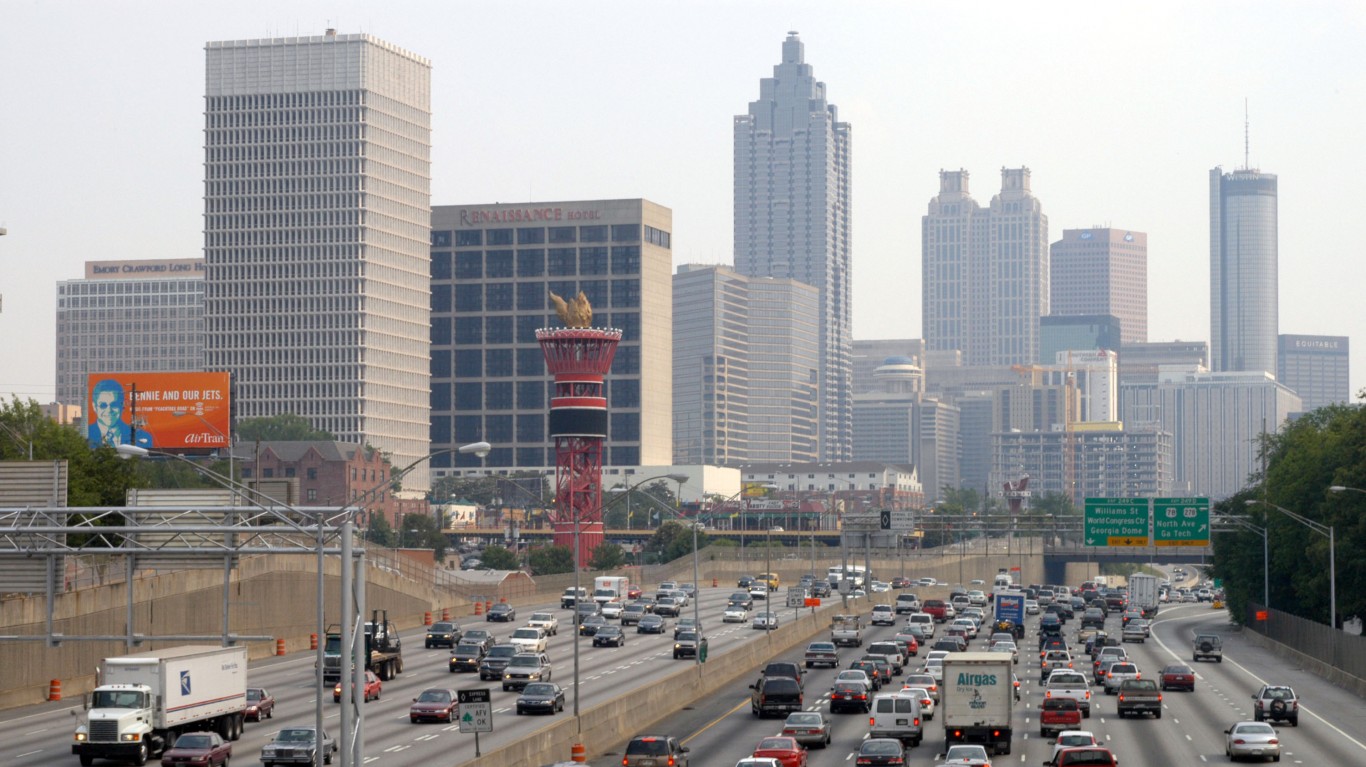
5. Atlanta, Georgia
> Avg. time between collisions: 7.1 years
> Likelihood of collision compared to US avg.: +49.5% — #21 out of 194 cities
> Motor vehicle fatalities per 100k: 13.5 — #26 out of 194 cities
> Population: 506,804
[in-text-ad]

4. New Orleans, Louisiana
> Avg. time between collisions: 7.1 years
> Likelihood of collision compared to US avg.: +49.1% — #23 out of 194 cities
> Motor vehicle fatalities per 100k: 11.1 — #49 out of 194 cities
> Population: 390,144
[recirclink id=730208]
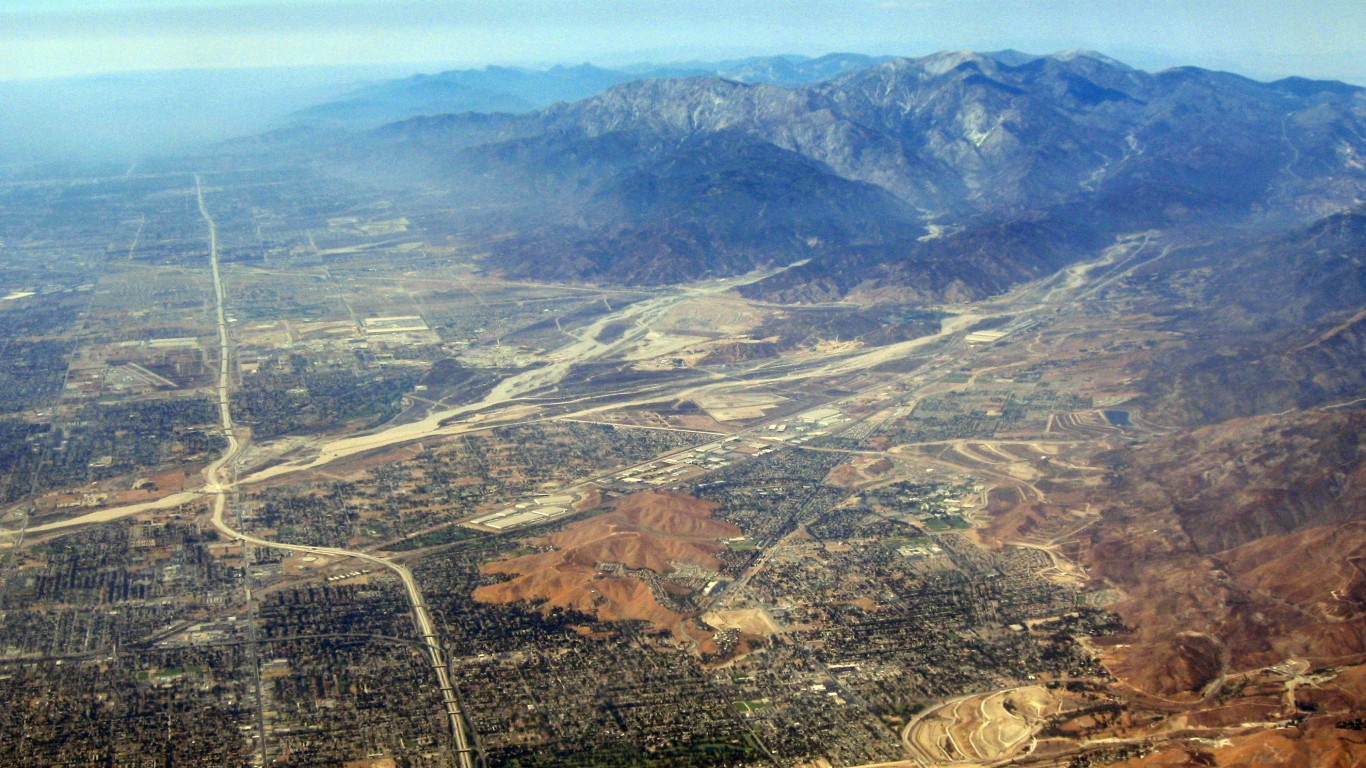
3. San Bernardino, California
> Avg. time between collisions: 7.5 years
> Likelihood of collision compared to US avg.: +41.8% — #33 out of 194 cities
> Motor vehicle fatalities per 100k: 17.9 — #9 out of 194 cities
> Population: 215,780

2. Baton Rouge, Louisiana
> Avg. time between collisions: 6.8 years
> Likelihood of collision compared to US avg.: +55.1% — #13 out of 194 cities
> Motor vehicle fatalities per 100k: 21.9 — #1 out of 194 cities
> Population: 220,248
[in-text-ad-2]

1. Dallas, Texas
> Avg. time between collisions: 7.2 years
> Likelihood of collision compared to US avg.: +46.5% — #28 out of 194 cities
> Motor vehicle fatalities per 100k: 14.3 — #21 out of 194 cities
> Population: 1,343,565