For many, homeownership is the cornerstone of the American Dream. As of January 2021, a typical single-family home in the United States costs $269,039. Of course, home values are not uniform across the country, and in some states, the typical home costs far more than the national average — while in others, homes cost far less.
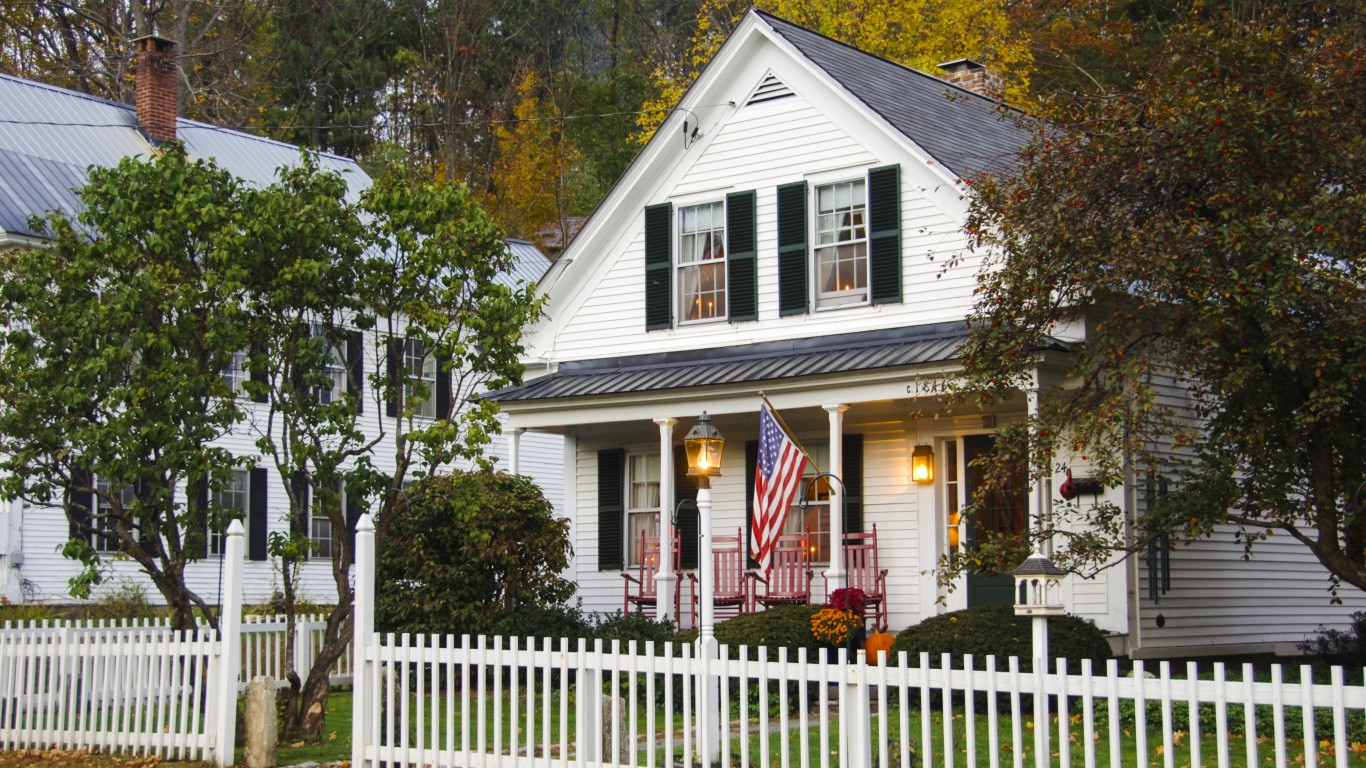
According to estimates from Zillow, a Seattle-based real estate data company, the value of a typical single-family home in Vermont is $277,364, about 3% higher than the national average.
Housing prices are determined by supply and demand forces as well as what local residents are willing to pay — and that is influenced largely by what they can afford. As a result, areas with higher than average home values often also have higher-income residents. Vermont is an exception, however. The typical household in the state earns $63,001 annually, $2,700 less than the national median household income of $65,712.
Just as home values are higher than average in Vermont, the overall cost of living is too. The average cost of goods and services across the state are 3% more than they do nationwide, on average.
Across Vermont, home values are climbing at a relatively slow pace. The value of a single-family home across the state increased by 6.06% over the one year period from January 2020 to January 2021, 3.05 percentage points slower than the average national one-year home value appreciation of 9.12%.
| State: | Value of a typical single-family home: | 1-yr. increase in home value: | Median household income: |
|---|---|---|---|
| Hawaii | $683,470 | 4.7% | $83,102 |
| California | $624,977 | 10.5% | $80,440 |
| Massachusetts | $474,673 | 10.4% | $85,843 |
| Washington | $470,304 | 12.7% | $78,687 |
| Colorado | $442,766 | 8.6% | $77,127 |
| Oregon | $402,573 | 10.0% | $67,058 |
| Utah | $401,053 | 13.3% | $75,780 |
| New Jersey | $376,866 | 10.6% | $85,751 |
| New York | $350,545 | 7.7% | $72,108 |
| Idaho | $348,483 | 18.9% | $60,999 |
| Maryland | $341,148 | 8.5% | $86,738 |
| Rhode Island | $340,811 | 11.9% | $71,169 |
| Nevada | $332,501 | 8.6% | $63,276 |
| New Hampshire | $330,976 | 12.4% | $77,933 |
| Montana | $324,813 | 9.8% | $57,153 |
| Arizona | $315,554 | 16.5% | $62,055 |
| Virginia | $307,964 | 7.8% | $76,456 |
| Alaska | $292,066 | 0.6% | $75,463 |
| Connecticut | $288,822 | 11.5% | $78,833 |
| Delaware | $284,787 | 9.6% | $70,176 |
| Minnesota | $283,127 | 8.0% | $74,593 |
| Vermont | $277,364 | 6.1% | $63,001 |
| Maine | $276,023 | 12.3% | $58,924 |
| Florida | $270,560 | 8.6% | $59,227 |
| Wyoming | $262,517 | 3.6% | $65,003 |
| North Dakota | $239,464 | 2.7% | $64,577 |
| New Mexico | $229,947 | 11.0% | $51,945 |
| North Carolina | $225,740 | 9.3% | $57,341 |
| South Dakota | $225,662 | 5.7% | $59,533 |
| Texas | $224,466 | 7.5% | $64,034 |
| Georgia | $223,945 | 9.2% | $61,980 |
| Illinois | $219,806 | 6.2% | $69,187 |
| Pennsylvania | $215,939 | 9.6% | $63,463 |
| Wisconsin | $213,537 | 9.6% | $64,168 |
| Tennessee | $207,727 | 10.3% | $56,071 |
| South Carolina | $206,647 | 7.9% | $56,227 |
| Nebraska | $192,584 | 7.4% | $63,229 |
| Michigan | $192,093 | 9.9% | $59,584 |
| Missouri | $180,253 | 9.1% | $57,409 |
| Louisiana | $178,987 | 4.5% | $51,073 |
| Indiana | $172,769 | 9.3% | $57,603 |
| Ohio | $168,226 | 10.4% | $58,642 |
| Kansas | $167,540 | 8.1% | $62,087 |
| Kentucky | $160,589 | 7.5% | $52,295 |
| Iowa | $158,930 | 3.6% | $61,691 |
| Alabama | $158,809 | 8.9% | $51,734 |
| Arkansas | $142,070 | 6.7% | $48,952 |
| Oklahoma | $141,933 | 7.2% | $54,449 |
| Mississippi | $134,125 | 4.8% | $45,792 |
| West Virginia | $113,626 | 4.7% | $48,850 |