
Cities across the United States have experienced several record-breaking heatwaves. For example, in Las Vegas, the temperature in the city’s airport was 120 degrees Fahrenheit on July 7th. This broke the city’s all-time record of 117, which was first set in 1942 and tied in 2005, 2013, 2017, and 2021. In Texas, tens of millions of people were under a heat advisory even as 1.3 million people in the state didn’t have power. (These are the U.S. cities with the absolute best weather.)
To determine the cities experiencing the worst heat waves right now, 24/7 Wall St. reviewed county-level data on daily average temperature from the NOAA’s ClimGrid-Daily program. County seats were ranked based on the raw differential in average daily temperature from the period July 1-6, 1981-2010 to July 16, 2024. Only county seats with at least 10,000 residents were considered. Data on population is from the U.S. Census Bureau’s 2022 American Community Survey.
It is important to emphasize that our list only considers the deviation from normal temperatures — how much hotter current temperatures are compared to historic normals (rather than how high the temperatures are). Also, the list only considers the week of 1-6 July, and some records have been broken since.
Why This Matters
 Climate change is causing all kinds of extreme weather to worsen, but much of it is related to heat — as heat fuels other types of extreme weather. Scientific analysis found that certain extreme heat waves could not have been possible prior to climate change. While absolute hot temperatures are one thing, the deviation from normal temperatures also poses a problem as some areas are not set up for such hot weather.
These are the cities experiencing the worst heat waves this year:
50. McMinnville, OR (Yamhill County)

- Avg. temperature, July 1-6, 2024: 69.9°F (+7.2°F hotter than normal)
- Avg. temperature, July 1-6, 1981-2010: 62.7°F
- Total population: 34,432
49. Albany, OR (Linn County)
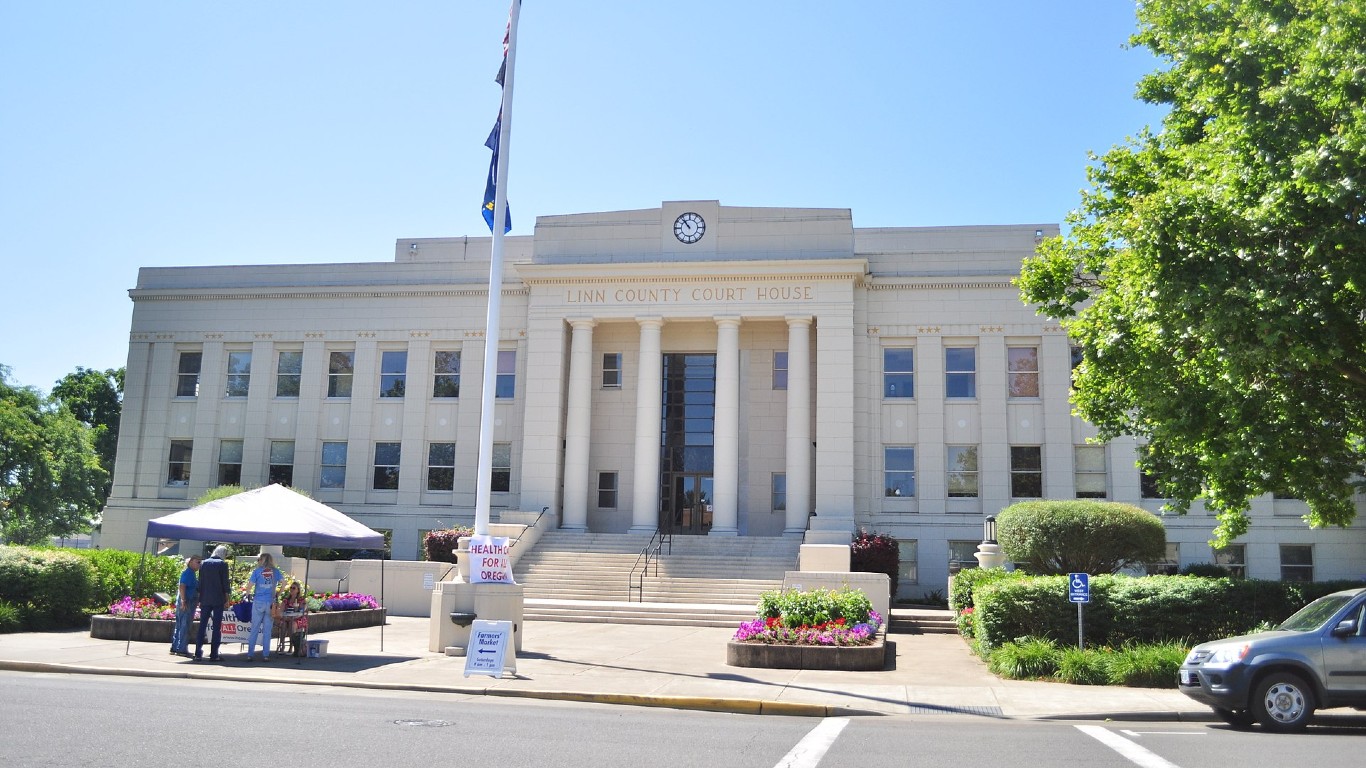
- Avg. temperature, July 1-6, 2024: 68.2°F (+7.3°F hotter than normal)
- Avg. temperature, July 1-6, 1981-2010: 60.9°F
- Total population: 56,348
48. Bakersfield, CA (Kern County)

- Avg. temperature, July 1-6, 2024: 86.5°F (+7.4°F hotter than normal)
- Avg. temperature, July 1-6, 1981-2010: 79.2°F
- Total population: 404,321
47. Corvallis, OR (Benton County)

- Avg. temperature, July 1-6, 2024: 70.8°F (+7.6°F hotter than normal)
- Avg. temperature, July 1-6, 1981-2010: 63.3°F
- Total population: 60,050
46. Dallas, OR (Polk County)
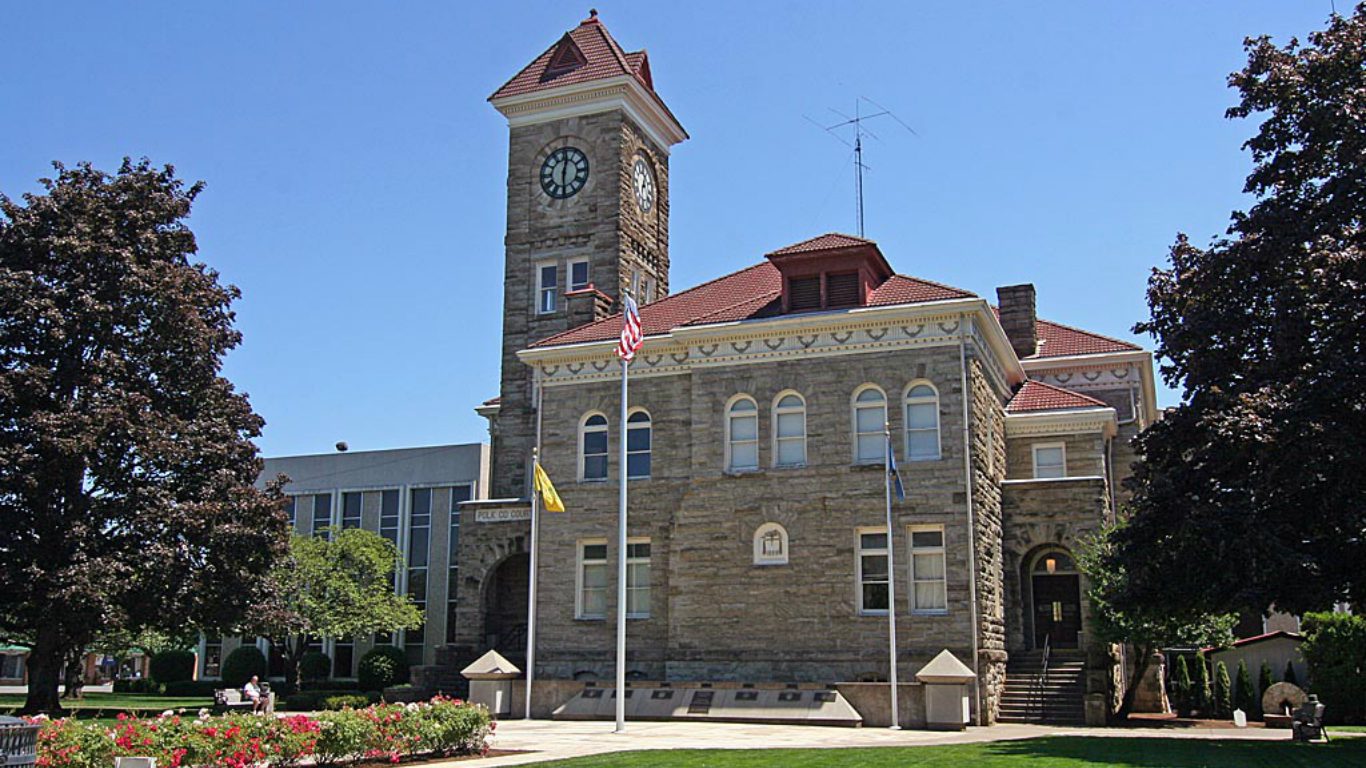
- Avg. temperature, July 1-6, 2024: 70.1°F (+7.6°F hotter than normal)
- Avg. temperature, July 1-6, 1981-2010: 62.6°F
- Total population: 16,945
45. Newport, OR (Lincoln County)

- Avg. temperature, July 1-6, 2024: 67.1°F (+7.6°F hotter than normal)
- Avg. temperature, July 1-6, 1981-2010: 59.5°F
- Total population: 10,319
44. Eugene, OR (Lane County)

- Avg. temperature, July 1-6, 2024: 68.9°F (+7.8°F hotter than normal)
- Avg. temperature, July 1-6, 1981-2010: 61.1°F
- Total population: 176,755
43. Susanville, CA (Lassen County)
- Avg. temperature, July 1-6, 2024: 72.0°F (+7.8°F hotter than normal)
- Avg. temperature, July 1-6, 1981-2010: 64.2°F
- Total population: 15,737
42. Tillamook, OR (Tillamook County)

- Avg. temperature, July 1-6, 2024: 66.0°F (+7.9°F hotter than normal)
- Avg. temperature, July 1-6, 1981-2010: 58.2°F
- Total population: 5,215
41. Hanford, CA (Kings County)

- Avg. temperature, July 1-6, 2024: 88.0°F (+8.1°F hotter than normal)
- Avg. temperature, July 1-6, 1981-2010: 79.9°F
- Total population: 57,920
40. Medford, OR (Jackson County)

- Avg. temperature, July 1-6, 2024: 72.6°F (+8.1°F hotter than normal)
- Avg. temperature, July 1-6, 1981-2010: 64.4°F
- Total population: 85,539
39. Ventura, CA (Ventura County)
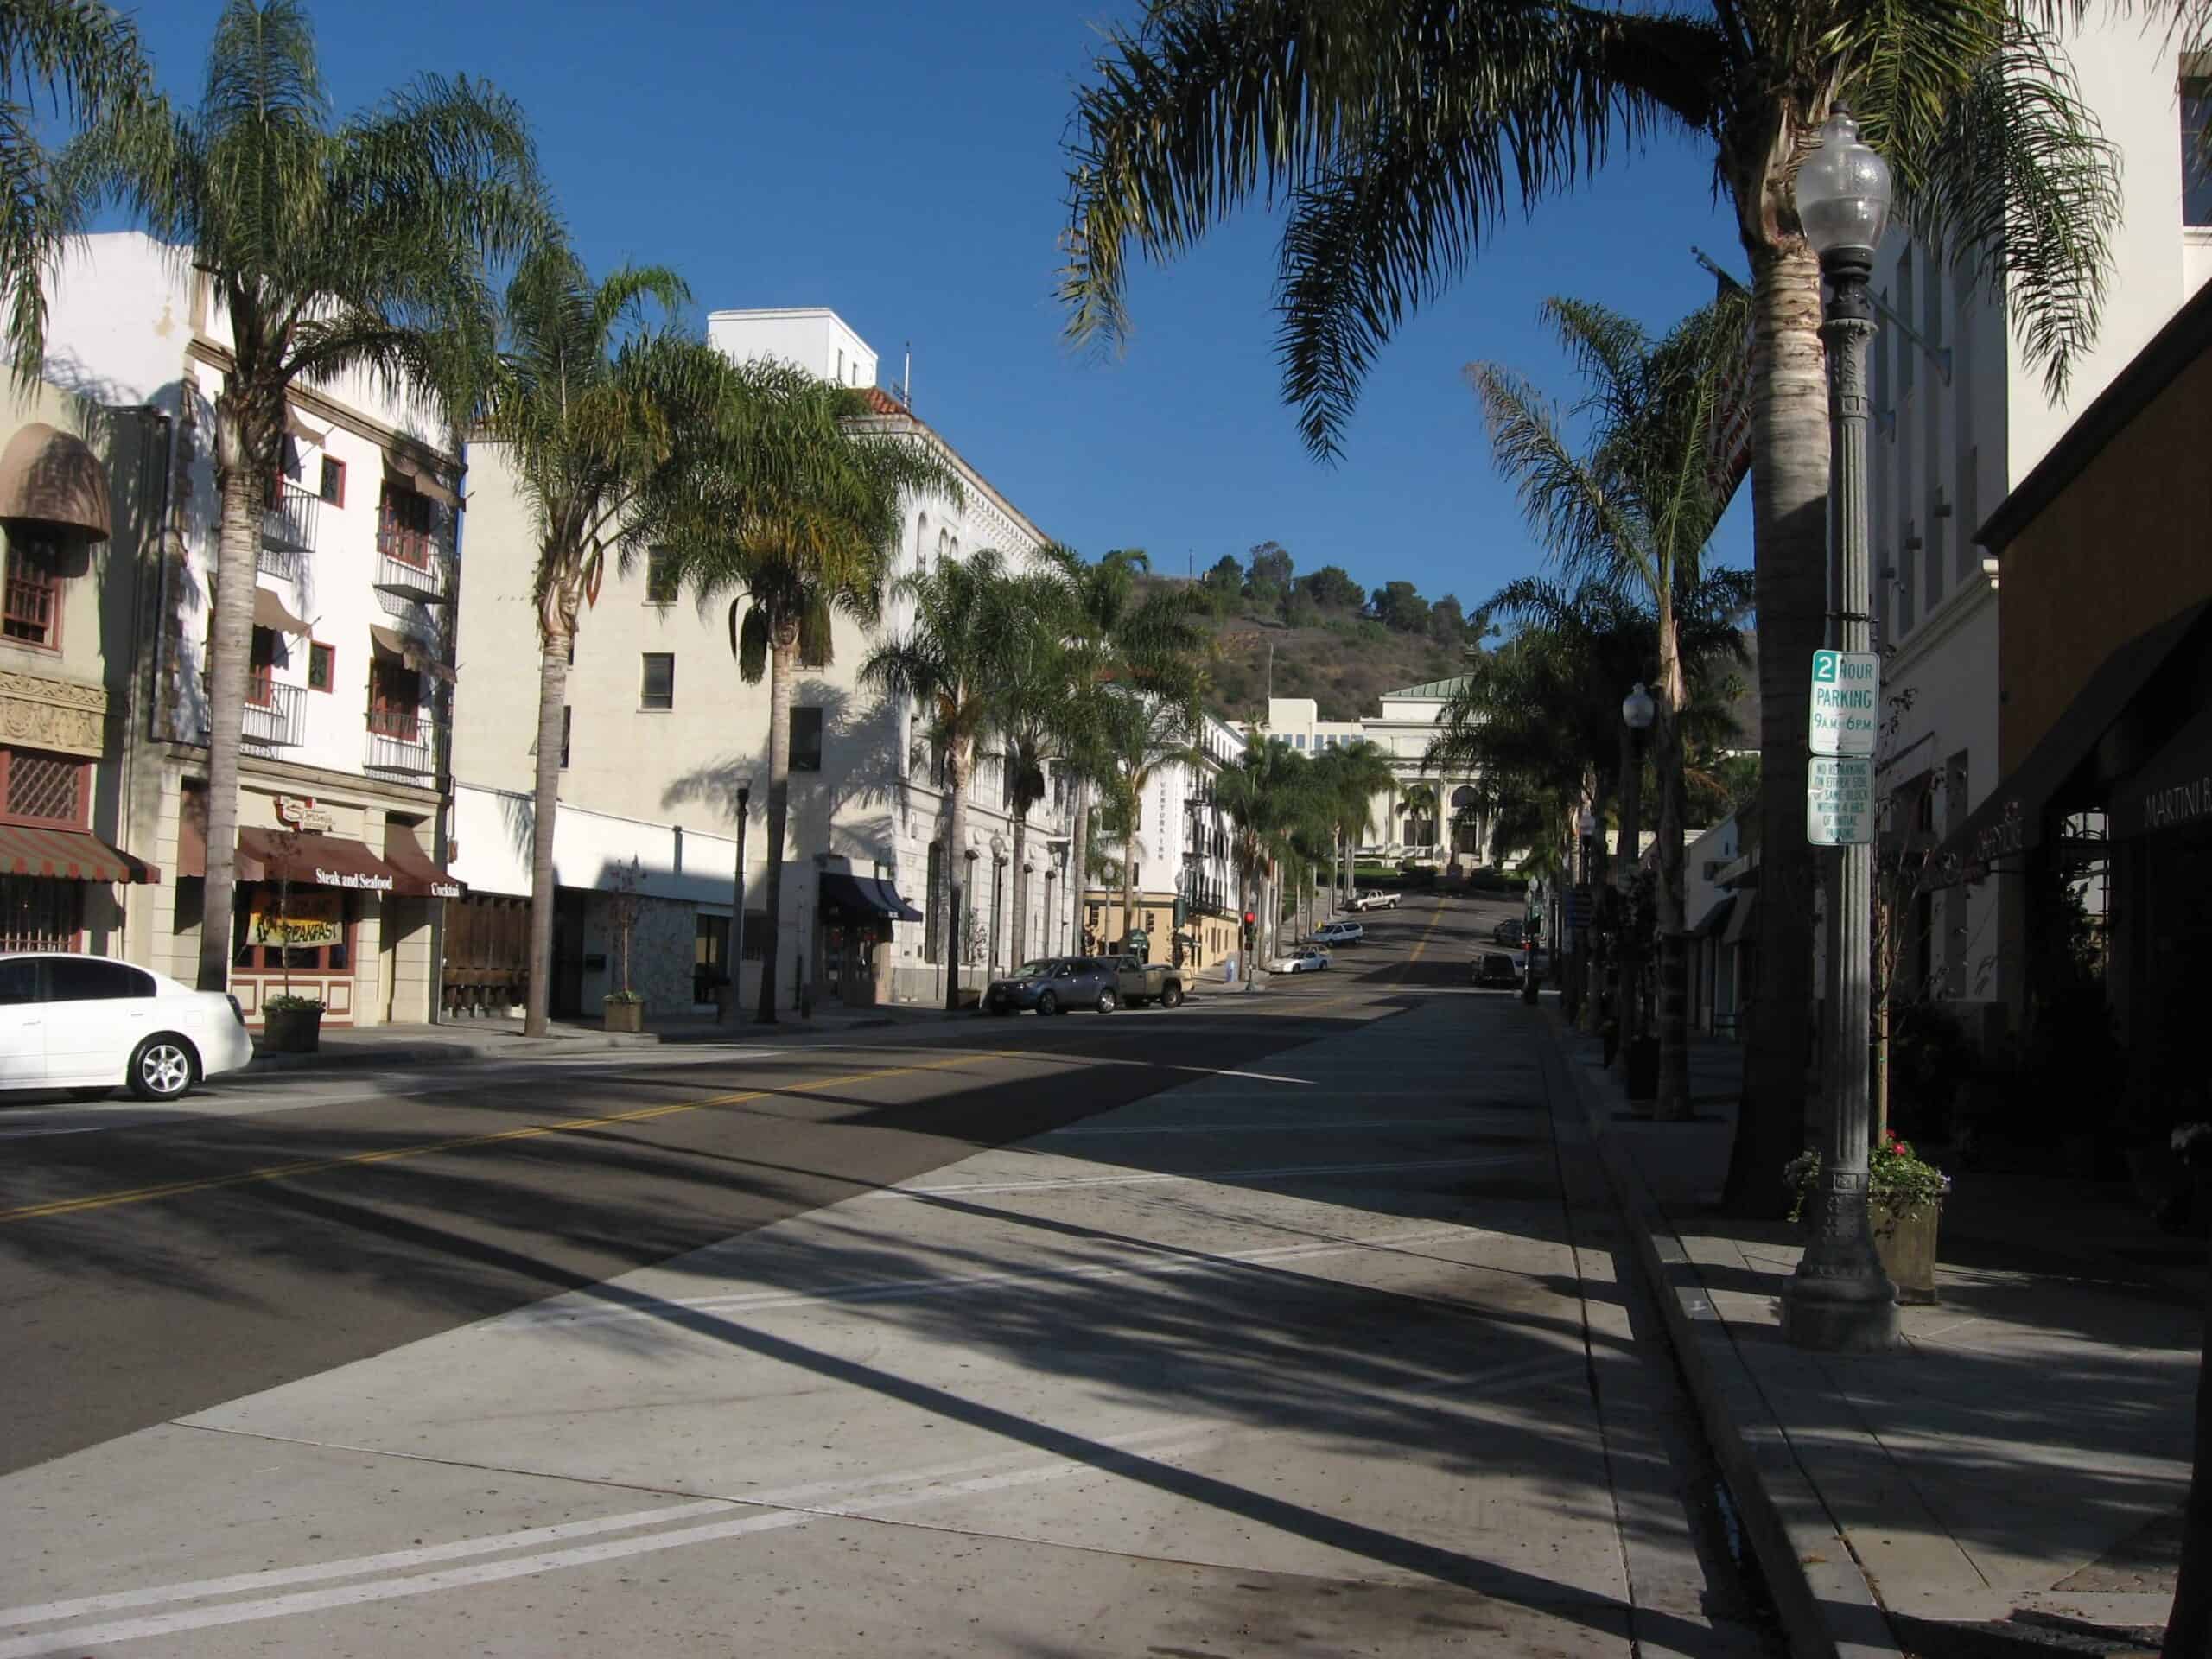
- Avg. temperature, July 1-6, 2024: 77.1°F (+8.2°F hotter than normal)
- Avg. temperature, July 1-6, 1981-2010: 68.9°F
- Total population: 110,358
38. Roseburg, OR (Douglas County)

- Avg. temperature, July 1-6, 2024: 70.9°F (+8.4°F hotter than normal)
- Avg. temperature, July 1-6, 1981-2010: 62.6°F
- Total population: 23,657
37. San Luis Obispo, CA (San Luis Obispo County)
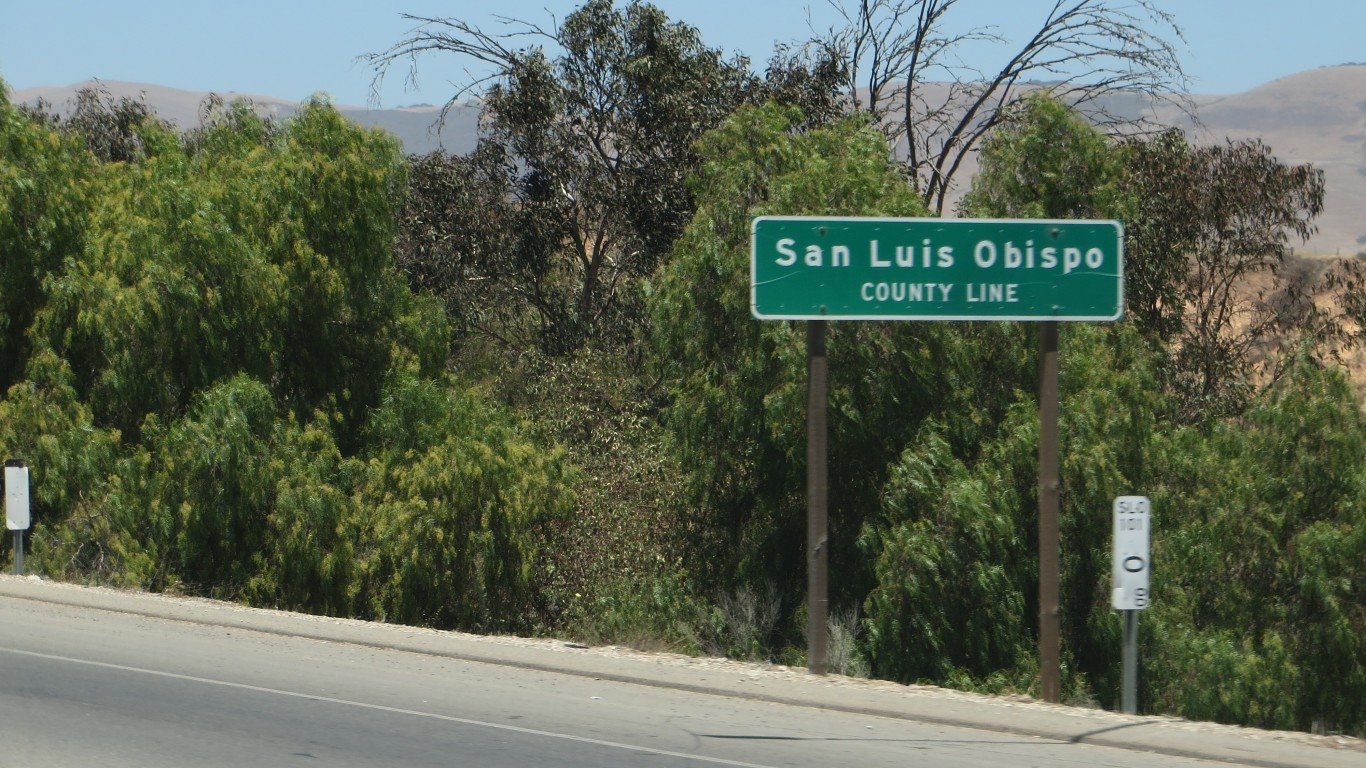
- Avg. temperature, July 1-6, 2024: 79.5°F (+8.6°F hotter than normal)
- Avg. temperature, July 1-6, 1981-2010: 71.0°F
- Total population: 47,529
36. Visalia, CA (Tulare County)

- Avg. temperature, July 1-6, 2024: 79.9°F (+8.7°F hotter than normal)
- Avg. temperature, July 1-6, 1981-2010: 71.2°F
- Total population: 141,466
35. Fresno, CA (Fresno County)

- Avg. temperature, July 1-6, 2024: 80.8°F (+9.0°F hotter than normal)
- Avg. temperature, July 1-6, 1981-2010: 71.7°F
- Total population: 541,528
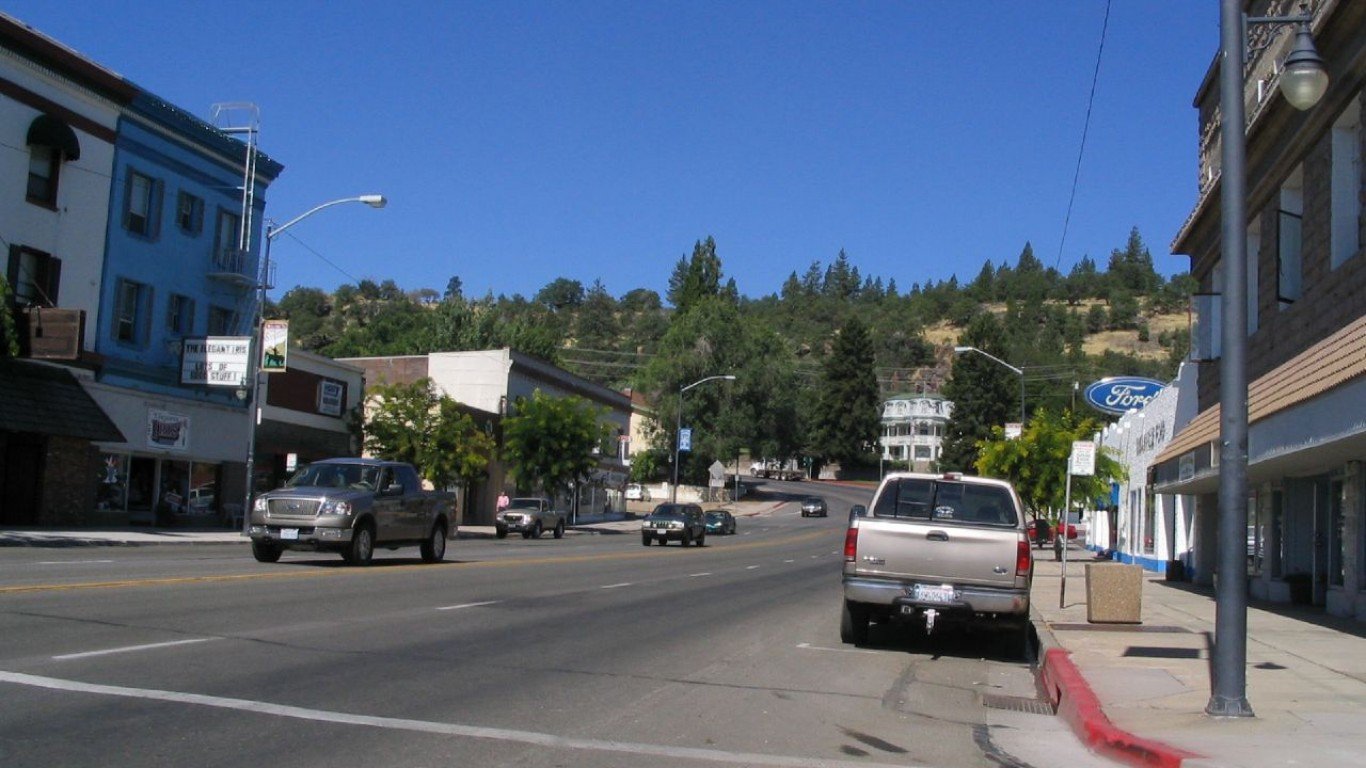
34. Yreka, CA (Siskiyou County)

- Avg. temperature, July 1-6, 2024: 73.1°F (+9.1°F hotter than normal)
- Avg. temperature, July 1-6, 1981-2010: 64.0°F
- Total population: 7,833
33. San Francisco, CA (San Francisco County)

- Avg. temperature, July 1-6, 2024: 71.4°F (+9.4°F hotter than normal)
- Avg. temperature, July 1-6, 1981-2010: 62.0°F
- Total population: 851,036
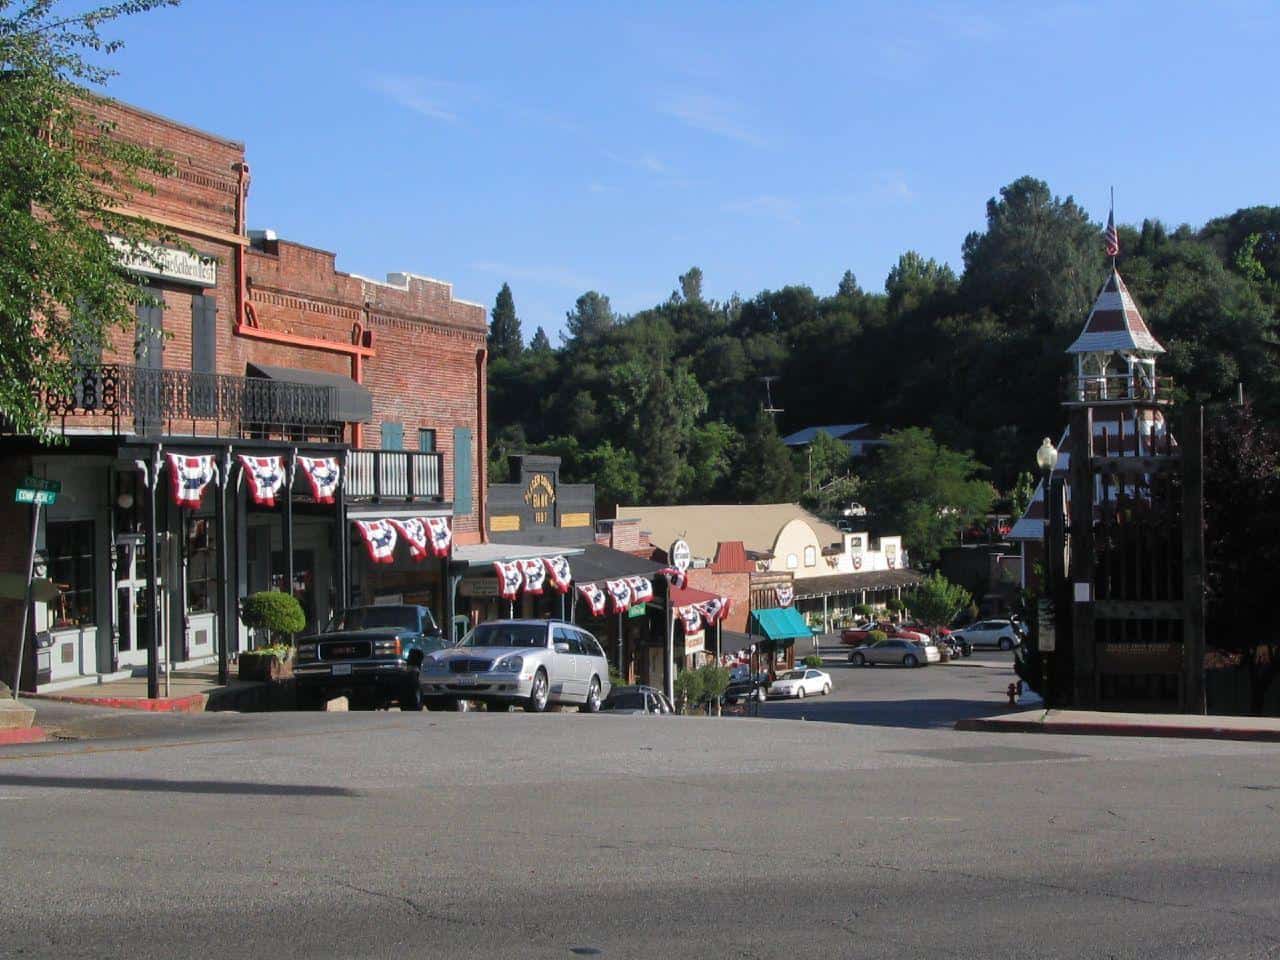
32. Placerville, CA (El Dorado County)

- Avg. temperature, July 1-6, 2024: 78.7°F (+9.6°F hotter than normal)
- Avg. temperature, July 1-6, 1981-2010: 69.1°F
- Total population: 10,744
31. Madera, CA (Madera County)

- Avg. temperature, July 1-6, 2024: 81.9°F (+9.6°F hotter than normal)
- Avg. temperature, July 1-6, 1981-2010: 72.3°F
- Total population: 66,784
30. Merced, CA (Merced County)

- Avg. temperature, July 1-6, 2024: 87.1°F (+10.0°F hotter than normal)
- Avg. temperature, July 1-6, 1981-2010: 77.1°F
- Total population: 87,686
29. Auburn, CA (Placer County)
- Avg. temperature, July 1-6, 2024: 78.9°F (+10.0°F hotter than normal)
- Avg. temperature, July 1-6, 1981-2010: 68.8°F
- Total population: 13,773
28. Yuba City, CA (Sutter County)

- Avg. temperature, July 1-6, 2024: 88.5°F (+10.4°F hotter than normal)
- Avg. temperature, July 1-6, 1981-2010: 78.1°F
- Total population: 69,535
27. Redding, CA (Shasta County)

- Avg. temperature, July 1-6, 2024: 81.9°F (+10.6°F hotter than normal)
- Avg. temperature, July 1-6, 1981-2010: 71.3°F
- Total population: 93,327
26. Santa Cruz, CA (Santa Cruz County)

- Avg. temperature, July 1-6, 2024: 74.8°F (+10.6°F hotter than normal)
- Avg. temperature, July 1-6, 1981-2010: 64.2°F
- Total population: 61,367
25. Grants Pass, OR (Josephine County)

- Avg. temperature, July 1-6, 2024: 74.3°F (+10.6°F hotter than normal)
- Avg. temperature, July 1-6, 1981-2010: 63.6°F
- Total population: 39,131
24. Marysville, CA (Yuba County)
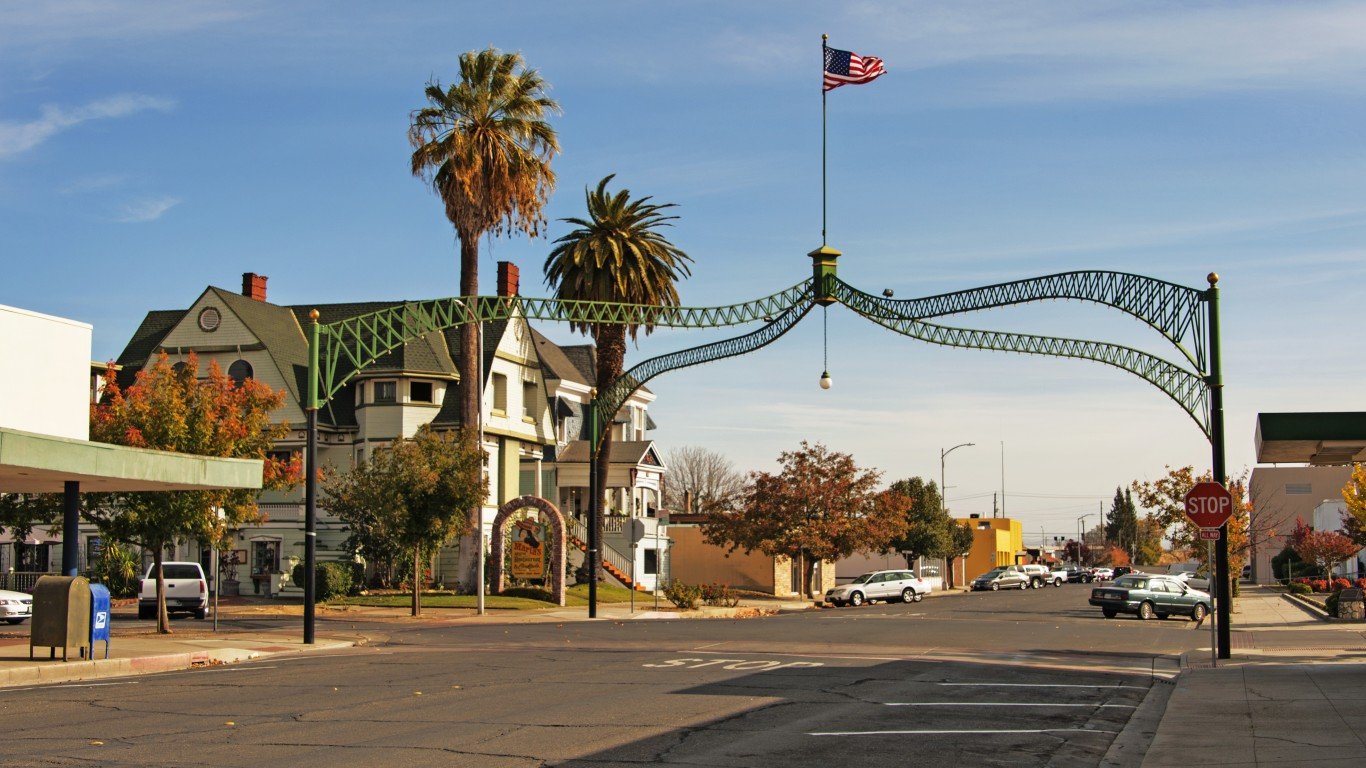
- Avg. temperature, July 1-6, 2024: 87.0°F (+10.8°F hotter than normal)
- Avg. temperature, July 1-6, 1981-2010: 76.1°F
- Total population: 12,681
23. Jackson, CA (Amador County)

- Avg. temperature, July 1-6, 2024: 83.7°F (+10.8°F hotter than normal)
- Avg. temperature, July 1-6, 1981-2010: 72.8°F
- Total population: 5,004
22. Redwood City, CA (San Mateo County)

- Avg. temperature, July 1-6, 2024: 73.9°F (+10.9°F hotter than normal)
- Avg. temperature, July 1-6, 1981-2010: 63.0°F
- Total population: 83,077
21. Red Bluff, CA (Tehama County)

- Avg. temperature, July 1-6, 2024: 85.7°F (+10.9°F hotter than normal)
- Avg. temperature, July 1-6, 1981-2010: 74.8°F
- Total population: 14,576
20. Colusa, CA (Colusa County)

- Avg. temperature, July 1-6, 2024: 87.7°F (+10.9°F hotter than normal)
- Avg. temperature, July 1-6, 1981-2010: 76.8°F
- Total population: 6,380
19. Oakland, CA (Alameda County)

- Avg. temperature, July 1-6, 2024: 80.8°F (+11.0°F hotter than normal)
- Avg. temperature, July 1-6, 1981-2010: 69.8°F
- Total population: 437,825
18. Woodland, CA (Yolo County)

- Avg. temperature, July 1-6, 2024: 87.5°F (+11.1°F hotter than normal)
- Avg. temperature, July 1-6, 1981-2010: 76.5°F
- Total population: 61,227
17. Modesto, CA (Stanislaus County)

- Avg. temperature, July 1-6, 2024: 87.1°F (+11.1°F hotter than normal)
- Avg. temperature, July 1-6, 1981-2010: 76.0°F
- Total population: 218,308
16. Salinas, CA (Monterey County)

- Avg. temperature, July 1-6, 2024: 80.0°F (+11.1°F hotter than normal)
- Avg. temperature, July 1-6, 1981-2010: 68.9°F
- Total population: 162,783
15. Willows, CA (Glenn County)
- Avg. temperature, July 1-6, 2024: 87.1°F (+11.3°F hotter than normal)
- Avg. temperature, July 1-6, 1981-2010: 75.8°F
- Total population: 6,201
14. Crescent City, CA (Del Norte County)
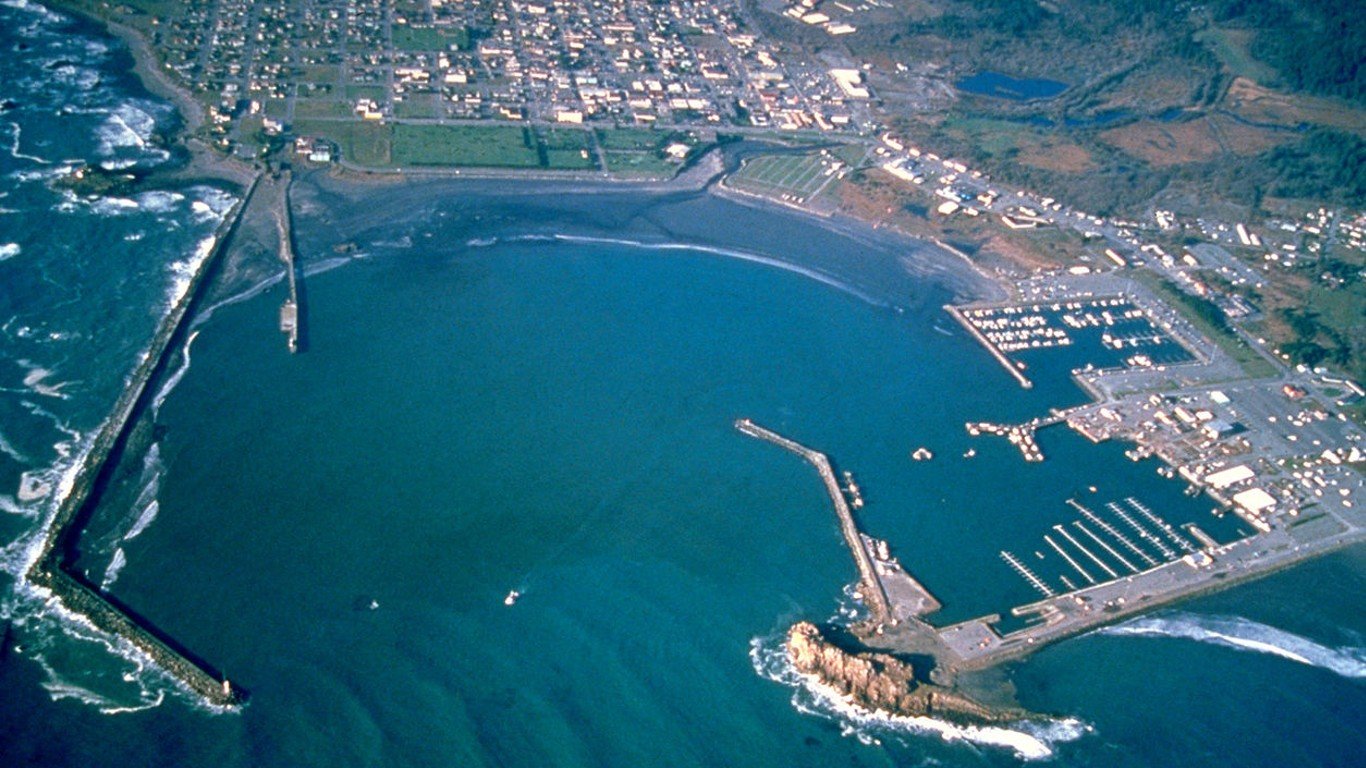
- Avg. temperature, July 1-6, 2024: 74.4°F (+11.4°F hotter than normal)
- Avg. temperature, July 1-6, 1981-2010: 63.0°F
- Total population: 6,379
13. Hollister, CA (San Benito County)

- Avg. temperature, July 1-6, 2024: 83.7°F (+11.5°F hotter than normal)
- Avg. temperature, July 1-6, 1981-2010: 72.3°F
- Total population: 42,093
12. Eureka, CA (Humboldt County)
- Avg. temperature, July 1-6, 2024: 75.8°F (+11.5°F hotter than normal)
- Avg. temperature, July 1-6, 1981-2010: 64.3°F
- Total population: 26,519
11. Stockton, CA (San Joaquin County)

- Avg. temperature, July 1-6, 2024: 87.3°F (+11.6°F hotter than normal)
- Avg. temperature, July 1-6, 1981-2010: 75.7°F
- Total population: 320,030
10. Oroville, CA (Butte County)

- Avg. temperature, July 1-6, 2024: 86.9°F (+11.7°F hotter than normal)
- Avg. temperature, July 1-6, 1981-2010: 75.3°F
- Total population: 20,283
9. Fairfield, CA (Solano County)

- Avg. temperature, July 1-6, 2024: 85.0°F (+11.7°F hotter than normal)
- Avg. temperature, July 1-6, 1981-2010: 73.2°F
- Total population: 119,420
8. Sacramento, CA (Sacramento County)

- Avg. temperature, July 1-6, 2024: 87.7°F (+11.7°F hotter than normal)
- Avg. temperature, July 1-6, 1981-2010: 76.0°F
- Total population: 523,600
7. San Jose, CA (Santa Clara County)

- Avg. temperature, July 1-6, 2024: 81.5°F (+11.9°F hotter than normal)
- Avg. temperature, July 1-6, 1981-2010: 69.5°F
- Total population: 1,001,176
6. Martinez, CA (Contra Costa County)

- Avg. temperature, July 1-6, 2024: 83.6°F (+12.3°F hotter than normal)
- Avg. temperature, July 1-6, 1981-2010: 71.4°F
- Total population: 37,093
5. Ukiah, CA (Mendocino County)

- Avg. temperature, July 1-6, 2024: 78.9°F (+12.4°F hotter than normal)
- Avg. temperature, July 1-6, 1981-2010: 66.5°F
- Total population: 16,496
4. Lakeport, CA (Lake County)

- Avg. temperature, July 1-6, 2024: 84.2°F (+12.5°F hotter than normal)
- Avg. temperature, July 1-6, 1981-2010: 71.8°F
- Total population: 5,014
3. San Rafael, CA (Marin County)

- Avg. temperature, July 1-6, 2024: 74.6°F (+13.0°F hotter than normal)
- Avg. temperature, July 1-6, 1981-2010: 61.6°F
- Total population: 60,891
2. Napa, CA (Napa County)

- Avg. temperature, July 1-6, 2024: 85.4°F (+13.4°F hotter than normal)
- Avg. temperature, July 1-6, 1981-2010: 72.0°F
- Total population: 79,233
1. Santa Rosa, CA (Sonoma County)

- Avg. temperature, July 1-6, 2024: 80.0°F (+14.1°F hotter than normal)
- Avg. temperature, July 1-6, 1981-2010: 66.0°F
- Total population: 178,221
Contact [email protected] for any questions or corrections.