Around the world and in the United States, climate change is shaping migration patterns. Disasters like hurricanes, wildfires, and floods have already displaced millions of people worldwide, forcing communities to abandon homes and livelihoods, many never to return again. But while people are migrating away from places where climate risk is palpable — coastal homes sinking to sea level, constant storm surge inundating roads and infrastructure for weeks — they are moving en masse to places with high heat risk.
Over the last decade, Americans have overwhelmingly moved south and southwest to the Sun Belt, pulled by low cost of living, new housing construction, and warm year-round weather. The Villages metro area in Florida grew 22.0% due to net migration from 2020 to 2023, the most of any metropolitan statistical area. And while Americans may heed warnings of flood risk by moving away from cities like Miami and New Orleans, in an average year extreme heat kills more Americans than hurricanes, floods and tornadoes combined. According to data from the NOAA Storm Events Database, there were 874 direct deaths from excessive heat from 2019 to 2023, compared to 330 from tornadoes, 326 from flash floods, and 98 from hurricanes. According to one estimate by local public health officials, there were 378 heat-caused deaths in Maricopa County in 2022 alone.
New population projections from NASA’s Socioeconomic Data and Applications Center show that the fastest-warming counties will continue outpace overall population growth over the next 75 years, increasing the risk of heat-related mortality throughout the country. A closer look at the data reveals the fast-warming counties that will gain the most residents through 2100.
To identify the fast-warming counties that will have the largest population increases over the next 75 years, 24/7 Wall St. analyzed data from the NOAA and NASA’s SEDAC U.S. County-Level Population Projections. Counties ranking in the top two quintiles of warming — where the average temperature in summer 2024 was at least 2.0°F greater than historical normals for the period 1901-2000 — were ranked based on projected population growth from 2025 to 2100. Population projections are based on SSP2 in the Shared Socioeconomic Pathways system, a “middle-of-the-road” scenario in which historical demographic trends largely continue. Data on populatoin is from the U.S. Census Bureau’s 2023 American Community Survey.
40. Contra Costa County, CA

- Projected population, 2100: 1,901,231 residents (+613,511 increase from 2025)
- Current population, 2025: 1,287,720 residents
- Average summer temperature, 2024: 74.5°F (+5.2 from normal)
- Normal summer temperature, 1901-2000: 69.3°F
- Largest cities: Concord, Richmond, Antioch, San Ramon, Pittsburg, Walnut Creek, Brentwood
39. Bronx County, NY

- Projected population, 2100: 2,244,136 residents (+636,783 increase from 2025)
- Current population, 2025: 1,607,353 residents
- Average summer temperature, 2024: 76.5°F (+3.8 from normal)
- Normal summer temperature, 1901-2000: 72.7°F
- Largest cities: New York
38. Middlesex County, MA

- Projected population, 2100: 2,383,776 residents (+643,507 increase from 2025)
- Current population, 2025: 1,740,269 residents
- Average summer temperature, 2024: 72.0°F (+3.7 from normal)
- Normal summer temperature, 1901-2000: 68.3°F
- Largest cities: Cambridge, Lowell, Newton, Somerville, Framingham, Malden, Waltham
37. Multnomah County, OR

- Projected population, 2100: 1,576,181 residents (+645,356 increase from 2025)
- Current population, 2025: 930,825 residents
- Average summer temperature, 2024: 66.2°F (+3.2 from normal)
- Normal summer temperature, 1901-2000: 63.0°F
- Largest cities: Portland, Gresham, Troutdale, Fairview, Wood Village, Maywood Park
36. Arapahoe County, CO

- Projected population, 2100: 1,412,796 residents (+655,389 increase from 2025)
- Current population, 2025: 757,407 residents
- Average summer temperature, 2024: 72.5°F (+3.6 from normal)
- Normal summer temperature, 1901-2000: 68.9°F
- Largest cities: Aurora, Centennial, Littleton, Englewood, Greenwood Village, Cherry Creek, Cherry Hills Village
35. Santa Clara County, CA

- Projected population, 2100: 2,931,429 residents (+752,355 increase from 2025)
- Current population, 2025: 2,179,074 residents
- Average summer temperature, 2024: 71.9°F (+4.7 from normal)
- Normal summer temperature, 1901-2000: 67.2°F
- Largest cities: San Jose, Sunnyvale, Santa Clara, Mountain View, Milpitas, Palo Alto, Cupertino
34. Loudoun County, VA

- Projected population, 2100: 1,265,472 residents (+761,882 increase from 2025)
- Current population, 2025: 503,590 residents
- Average summer temperature, 2024: 76.5°F (+3.8 from normal)
- Normal summer temperature, 1901-2000: 72.8°F
- Largest cities: Leesburg, Ashburn, South Riding, Sterling, Brambleton, Stone Ridge, Broadlands
33. Hays County, TX

- Projected population, 2100: 1,063,658 residents (+776,710 increase from 2025)
- Current population, 2025: 286,948 residents
- Average summer temperature, 2024: 84.4°F (+2.0 from normal)
- Normal summer temperature, 1901-2000: 82.4°F
- Largest cities: San Marcos, Kyle, Buda, Dripping Springs, Wimberley, Woodcreek, Uhland
32. Osceola County, FL
- Projected population, 2100: 1,269,660 residents (+822,036 increase from 2025)
- Current population, 2025: 447,624 residents
- Average summer temperature, 2024: 83.8°F (+3.0 from normal)
- Normal summer temperature, 1901-2000: 80.8°F
- Largest cities: Kissimmee, St. Cloud, Four Corners, Buenaventura Lakes, Celebration, Campbell, Yeehaw Junction
31. Suffolk County, MA
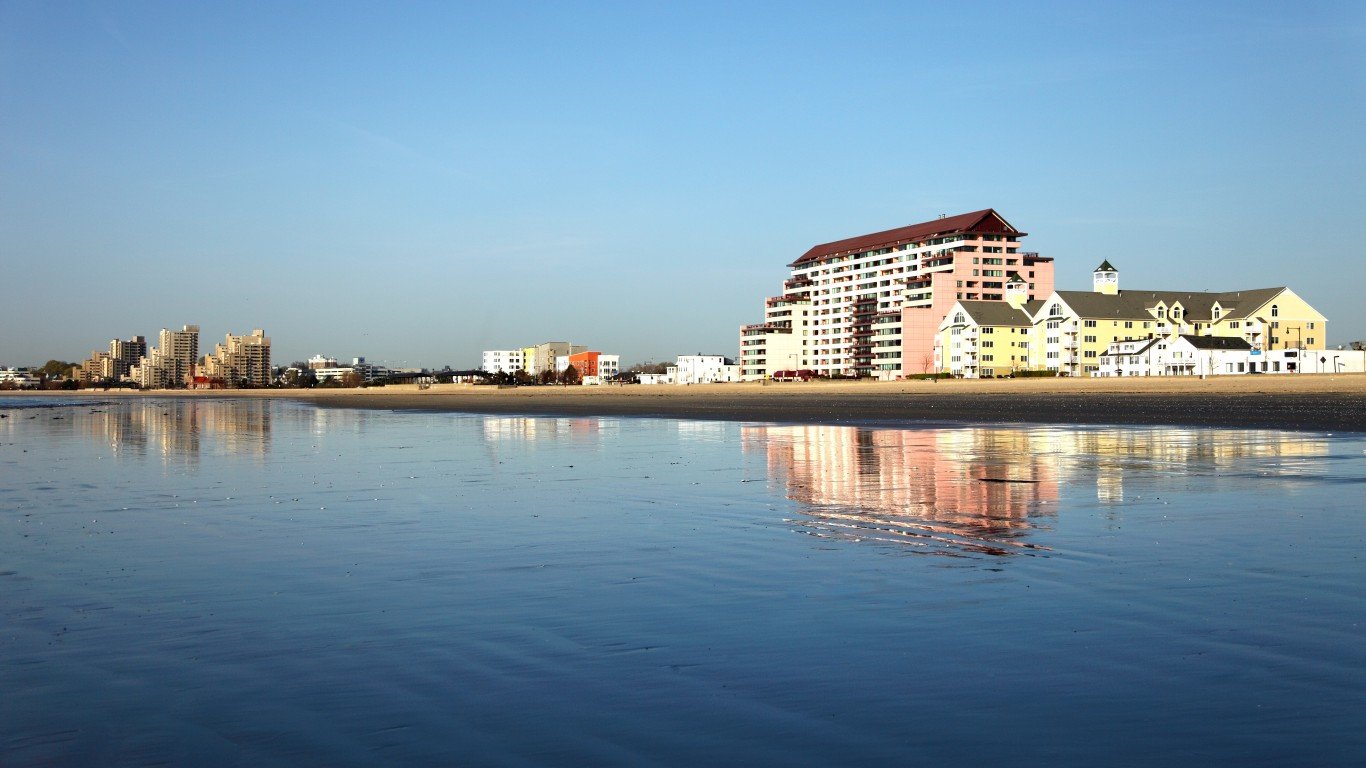
- Projected population, 2100: 1,748,505 residents (+833,042 increase from 2025)
- Current population, 2025: 915,464 residents
- Average summer temperature, 2024: 72.7°F (+4.2 from normal)
- Normal summer temperature, 1901-2000: 68.5°F
- Largest cities: Boston, Revere, Chelsea, Winthrop Town
30. Orleans Parish, LA

- Projected population, 2100: 1,355,609 residents (+842,584 increase from 2025)
- Current population, 2025: 513,025 residents
- Average summer temperature, 2024: 84.4°F (+3.2 from normal)
- Normal summer temperature, 1901-2000: 81.3°F
- Largest cities: New Orleans
29. Lee County, FL
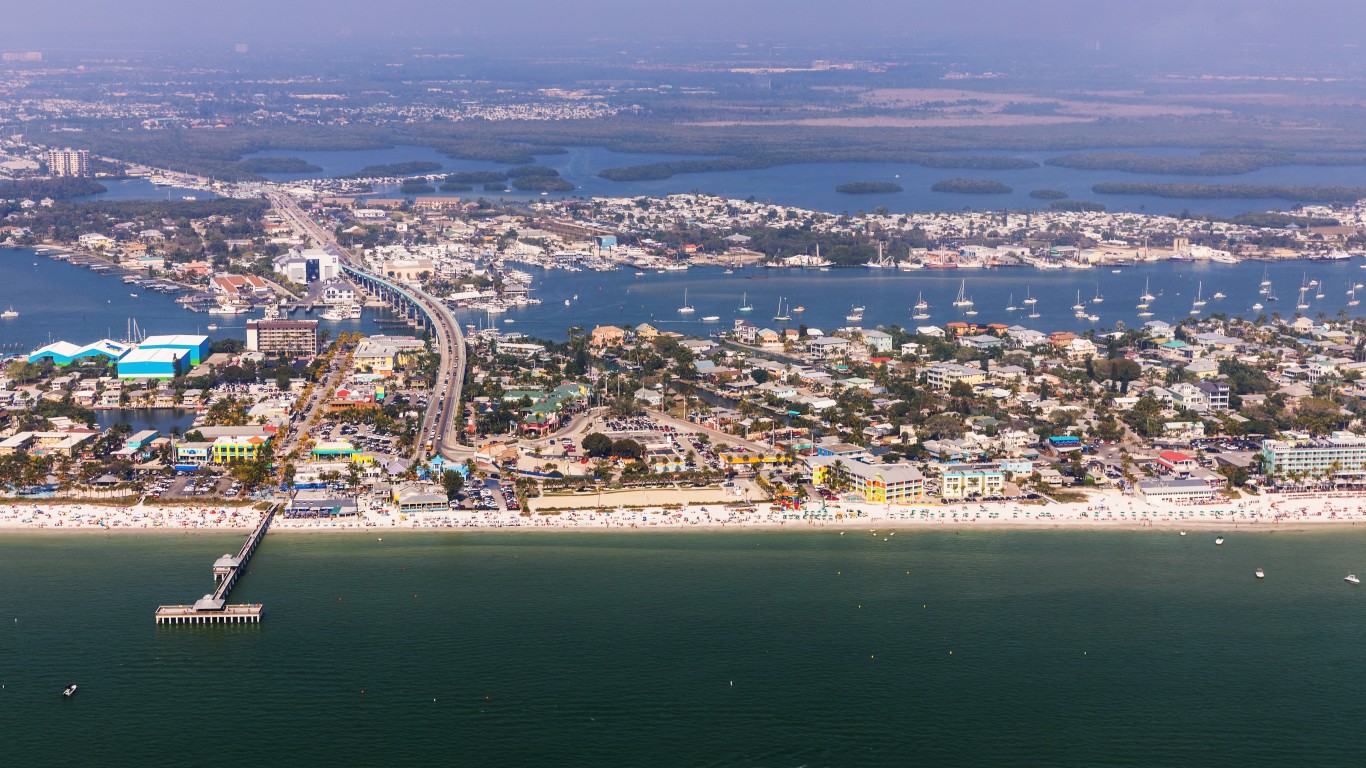
- Projected population, 2100: 1,726,848 residents (+854,902 increase from 2025)
- Current population, 2025: 871,946 residents
- Average summer temperature, 2024: 83.8°F (+2.3 from normal)
- Normal summer temperature, 1901-2000: 81.5°F
- Largest cities: Cape Coral, Lehigh Acres, Fort Myers, Bonita Springs, North Fort Myers, Estero, San Carlos Park
28. Montgomery County, MD

- Projected population, 2100: 2,035,619 residents (+862,388 increase from 2025)
- Current population, 2025: 1,173,231 residents
- Average summer temperature, 2024: 76.4°F (+3.7 from normal)
- Normal summer temperature, 1901-2000: 72.8°F
- Largest cities: Germantown, Silver Spring, Gaithersburg, Rockville, Bethesda, Aspen Hill, Wheaton
27. New York County, NY

- Projected population, 2100: 2,702,933 residents (+877,208 increase from 2025)
- Current population, 2025: 1,825,725 residents
- Average summer temperature, 2024: 76.8°F (+3.8 from normal)
- Normal summer temperature, 1901-2000: 73.0°F
- Largest cities: New York
26. Utah County, UT

- Projected population, 2100: 1,609,388 residents (+915,968 increase from 2025)
- Current population, 2025: 693,420 residents
- Average summer temperature, 2024: 70.3°F (+4.3 from normal)
- Normal summer temperature, 1901-2000: 66.0°F
- Largest cities: Provo, Orem, Lehi, Eagle Mountain, Spanish Fork, Saratoga Springs, Pleasant Grove
25. San Francisco County, CA

- Projected population, 2100: 1,966,767 residents (+935,831 increase from 2025)
- Current population, 2025: 1,030,936 residents
- Average summer temperature, 2024: 63.0°F (+2.5 from normal)
- Normal summer temperature, 1901-2000: 60.5°F
- Largest cities: San Francisco
24. Fulton County, GA

- Projected population, 2100: 2,222,402 residents (+1,018,694 increase from 2025)
- Current population, 2025: 1,203,707 residents
- Average summer temperature, 2024: 79.5°F (+2.3 from normal)
- Normal summer temperature, 1901-2000: 77.2°F
- Largest cities: Atlanta, South Fulton, Sandy Springs, Roswell, Johns Creek, Alpharetta, Milton
23. District of Columbia, DC

- Projected population, 2100: 1,847,141 residents (+1,025,215 increase from 2025)
- Current population, 2025: 821,926 residents
- Average summer temperature, 2024: 78.2°F (+3.9 from normal)
- Normal summer temperature, 1901-2000: 74.3°F
- Largest cities: Washington
22. Palm Beach County, FL

- Projected population, 2100: 2,706,979 residents (+1,069,492 increase from 2025)
- Current population, 2025: 1,637,487 residents
- Average summer temperature, 2024: 83.5°F (+2.8 from normal)
- Normal summer temperature, 1901-2000: 80.7°F
- Largest cities: West Palm Beach, Boca Raton, Boynton Beach, Delray Beach, Wellington, Jupiter, Palm Beach Gardens
21. Riverside County, CA

- Projected population, 2100: 3,766,594 residents (+1,102,119 increase from 2025)
- Current population, 2025: 2,664,475 residents
- Average summer temperature, 2024: 88.4°F (+5.6 from normal)
- Normal summer temperature, 1901-2000: 82.8°F
- Largest cities: Riverside, Moreno Valley, Corona, Murrieta, Temecula, Jurupa Valley, Menifee
20. San Diego County, CA

- Projected population, 2100: 4,832,502 residents (+1,154,317 increase from 2025)
- Current population, 2025: 3,678,185 residents
- Average summer temperature, 2024: 77.0°F (+4.1 from normal)
- Normal summer temperature, 1901-2000: 72.8°F
- Largest cities: San Diego, Chula Vista, Oceanside, Escondido, Carlsbad, El Cajon, Vista
19. Franklin County, OH

- Projected population, 2100: 2,636,796 residents (+1,180,656 increase from 2025)
- Current population, 2025: 1,456,139 residents
- Average summer temperature, 2024: 74.5°F (+2.0 from normal)
- Normal summer temperature, 1901-2000: 72.4°F
- Largest cities: Columbus, Dublin, Grove City, Reynoldsburg, Westerville, Upper Arlington, Hilliard
18. Denver County, CO

- Projected population, 2100: 2,103,725 residents (+1,220,232 increase from 2025)
- Current population, 2025: 883,493 residents
- Average summer temperature, 2024: 73.8°F (+3.9 from normal)
- Normal summer temperature, 1901-2000: 69.9°F
- Largest cities: Denver
17. Williamson County, TX

- Projected population, 2100: 1,924,153 residents (+1,225,126 increase from 2025)
- Current population, 2025: 699,027 residents
- Average summer temperature, 2024: 84.5°F (+2.0 from normal)
- Normal summer temperature, 1901-2000: 82.5°F
- Largest cities: Round Rock, Cedar Park, Georgetown, Leander, Hutto, Brushy Creek, Taylor
16. Salt Lake County, UT

- Projected population, 2100: 2,551,390 residents (+1,245,530 increase from 2025)
- Current population, 2025: 1,305,860 residents
- Average summer temperature, 2024: 73.2°F (+4.9 from normal)
- Normal summer temperature, 1901-2000: 68.3°F
- Largest cities: Salt Lake City, West Valley City, West Jordan, Sandy, South Jordan, Millcreek, Taylorsville
15. Hillsborough County, FL

- Projected population, 2100: 2,891,558 residents (+1,284,536 increase from 2025)
- Current population, 2025: 1,607,022 residents
- Average summer temperature, 2024: 84.1°F (+3.5 from normal)
- Normal summer temperature, 1901-2000: 80.6°F
- Largest cities: Tampa, Brandon, Riverview, Town ‘n’ Country, University, Plant City, Valrico
14. Alameda County, CA

- Projected population, 2100: 3,234,133 residents (+1,305,249 increase from 2025)
- Current population, 2025: 1,928,884 residents
- Average summer temperature, 2024: 72.4°F (+4.7 from normal)
- Normal summer temperature, 1901-2000: 67.7°F
- Largest cities: Oakland, Fremont, Hayward, Berkeley, San Leandro, Livermore, Pleasanton
13. Gwinnett County, GA

- Projected population, 2100: 2,443,321 residents (+1,337,293 increase from 2025)
- Current population, 2025: 1,106,028 residents
- Average summer temperature, 2024: 79.0°F (+2.1 from normal)
- Normal summer temperature, 1901-2000: 77.0°F
- Largest cities: Peachtree Corners, Duluth, Lawrenceville, Sugar Hill, Suwanee, Snellville, Norcross
12. Wake County, NC

- Projected population, 2100: 2,893,335 residents (+1,600,183 increase from 2025)
- Current population, 2025: 1,293,152 residents
- Average summer temperature, 2024: 78.8°F (+2.3 from normal)
- Normal summer temperature, 1901-2000: 76.5°F
- Largest cities: Raleigh, Cary, Apex, Wake Forest, Holly Springs, Fuquay-Varina, Garner
11. Denton County, TX

- Projected population, 2100: 2,779,183 residents (+1,726,172 increase from 2025)
- Current population, 2025: 1,053,010 residents
- Average summer temperature, 2024: 85.2°F (+2.1 from normal)
- Normal summer temperature, 1901-2000: 83.0°F
- Largest cities: Denton, Lewisville, Flower Mound, Little Elm, The Colony, Corinth, Highland Village
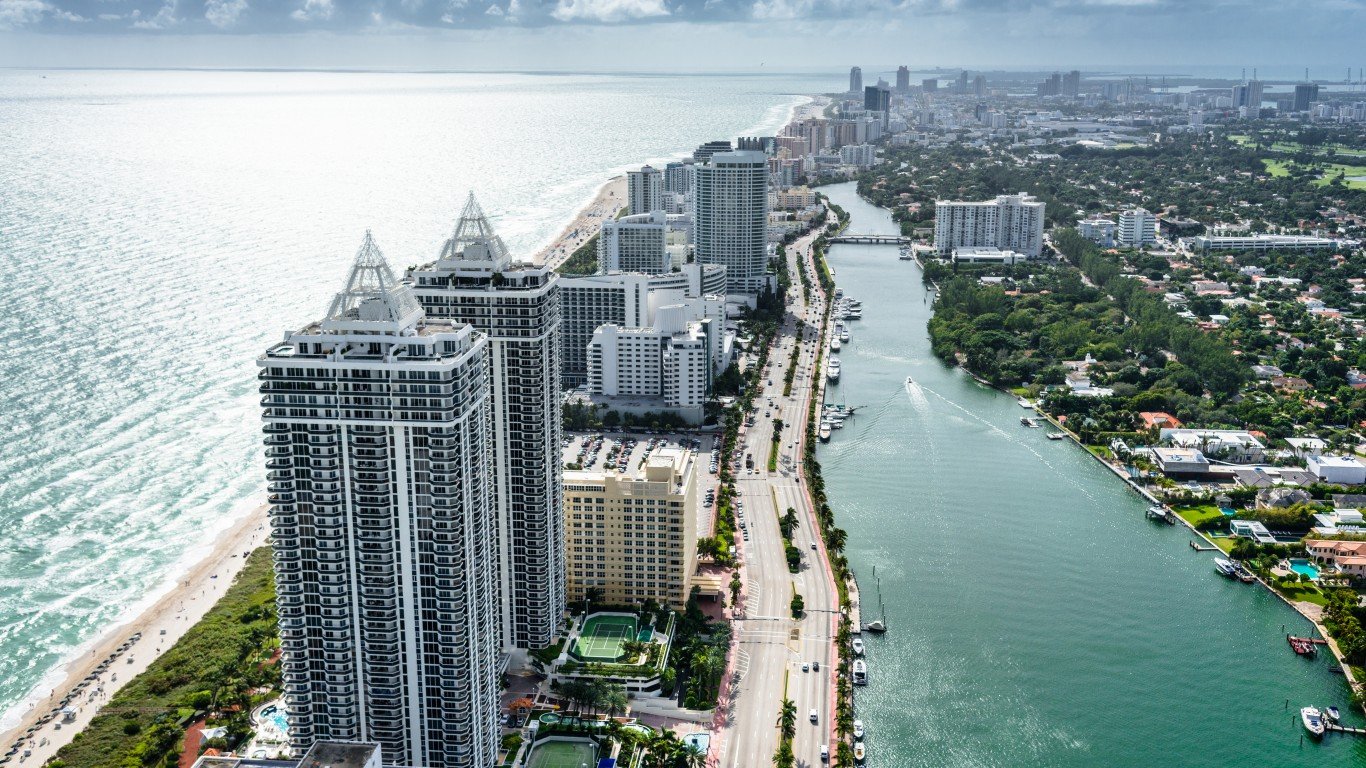
10. Miami-Dade County, FL

- Projected population, 2100: 4,866,598 residents (+1,740,160 increase from 2025)
- Current population, 2025: 3,126,439 residents
- Average summer temperature, 2024: 84.3°F (+3.2 from normal)
- Normal summer temperature, 1901-2000: 81.2°F
- Largest cities: Miami, Hialeah, Miami Gardens, Miami Beach, Homestead, Kendall, Doral
9. Collin County, TX

- Projected population, 2100: 2,952,048 residents (+1,741,974 increase from 2025)
- Current population, 2025: 1,210,074 residents
- Average summer temperature, 2024: 84.7°F (+2.7 from normal)
- Normal summer temperature, 1901-2000: 82.1°F
- Largest cities: Plano, Frisco, McKinney, Allen, Wylie, Prosper, Celina
8. Broward County, FL
- Projected population, 2100: 3,970,984 residents (+1,763,952 increase from 2025)
- Current population, 2025: 2,207,033 residents
- Average summer temperature, 2024: 84.0°F (+2.9 from normal)
- Normal summer temperature, 1901-2000: 81.1°F
- Largest cities: Fort Lauderdale, Pembroke Pines, Hollywood, Miramar, Coral Springs, Pompano Beach, Davie
7. Fort Bend County, TX

- Projected population, 2100: 2,930,528 residents (+1,926,002 increase from 2025)
- Current population, 2025: 1,004,526 residents
- Average summer temperature, 2024: 84.7°F (+2.3 from normal)
- Normal summer temperature, 1901-2000: 82.3°F
- Largest cities: Sugar Land, Missouri City, Rosenberg, Mission Bend, Fresno, Pecan Grove, Fulshear
6. Orange County, FL

- Projected population, 2100: 3,607,781 residents (+1,989,556 increase from 2025)
- Current population, 2025: 1,618,226 residents
- Average summer temperature, 2024: 84.1°F (+3.1 from normal)
- Normal summer temperature, 1901-2000: 81.0°F
- Largest cities: Orlando, Alafaya, Pine Hills, Horizon West, Apopka, Ocoee, Winter Garden
5. Clark County, NV

- Projected population, 2100: 4,596,916 residents (+2,092,815 increase from 2025)
- Current population, 2025: 2,504,101 residents
- Average summer temperature, 2024: 88.8°F (+6.3 from normal)
- Normal summer temperature, 1901-2000: 82.5°F
- Largest cities: Las Vegas, Henderson, North Las Vegas, Enterprise, Spring Valley, Sunrise Manor, Paradise
4. King County, WA

- Projected population, 2100: 5,407,730 residents (+2,831,245 increase from 2025)
- Current population, 2025: 2,576,485 residents
- Average summer temperature, 2024: 61.5°F (+2.4 from normal)
- Normal summer temperature, 1901-2000: 59.1°F
- Largest cities: Seattle, Bellevue, Kent, Renton, Federal Way, Kirkland, Auburn
3. Bexar County, TX

- Projected population, 2100: 5,533,242 residents (+3,196,391 increase from 2025)
- Current population, 2025: 2,336,851 residents
- Average summer temperature, 2024: 85.6°F (+2.4 from normal)
- Normal summer temperature, 1901-2000: 83.2°F
- Largest cities: San Antonio, Schertz, Timberwood Park, Converse, Universal City, Live Oak, Leon Valley
2. Maricopa County, AZ

- Projected population, 2100: 9,247,439 residents (+4,268,236 increase from 2025)
- Current population, 2025: 4,979,203 residents
- Average summer temperature, 2024: 92.6°F (+5.7 from normal)
- Normal summer temperature, 1901-2000: 86.9°F
- Largest cities: Phoenix, Mesa, Chandler, Gilbert, Glendale, Scottsdale, Peoria
1. Harris County, TX

- Projected population, 2100: 12,109,958 residents (+6,538,465 increase from 2025)
- Current population, 2025: 5,571,493 residents
- Average summer temperature, 2024: 84.7°F (+2.3 from normal)
- Normal summer temperature, 1901-2000: 82.4°F
- Largest cities: Houston, Pasadena, Atascocita, Baytown, Spring, Channelview, La Porte
Contact [email protected] for any questions or corrections.