Longview, TX Is Among the US Cities with the Longest Workweeks
Record numbers of Americans have quit their jobs in recent months. In what has been dubbed “The Great Resignation,” one-in-four U.S. workers left their job in 2021. Much of the exodus is being driven by employee burnout, which often results…

Record numbers of Americans have quit their jobs in recent months. In what has been dubbed “The Great Resignation,” one-in-four U.S. workers left their job in 2021. Much of the exodus is being driven by employee burnout, which often results from spending too much time at work.
Partly in an effort to reduce the likelihood of employee burnout, governments and companies are experimenting with four-day workweeks. Following successful trial runs in Iceland and New Zealand, Scotland is set to implement its own four-day workweek trial period, without pay reduction. The Japanese government actively encourages companies to use the four-day workweek model. Here is a look at how long the typical work week is around the world.
In the United States, meanwhile, the five-day workweek remains the norm. According to the U.S. Census Bureau, American workers in the 16 to 64 age group usually work an average of 38 hours and 48 minutes per week. But how much time people spend at work could depend on where they live, as in some parts of the country, the typical workweek is far longer.
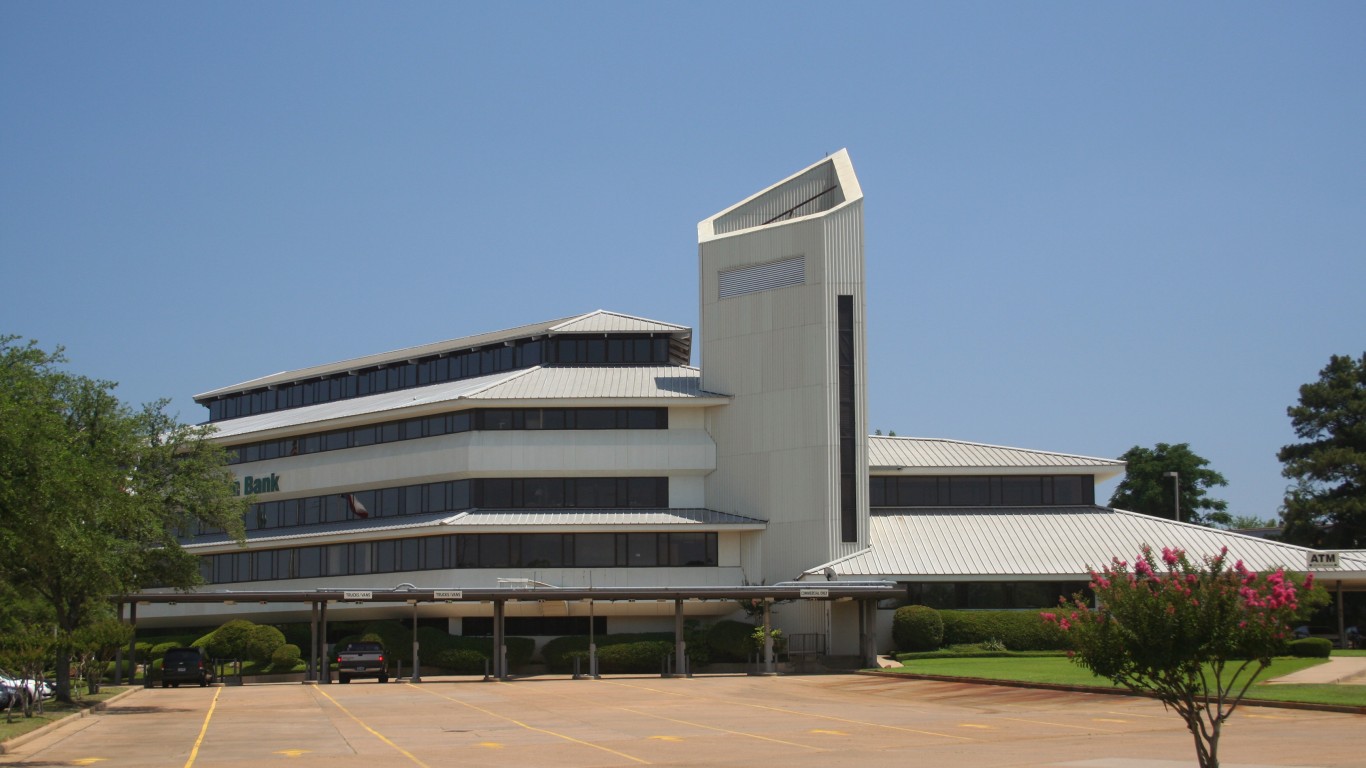
The average workweek in Longview, Texas, is 41 hours and 12 minutes, making the metro area one of only five nationwide — where the military accounts for less than 10% of employment — where the average workweek exceeds 41 hours. The area’s longer workweeks are partially attributable to the local industrial composition. For example, the mining, logging, and construction sector has the longest workweek on average nationwide — and in Longview, it is the second largest non-government employer, accounting for 13.5% of all jobs.
Despite longer than average working hours, incomes are not especially high in the Longview metro area. Average income per capita in the area is just $28,898, well below the $35,672 national average.
Metro areas are ranked on mean hours worked per week among full time and part time workers in the 16 to 64 age group with data from the U.S. Census Bureau’s 2019 American Community Survey. Because working-day length can vary considerably for U.S. service members, metro areas where 10% or more of the labor force are in the military were excluded from analysis. Supplemental data is from both the Bureau of Labor Statistics and the ACS. In the case of a tie, the metro area with the longer average commute time ranked higher.
| Rank | Metro area | Avg. hours worked per week | Avg. commute time (minutes) | Avg. income per capita ($) |
|---|---|---|---|---|
| 1 | Odessa, TX | 42.8 | 24.5 | 28,582 |
| 2 | Midland, TX | 42.1 | 20.6 | 37,108 |
| 3 | Longview, TX | 41.5 | 24.1 | 28,898 |
| 4 | San Angelo, TX | 41.4 | 20.3 | 29,184 |
| 5 | Casper, WY | 41.2 | 18.3 | 32,934 |
| 6 | Twin Falls, ID | 40.9 | 18.4 | 26,923 |
| 7 | Elizabethtown-Fort Knox, KY | 40.8 | 25.5 | 28,963 |
| 8 | Alexandria, LA | 40.6 | 27.9 | 26,715 |
| 9 | Tyler, TX | 40.6 | 25.9 | 29,053 |
| 10 | Houma-Thibodaux, LA | 40.5 | 26.8 | 27,421 |
| 11 | Grand Island, NE | 40.5 | 20.5 | 29,504 |
| 12 | Houston-The Woodlands-Sugar Land, TX | 40.3 | 30.7 | 35,190 |
| 13 | Charleston-North Charleston, SC | 40.3 | 27.6 | 38,050 |
| 14 | Dallas-Fort Worth-Arlington, TX | 40.1 | 28.6 | 36,274 |
| 15 | Anchorage, AK | 40.1 | 23.1 | 38,842 |
| 16 | Hattiesburg, MS | 40.1 | 22.8 | 25,247 |
| 17 | Owensboro, KY | 40.1 | 22.7 | 29,270 |
| 18 | Corpus Christi, TX | 40.1 | 20.9 | 27,286 |
| 19 | Staunton, VA | 40.0 | 22.4 | 30,079 |
| 20 | Amarillo, TX | 40.0 | 21.1 | 28,233 |
| 21 | Sioux Falls, SD | 40.0 | 19.4 | 34,878 |
| 22 | Greeley, CO | 39.9 | 28.3 | 33,863 |
| 23 | Charleston, WV | 39.9 | 24.6 | 28,107 |
| 24 | Savannah, GA | 39.9 | 24.4 | 31,541 |
| 25 | Shreveport-Bossier City, LA | 39.9 | 23.2 | 27,807 |
| 26 | Farmington, NM | 39.9 | 22.8 | 21,626 |
| 27 | Texarkana, TX-AR | 39.9 | 20.7 | 26,165 |
| 28 | Hilton Head Island-Bluffton, SC | 39.8 | 23.3 | 41,421 |
| 29 | Montgomery, AL | 39.8 | 22.5 | 29,094 |
| 30 | Wausau-Weston, WI | 39.8 | 19.6 | 32,924 |
| 31 | Cheyenne, WY | 39.8 | 17.5 | 39,791 |
| 32 | Gainesville, GA | 39.7 | 29.8 | 32,667 |
| 33 | Birmingham-Hoover, AL | 39.7 | 28.1 | 33,131 |
| 34 | Gadsden, AL | 39.7 | 26.2 | 25,065 |
| 35 | Tulsa, OK | 39.7 | 22.2 | 32,380 |
| 36 | Jefferson City, MO | 39.7 | 22.0 | 29,475 |
| 37 | Fond du Lac, WI | 39.7 | 21.2 | 33,847 |
| 38 | Atlanta-Sandy Springs-Alpharetta, GA | 39.6 | 32.5 | 37,331 |
| 39 | Hammond, LA | 39.6 | 31.6 | 24,217 |
| 40 | San Antonio-New Braunfels, TX | 39.6 | 27.4 | 29,802 |
| 41 | Michigan City-La Porte, IN | 39.6 | 25.6 | 28,484 |
| 42 | Florence, SC | 39.6 | 24.7 | 25,901 |
| 43 | Lebanon, PA | 39.6 | 24.1 | 29,629 |
| 44 | Spartanburg, SC | 39.6 | 23.9 | 27,969 |
| 45 | Oklahoma City, OK | 39.6 | 23.7 | 32,577 |
| 46 | Columbus, GA-AL | 39.6 | 22.2 | 27,286 |
Sam Stebbins is a writer at 247WallSt.com where his primary focus is on government policy, politics, companies, and broad social and economic trends. Sam has been writing in the money and news verticals for over 8 years and holds a bachelor's degree from Hobart College, which he earned in 2010. Sam resides in upstate New York and enjoys hiking, biking, canoeing, and skiing in the Adirondack Mountains and across the Northeast.