The United States has some of the highest levels of income and wealth inequality in the world. U.S. Federal Reserve data shows that the wealthiest 10% of Americans control $93.8 trillion, more than double the $40.3 trillion in the hands of the remaining 90% of Americans.
The income and wealth divide only appears to be growing wider. A January 2020 report published by the Pew Research Center found that over the last four decades, income growth for the top 5% of families by earnings has far outpaced income growth for families in the lower income strata.
In a nation as large as the U.S., varied levels of income inequality may be expected, and in a few areas in the country, extreme wealth and extreme poverty exist side by side. In nearly every state, there is at least one city where income inequality is far more pronounced than it is on average nationwide.
Based on the Gini coefficient, a measure of income inequality expressed on a 0 to 1 scale where 0 represents perfect equality and 1 represents the highest level of inequality, Charleston has the worst inequality in West Virginia.
According to the U.S. Census Bureau, the Gini coefficient in Charleston stands at 0.551, the highest of any city in West Virginia. For context, the statewide Gini score stands at 0.467.
In Charleston, the top 20% of households by earnings account for 58.3% of all income in the area, while the bottom 20% of households account for just 2.3% of earnings. Across the state, the disparity is less pronounced, with the highest earning 20% of households accounting for 49.9% of income versus 3.3% for the bottom 20% of earners.
All data in this story are five-year estimates from the U.S. Bureau’s 2019 American Community Survey. For comparison purposes, all places covered by the census with populations above 25,000 — including towns, boroughs, municipalities, and unincorporated communities — were considered cities.
| City | Gini score | Share of income earned by wealthiest 20% of households (%) | Share of income earned by poorest 20% of households (%) |
|---|---|---|---|
| Alabama: Auburn | 0.553 | 56.1 | 1.0 |
| Alaska: Anchorage | 0.430 | 47.2 | 4.1 |
| Arizona: Catalina Foothills | 0.507 | 54.1 | 2.9 |
| Arkansas: Little Rock | 0.533 | 56.9 | 2.7 |
| California: Beverly Hills | 0.586 | 62.5 | 1.6 |
| Colorado: Boulder | 0.533 | 55.6 | 1.9 |
| Connecticut: New Haven | 0.520 | 54.7 | 2.4 |
| Delaware: Wilmington | 0.544 | 56.7 | 1.9 |
| Florida: Miami Beach | 0.606 | 64.4 | 2.0 |
| Georgia: Atlanta | 0.581 | 61.1 | 1.8 |
| Hawaii: Honolulu | 0.473 | 50.7 | 3.0 |
| Idaho: Rexburg | 0.494 | 52.7 | 3.1 |
| Illinois: Carbondale | 0.599 | 62.5 | 1.1 |
| Indiana: West Lafayette | 0.578 | 59.7 | 1.1 |
| Iowa: Iowa City | 0.511 | 53.0 | 1.9 |
| Kansas: Leawood | 0.504 | 54.9 | 3.1 |
| Kentucky: Richmond | 0.504 | 53.0 | 2.8 |
| Louisiana: Monroe | 0.591 | 62.2 | 1.7 |
| Maine: Bangor | 0.509 | 54.1 | 2.9 |
| Maryland: Baltimore | 0.515 | 54.0 | 2.3 |
| Massachusetts: Boston | 0.539 | 55.6 | 1.7 |
| Michigan: East Lansing | 0.561 | 57.3 | 1.3 |
| Minnesota: Edina | 0.537 | 57.0 | 2.4 |
| Mississippi: Oxford | 0.554 | 57.7 | 1.5 |
| Missouri: University City | 0.578 | 61.2 | 1.8 |
| Montana: Missoula | 0.487 | 51.9 | 3.1 |
| Nebraska: Omaha | 0.472 | 50.8 | 3.3 |
| Nevada: Winchester | 0.533 | 56.7 | 2.9 |
| New Hampshire: Concord | 0.449 | 48.5 | 3.5 |
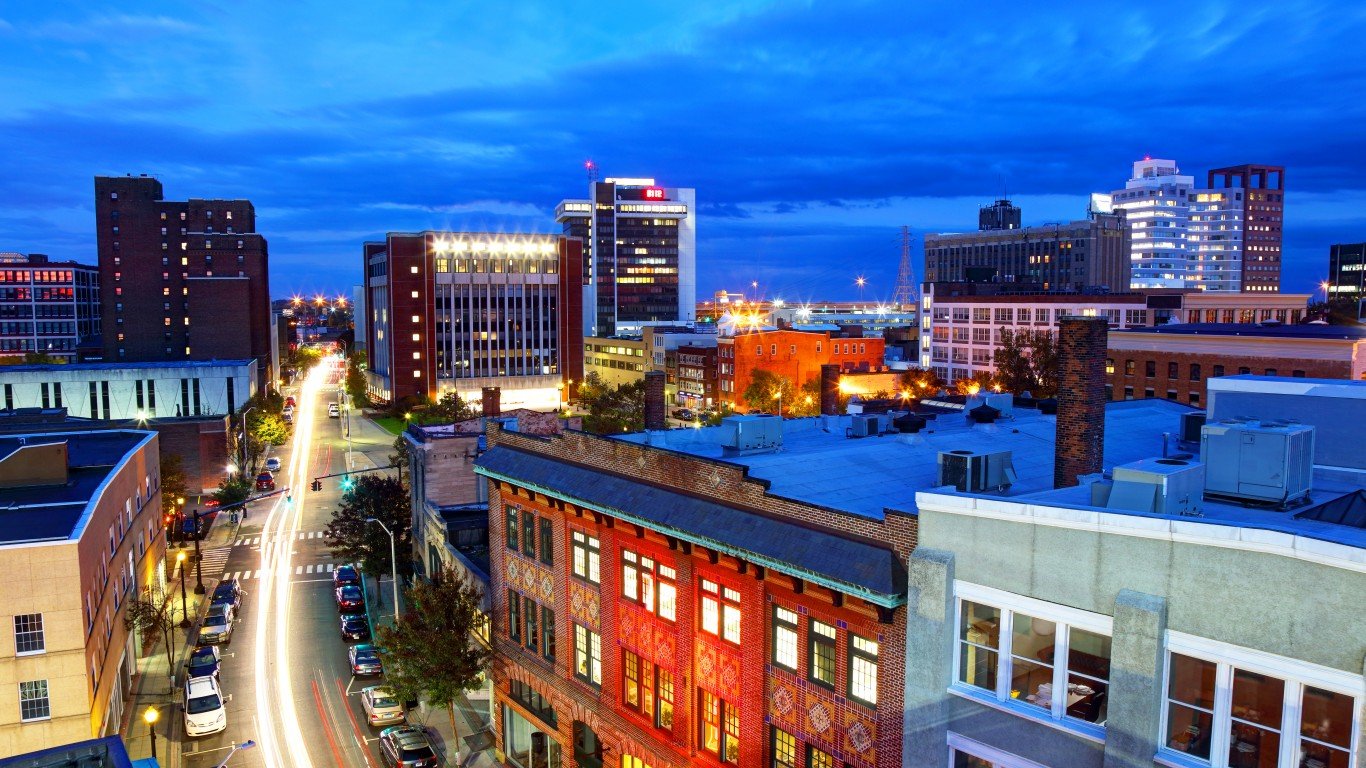
| New Jersey: Princeton | 0.563 | 58.8 | 1.8 |
| New Mexico: Las Cruces | 0.486 | 51.3 | 2.7 |
| New York: Ithaca | 0.583 | 60.1 | 1.0 |
| North Carolina: Chapel Hill | 0.549 | 56.7 | 1.8 |
| North Dakota: Grand Forks | 0.489 | 51.3 | 2.7 |
| Ohio: Cincinnati | 0.541 | 56.8 | 2.2 |
| Oklahoma: Stillwater | 0.561 | 57.7 | 1.5 |
| Oregon: Corvallis | 0.504 | 52.6 | 2.2 |
| Pennsylvania: State College | 0.569 | 59.0 | 0.9 |
| Rhode Island: Providence | 0.541 | 56.5 | 2.2 |
| South Carolina: Columbia | 0.548 | 57.6 | 2.0 |
| South Dakota: Rapid City | 0.473 | 51.3 | 3.6 |
| Tennessee: Johnson City | 0.541 | 57.2 | 2.4 |
| Texas: Texarkana | 0.550 | 57.7 | 2.1 |
| Utah: Salt Lake City | 0.501 | 53.5 | 2.8 |
| Vermont: Burlington | 0.496 | 52.1 | 2.7 |
| Virginia: Blacksburg | 0.588 | 59.5 | 0.5 |
| Washington: Pullman | 0.555 | 57.8 | 1.5 |
| West Virginia: Charleston | 0.551 | 58.3 | 2.3 |
| Wisconsin: La Crosse | 0.481 | 51.9 | 3.6 |
| Wyoming: Laramie | 0.462 | 49.5 | 3.3 |